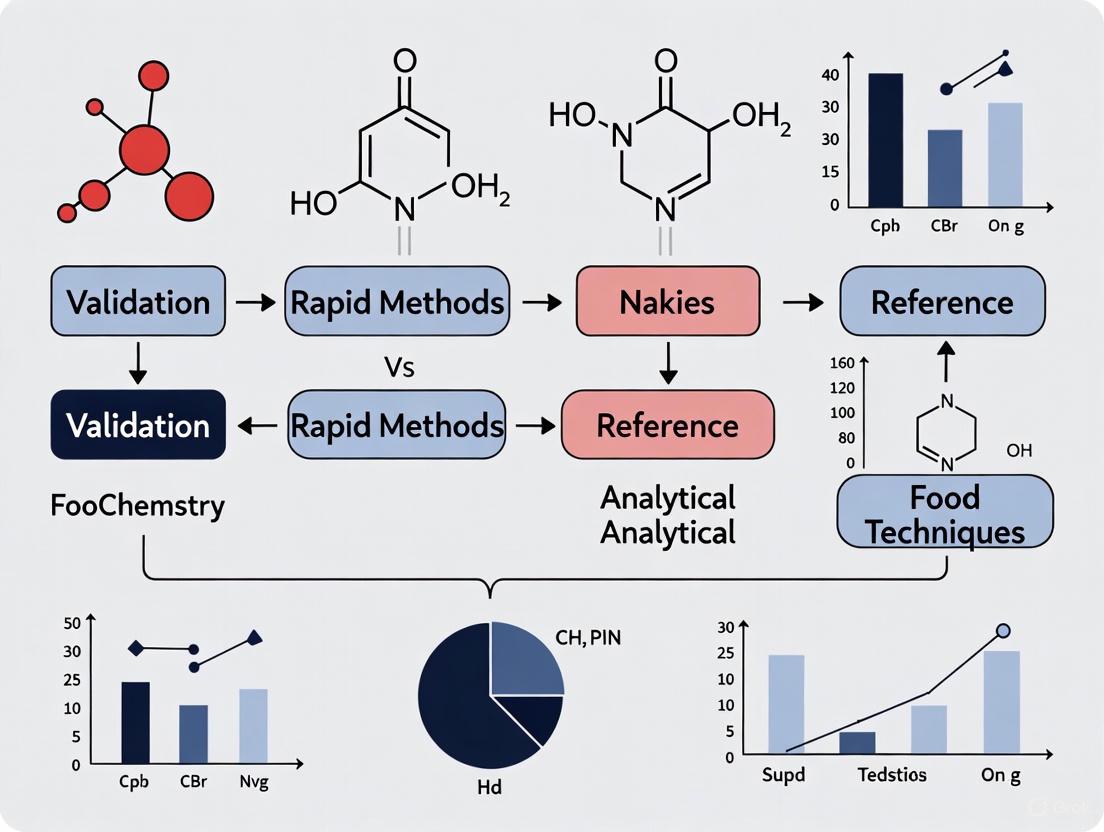
Validation of Rapid Methods vs. Reference Techniques: A Strategic Guide for Drug Development
This article provides a comprehensive framework for researchers and scientists in drug development to validate rapid analytical methods against traditional reference techniques.
Validation of Rapid Methods vs. Reference Techniques: A Strategic Guide for Drug Development
Abstract
This article provides a comprehensive framework for researchers and scientists in drug development to validate rapid analytical methods against traditional reference techniques. It covers the foundational principles of analytical validation, explores a spectrum of rapid methodologies from nucleic-acid based assays to biosensors, and addresses common troubleshooting and optimization challenges. A core focus is placed on the strategic, step-by-step process for conducting rigorous comparative studies, ensuring that new methods meet regulatory standards for accuracy, precision, and reliability to accelerate timelines without compromising quality.
The Critical Need for Speed: Why Rapid Method Validation is Essential in Modern Pharma
In the pharmaceutical industry, compendial methods—those detailed in official compendia such as the United States Pharmacopeia (USP)—have long been the gold standard for quality control testing. These methods, which include traditional culture-based techniques for microbiological quality control, provide the legal standards for assessing pharmaceutical products according to Section 501 of the Federal Food, Drug, and Cosmetic Act [1]. However, the evolving demands of modern drug development and manufacturing are increasingly exposing significant limitations in these traditional approaches. This guide objectively compares the performance of traditional compendial methods with emerging rapid microbiological methods (RMMs), focusing on the critical constraints of time, labor, and analytical sensitivity. The validation of these rapid methods against established compendial standards, guided by frameworks such as USP <1223>, ensures their reliability and suitability for intended use while addressing the pressing needs of contemporary pharmaceutical quality control [2].
Experimental Protocols for Comparative Evaluation
Protocol 1: Water System Monitoring for Microbial Contamination
This protocol compares the traditional heterotrophic plate count method with an ATP bioluminescence-based rapid method for monitoring microbial quality in pharmaceutical water systems [3].
- Sample Collection: Water samples are aseptically collected from various points in the water production and distribution loops.
- Traditional Compendial Method (Heterotrophic Plate Count): Each sample is filtered through a 0.45µm membrane. The membrane is placed onto R2A agar in duplicate and incubated at 30°C for 5 days. After incubation, developed colonies are counted manually [3].
- Rapid Method (ATP Bioluminescence - Pallchek System): The sample is filtered, and the membrane is placed in a test plate. For direct measurement, reagents are added to lyse microbial cells and release intracellular ATP. A luciferin-luciferase enzyme reagent is then added, producing light measured as Relative Light Units (RLU) by a luminometer. For a lower detection limit, an indirect method incorporates an enrichment step where the filtered sample is incubated in liquid culture media for 24 hours before ATP measurement [3].
- Data Analysis: Results from the rapid method (available in minutes or 24 hours) are compared against the 5-day plate count for equivalence, determining correlation factors between RLU and colony-forming units (cfu).
Protocol 2: Rapid GC-MS Screening for Seized Drugs
This protocol, while from a forensic context, illustrates the principles of method acceleration and was validated according to rigorous standards [4].
- Sample Preparation: Solid samples are ground and extracted with methanol via sonication and centrifugation. Trace samples are collected with methanol-moistened swabs, which are then vortexed in methanol for extraction [4].
- Conventional GC-MS Method: The extract is analyzed using a 30-m DB-5 ms column with a temperature program that results in a total run time of approximately 30 minutes [4].
- Rapid GC-MS Method: The same sample extract is analyzed using an optimized method on the same instrument type. The method employs a drastically accelerated temperature ramp and adjusted carrier gas flow, reducing the total analysis time to 10 minutes [4].
- Validation and Comparison: The rapid method is validated for parameters including detection limit, repeatability, reproducibility, and carryover. Its performance is directly compared to the conventional method using the same set of samples, and the results are confirmed with mass spectral library matching [4].
Comparative Performance Data: Traditional vs. Rapid Methods
Table 1: Quantitative Comparison of Method Performance Characteristics
| Performance Characteristic | Traditional Heterotrophic Plate Count (Water) | Rapid ATP Bioluminescence (Direct) | Rapid ATP Bioluminescence (Indirect) | Conventional GC-MS (Drugs) | Rapid GC-MS (Drugs) |
|---|---|---|---|---|---|
| Time to Result | 5 days [3] | ~1 minute [3] | ~24 hours [3] | ~30 minutes [4] | ~10 minutes [4] |
| Detection Limit | 1 cfu/sample (theoretical) | 100-1000 cfu [3] | 1 cfu [3] | Cocaine: 2.5 µg/mL [4] | Cocaine: 1.0 µg/mL [4] |
| Labor Intensity | High (manual plating, counting) | Low (automated reading) | Moderate (enrichment handling) | High (long run times) | Low (fast run times) |
| Sensitivity to Stressed Cells | Poor (may not grow) [3] | Good (detects cellular ATP) | Excellent (after growth) | N/A | N/A |
| Precision (Repeatability) | Dependent on analyst skill | RSD < 0.25% for stable compounds [4] | RSD < 0.25% for stable compounds [4] | Dependent on method | Excellent (RSD < 0.25%) [4] |
Table 2: Impact on Operational and Decision-Making Processes
| Operational Aspect | Impact of Traditional Methods | Impact of Rapid Methods |
|---|---|---|
| Corrective Action Delay | Up to 5 days for water OOS results, risking underestimation of contamination and ineffective action [3] | Same-day or real-time results enable immediate corrective actions [3] |
| Process Monitoring | Retrospective analysis only | Near real-time data allows for proactive process control and adjustment (PAT) [3] |
| Laboratory Efficiency | Low throughput; analyst time consumed by manual tasks [3] | High throughput; automation frees analyst time for other tasks [2] |
| Inventory Management | Finished products held until microbiological results are available | Potential for significantly reduced quarantine times for finished products [2] |
Visualizing the Method Workflows
Traditional vs. Rapid Microbial Method Workflow
The Scientist's Toolkit: Essential Research Reagent Solutions
The following table details key reagents, materials, and instruments critical for implementing the rapid methods discussed in this guide.
Table 3: Key Reagents and Instruments for Rapid Method Implementation
| Item | Function/Description | Application in Featured Experiments |
|---|---|---|
| ATP Bioluminescence Reagents | Cell lysis reagent releases intracellular ATP; luciferin-luciferase enzyme produces light proportional to ATP concentration [3]. | Used in the Pallchek Rapid Microbiology System for rapid detection of microbial contamination in water samples [3]. |
| R2A Agar | Low-nutrient culture medium designed to support the growth of stressed and chlorine-injured microorganisms commonly found in water systems. | The standard medium used in the traditional heterotrophic plate count method for water system monitoring [3]. |
| DB-5 ms GC Column (30 m × 0.25 mm × 0.25 µm) | A (5%-phenyl)-methylpolysiloxane capillary column widely used for the separation of semi-volatile organic compounds. | Used in both the conventional and optimized rapid GC-MS methods for drug screening, enabling the accelerated analysis [4]. |
| Reference Standards & Materials | Analyte samples of known purity and concentration, crucial for method calibration, qualification, and ensuring accuracy [1] [5]. | Used in USP compendial assays and for establishing correlation curves (e.g., RLU vs. cfu, RLU vs. ATP) during RMM validation [3] [1]. |
| High-Sensitivity Luminometer | Instrument containing a photomultiplier tube to detect and amplify photon signals, converting them to Relative Light Units (RLU) [3]. | Core component of the Pallchek system for measuring the bioluminescence signal generated by the ATP reaction [3]. |
The limitations of traditional compendial methods in time, labor, and sensitivity are no longer theoretical concerns but demonstrable realities that impact pharmaceutical quality control and operational efficiency. As the presented experimental data and workflows illustrate, rapid methods such as ATP bioluminescence and accelerated GC-MS offer transformative advantages. They provide critical quality results in minutes or hours instead of days, reduce manual labor through automation, and can offer superior or equivalent analytical performance. The robust validation frameworks established by USP <1223> and other regulatory guidelines provide the necessary pathway for laboratories to confidently adopt these technologies. For researchers and drug development professionals, the objective evidence strongly supports the integration of validated rapid methods as a means to enhance product safety, streamline manufacturing processes, and advance modern quality control paradigms.
In the competitive and highly regulated field of drug development, the adoption of Rapid Microbiological Methods (RMMs) represents a significant shift from traditional, culture-based techniques. This guide objectively compares these rapid methods against reference analytical techniques, framing the discussion within the critical context of method validation as required by leading regulatory bodies such as the United States Pharmacopeia (USP) and the European Pharmacopoeia (Ph. Eur.) [6].
Core Principles of Rapid Methods
Rapid Methods are defined by their ability to provide faster detection, quantification, or identification of microorganisms compared to traditional plate-based or culture methods, which can take days or weeks to yield results [6]. The core principles that underpin their drive for efficiency include:
- Speed and Timeliness: Delivering results in hours rather than days, enabling faster decision-making and product release [6].
- Automation and Efficiency: Utilizing technologies that reduce manual intervention and streamline workflows [6].
- Accuracy and Precision: Ensuring results are both correct and reproducible [6].
- Robustness and Reliability: Performing consistently under varied but realistic operating conditions [6].
These principles are operationalized through a rigorous validation process, which is paramount to ensuring that RMMs are not just faster, but also equivalent or superior in performance to the compendial methods they are intended to replace [6].
Comparative Analysis: RMMs vs. Traditional Methods
The following table summarizes a quantitative comparison of key performance indicators between Rapid Microbiological Methods and traditional, culture-based techniques.
| Performance Indicator | Rapid Microbiological Methods (RMMs) | Traditional Culture-Based Methods |
|---|---|---|
| Time to Result | Hours to a maximum of 2-3 days [6] | 5 to 7 days, or longer for slow-growing organisms [6] |
| Level of Automation | High (e.g., automated detection systems) [6] | Low (primarily manual processes) |
| Potential for Real-Time Data | Yes (e.g., ATP bioluminescence) [6] | No |
| Key Validation Parameter: Accuracy | Measured against known concentrations of microorganisms; must demonstrate equivalence to compendial method [6] | Established as the reference standard |
| Key Validation Parameter: Precision | Evaluates reproducibility (repeatability & intermediate precision) [6] | Inherently variable due to manual techniques |
| Key Validation Parameter: Specificity | Must detect target organisms without matrix interference [6] | Generally high, but can be affected by sample matrix |
Experimental Protocols for Validation
For a rapid method to be accepted for use in a regulated environment like pharmaceutical manufacturing, it must undergo a formal validation. The following workflow, based on USP <1223> and Ph. Eur. 5.1.6 guidelines, details the key phases and activities in this process [6].
Detailed Methodology of Key Experiments
The validation parameters listed in Phase 3 are assessed through specific experimental protocols:
- Accuracy: The RMM is used to test samples spiked with a known concentration of a specific microorganism (e.g., E. coli). The results are compared to the true value and the result from the compendial method. The percentage recovery is calculated to demonstrate closeness to the true value [6].
- Precision: The same homogeneous sample is tested multiple times under identical conditions (repeatability) and by different analysts or on different days using the same instrument (intermediate precision). The standard deviation and coefficient of variation of the results are calculated to confirm reproducibility [6].
- Specificity and Matrix Interference: The product sample (e.g., a cream or solution) is spiked with a low level of a target organism. The RMM's ability to detect the organism in the presence of the product matrix is compared to its detection in a neutral control. This demonstrates that the product does not cause inhibitory (false negative) or enhancing (false positive) effects [6].
- Limit of Detection (LOD) and Quantification (LOQ): Samples are spiked with serial dilutions of a microorganism to determine the lowest level that can be reliably detected (LOD) and the lowest level that can be quantified with acceptable precision and accuracy (LOQ) [6].
The Scientist's Toolkit: Essential Research Reagents and Materials
The successful validation and implementation of an RMM rely on a set of essential materials and reagents.
| Item | Function in Validation |
|---|---|
| Reference Microorganism Strains | Certified cultures used to spike samples for accuracy, precision, and LOD/LOQ studies. They provide a known, standardized baseline for all tests [6]. |
| Product-Specific Matrix | The actual drug product or a placebo used to conduct interference studies. It is critical for proving the method works in the real sample, not just in ideal lab conditions [6]. |
| Compendial Method Materials | The components of the traditional method (e.g., agar plates, broths, membrane filters) used for parallel testing to demonstrate equivalency [6]. |
| Calibration Standards | For quantitative RMMs, these standards are used to ensure the instrument's readings are accurate across the intended measurement range [6]. |
| Neutralizing Agents | Used in sample preparation to inactivate antimicrobial properties of the product, ensuring any microorganisms present can be detected by the RMM [6]. |
The drive for efficiency in drug development, fueled by the need for faster product release and enhanced contamination control, makes Rapid Microbiological Methods an indispensable tool. The foundational principle, however, remains that speed must not come at the cost of reliability. A rigorous, structured validation framework—as outlined in USP <1223> and Ph. Eur. 5.1.6—ensures that these rapid methods provide accurate, precise, and defensible data. For researchers and scientists, mastering this validation process is not just a regulatory hurdle but a critical competency that enables the adoption of innovative technologies, ultimately contributing to a more agile and quality-focused pharmaceutical industry [6].
In the pharmaceutical sciences, the validation of analytical methods is a critical prerequisite for ensuring the quality, safety, and efficacy of drug substances and products. This process provides documented evidence that an analytical procedure is suitable for its intended use [7]. Within the broader research context of comparing rapid microbiological and analytical methods against traditional reference techniques, the evaluation of key performance parameters becomes paramount [6] [8]. Regulatory guidelines from the International Council for Harmonisation (ICH), United States Pharmacopeia (USP), and other bodies mandate the assessment of specific characteristics to demonstrate method reliability [9] [7].
This guide focuses on four fundamental validation parameters—Accuracy, Precision, Specificity, and Robustness—objectively comparing their performance in rapid methods versus compendial reference techniques. The shift towards rapid methods, such as those for sterility testing or pesticide residue analysis, is driven by the need for faster results, improved efficiency, and enhanced contamination control [6] [10] [11]. However, these innovative methods must undergo rigorous validation to prove they are at least equivalent to, or superior than, established traditional methods before they can be adopted for product release decisions [6] [8].
Defining the Key Parameters
Accuracy
Accuracy measures the closeness of agreement between the value found by the analytical method and the true value or an accepted reference value [9] [7] [12]. It is typically expressed as the percentage recovery of a known amount of analyte spiked into the sample matrix [9] [7]. For instance, in the validation of a method for pesticide residues in okra, accuracy was demonstrated by spiking samples with known concentrations of pesticides and achieving average recoveries of more than 70%, which fell within acceptable validation criteria [10].
Precision
Precision describes the closeness of agreement between a series of measurements obtained from multiple sampling of the same homogeneous sample under the prescribed conditions [7]. It is usually expressed as standard deviation or relative standard deviation (RSD) and is considered at three levels:
- Repeatability: Precision under the same operating conditions over a short interval of time (e.g., same analyst, same equipment) [13] [7].
- Intermediate Precision (Ruggedness): Precision within the same laboratory but with variations like different days, different analysts, or different equipment [7].
- Reproducibility: Precision between different laboratories, often assessed in collaborative studies [7].
It is crucial to remember that a method can be precise without being accurate, for example, if consistent results are obtained but are all biased away from the true value due to a systematic error [13] [12] [14].
Specificity
Specificity is the ability of the method to assess the analyte unequivocally in the presence of other components that may be expected to be present in the sample matrix, such as impurities, degradation products, or excipients [6] [7]. For chromatographic methods, this is often demonstrated by showing that the analyte peak is well-resolved from other peaks and that the response is not interfered with by the blank matrix [10]. In microbiological methods like sterility testing, specificity is demonstrated through the method's ability to detect a range of relevant microorganisms in the presence of the product [6] [11].
Robustness
Robustness evaluates the capacity of a method to remain unaffected by small, deliberate variations in method parameters, such as temperature, pH, mobile phase composition, or reagent concentration [6] [7]. A robust method is reliable during normal usage and is less likely to fail when transferred between laboratories or when minor operational fluctuations occur [6].
Comparative Experimental Data: Rapid Methods vs. Reference Techniques
The following tables summarize experimental data from published studies comparing rapid methods with traditional reference techniques across different application fields.
Table 1: Comparison of Sterility Testing Methods [11]
| Parameter | Pharmacopoeial Sterility Test (Reference) | BacT/Alert 3D System (Rapid Method) |
|---|---|---|
| Principle | Turbidity (visual inspection) | Colorimetric CO₂ detection (automated) |
| Incubation Time | 14 days | ≤ 7 days (most detections in 1-3 days) |
| Culture Media | FTM and SCDM | SA, SN, FA, FN, iAST, iNST, iLYM |
| Specificity (Ability to detect challenge microorganisms) | Detected all challenge microorganisms | Equivalent detection of all challenge microorganisms with no significant difference |
| Key Advantage | Compendial standard; well-established | Rapid detection; automated monitoring; reduced labor |
Table 2: Comparison of Analytical Methods for Pesticide Residues in Okra [10]
| Parameter | Traditional Validation (Reference Expectations) | Validated Rapid HPLC/GC Method with QuEChERS |
|---|---|---|
| Analytical Technique | Various | HPLC/GC |
| Sample Preparation | Varies, often complex | Modified QuEChERS (rapid, simple) |
| Linearity (r²) | > 0.99 | > 0.99 for all three pesticides |
| Accuracy (Average Recovery) | Acceptable range (e.g., 70-120%) | > 70% at 0.30 mg/kg |
| Precision (RSD) | < 20% | < 20% |
| Matrix Effect | Should be minimal | Within ±20% |
Table 3: General Comparison of Method Validation vs. Verification [8]
| Comparison Factor | Method Validation (for new methods) | Method Verification (for compendial methods) |
|---|---|---|
| Scope | Comprehensive, all parameters assessed | Limited, focused on critical parameters |
| Accuracy & Precision | Fully characterized and documented | Confirmed for the lab's specific conditions |
| Specificity | Demonstrated for analyte in matrix | Typically inferred from validation data |
| Robustness | Often evaluated | Not typically re-evaluated |
| Regulatory Suitability | Required for new drug applications | Acceptable for standard methods |
| Implementation Time | Weeks or months | Days |
Detailed Experimental Protocols
Protocol for Validating a Rapid Microbiological Method (RMM)
This protocol aligns with the requirements of USP <1223> and Ph. Eur. 5.1.6 for demonstrating equivalency to a compendial sterility test [6] [11].
- Define Purpose and Scope: Clearly state the intended use of the RMM, e.g., for sterility testing of an injectable product.
- Method Equivalency Study:
- Sample Inoculation: Use a statistically appropriate number of test samples. Artificially contaminate some samples with a low level (e.g., < 100 CFU) of suitable challenge microorganisms (Staphylococcus aureus, Pseudomonas aeruginosa, Bacillus subtilis, Clostridium sporogenes, Candida albicans, Aspergillus brasiliensis).
- Parallel Testing: Test each sample simultaneously using both the RMM (e.g., BacT/Alert culture bottles) and the pharmacopoeial method (FTM and SCDM media).
- Culturing and Detection: Incubate the compendial method for 14 days with visual inspection for turbidity. Incubate the RMM according to the manufacturer's instructions (e.g., in the BacT/Alert 3D system, which monitors continuously for ~7 days).
- Data Collection: Record the time to detection for each positive sample in the RMM and the final positive/negative results for both methods after the full incubation periods.
- Data Analysis: Compare the results using statistical methods (e.g., Chi-square) to demonstrate that there is no statistically significant difference in the ability of the two methods to detect microbial contamination. The RMM should detect the same positives as the reference method, often in a significantly shorter time [11].
Protocol for Assessing Accuracy and Precision in a Chemical Assay
This protocol is based on ICH Q2(R1) guidelines and is applicable for quantifying an active ingredient in a drug product [7].
- Accuracy by Recovery:
- Sample Preparation: Prepare a synthetic mixture of the drug product excipients without the active ingredient (placebo). If this is not possible, use a test sample with a known background level of the analyte.
- Spiking: Spike the placebo or test sample with known amounts of the analyte of known purity at three concentration levels (e.g., 80%, 100%, and 120% of the target test concentration). Prepare each level in triplicate.
- Analysis: Analyze the spiked samples using the complete analytical procedure.
- Calculation: Calculate the recovery (%) for each sample using the formula:
Recovery (%) = (Measured Concentration / Theoretical Concentration) * 100. Report the mean recovery and confidence intervals for each level.
- Precision (Repeatability):
- Analysis: Analyze a minimum of 6 determinations at 100% of the test concentration, or a minimum of 9 determinations covering the reportable range (e.g., 3 concentrations x 3 replicates).
- Calculation: Calculate the standard deviation and relative standard deviation (RSD) for the set of measurements.
Visualization of Validation Workflows and Relationships
Rapid Method Validation Workflow
The following diagram illustrates the key stages in validating a rapid method against a reference technique.
Diagram Title: Rapid Method Validation Workflow
Relationship Between Accuracy and Precision
This diagram clarifies the conceptual relationship between accuracy and precision, a fundamental concept in method validation.
Diagram Title: Accuracy and Precision Relationship
The Scientist's Toolkit: Essential Research Reagents and Materials
Table 4: Key Reagents and Materials for Validation Experiments
| Item | Function in Validation | Example Applications |
|---|---|---|
| Reference Standards | Certified materials of known purity and identity used to prepare calibration curves and assess accuracy [9]. | Quantification of drug substance; accuracy recovery studies. |
| Challenge Microorganisms | Defined strains of bacteria, yeast, and mold used to demonstrate that a method can detect specific contaminants [6] [11]. | Specificity and limit of detection studies for sterility tests or environmental monitoring methods. |
| Culture Media | Nutrient formulations designed to support microbial growth. Both compendial (FTM, SCDM) and proprietary (e.g., BacT/Alert SA/SN) media are used [11]. | Growth promotion testing; equivalency studies between rapid and traditional methods. |
| Chromatographic Columns and Phases | The heart of separation techniques (HPLC/GC); different selectivities are used to achieve separation of the analyte from interfering components [10]. | Demonstrating specificity and robustness of chromatographic methods. |
| Sample Preparation Kits | Standardized kits (e.g., QuEChERS) for efficient extraction and clean-up of analytes from complex matrices [10]. | Ensuring accurate and precise results by minimizing matrix effects. |
| Certified Reference Materials (CRMs) | Real-world samples with certified values for one or more properties, used as a benchmark for method validation [9]. | Ultimate test for accuracy when available for a specific matrix and analyte. |
For researchers and drug development professionals, navigating the regulatory ecosystem is fundamental to bringing safe and effective products to market. The landscape is built upon a foundation of Good Manufacturing Practices (GMP), which provide the minimum standards for production and control. These principles are enforced in the United States by the Food and Drug Administration (FDA) and are harmonized internationally through the efforts of the International Council for Harmonisation (ICH). A core tenet of modern quality systems, as outlined in ICH Q9, is Quality Risk Management (QRM), which provides a systematic approach to assessing, controlling, and communicating risks across the product lifecycle [15]. Simultaneously, the Process Analytical Technology (PAT) initiative encourages the adoption of innovative, real-time monitoring methods to ensure quality control [16]. Together, these frameworks guide the development, validation, and implementation of new analytical techniques, including rapid microbiological methods (RMMs), which offer significant advantages over traditional compendial methods.
Core Regulatory Bodies and Guidelines
Understanding the distinct yet interconnected roles of key regulatory bodies and their guidelines is the first step toward successful compliance and product development.
Table 1: Key Regulatory Bodies and Their Primary Guidelines
| Regulatory Body | Acronym | Primary Focus & Guidelines | Key Concepts |
|---|---|---|---|
| International Council for Harmonisation | ICH | Harmonizes technical requirements for pharmaceuticals across the US, EU, and Japan. Key guidelines include: |
- ICH Q7: GMP for Active Pharmaceutical Ingredients (APIs) [15].
- ICH Q8 (R2): Pharmaceutical Development and Quality by Design (QbD) [15].
- ICH Q9 (R1): Quality Risk Management (QRM) [15]. | Quality by Design (QbD), Quality Risk Management (QRM), Design Space, Critical Quality Attributes (CQAs) | | U.S. Food and Drug Administration | FDA | Ensures the safety and efficacy of drugs in the US market. Key regulations include:
- 21 CFR Parts 210 & 211: cGMP for finished pharmaceuticals [17].
- 21 CFR Part 820: Quality System Regulation for medical devices [17].
- PAT Initiative: A framework for innovative manufacturing and quality assurance [16]. | Current Good Manufacturing Practice (cGMP), Process Analytical Technology (PAT), Data Integrity | | European Medicines Agency | EMA | Oversees medicinal products for the European Union.
- EudraLex Volume 4: The EU's GMP guidelines, including Annex 1 for sterile products [18]. | EU GMP, Advanced Therapy Medicinal Products (ATMPs) |
The Role of ICH Guidelines
The ICH guidelines provide a harmonized, science-based foundation for pharmaceutical quality. ICH Q7 establishes GMP standards specifically for Active Pharmaceutical Ingredients (APIs), mandating an independent Quality Unit and increasing the stringency of controls as the API manufacturing process progresses from early steps to final purification and packaging [15]. ICH Q8 (R2) introduces the concept of Quality by Design (QbD), a systematic approach to development that begins with predefined objectives and emphasizes product and process understanding and control. This is achieved by defining a Quality Target Product Profile (QTPP), identifying Critical Quality Attributes (CQAs), and establishing a design space and control strategy [15]. ICH Q9 provides the practical tools for implementing a QbD approach by formalizing Quality Risk Management (QRM). It offers a systematic process and tools (e.g., FMEA, HACCP, risk matrices) to identify, assess, and control potential quality risks throughout the product lifecycle [15].
FDA cGMP and the PAT Initiative
The FDA's current Good Manufacturing Practice (cGMP) regulations require that manufacturers use modern, validated systems and technologies. The "c" in cGMP stands for "current," reinforcing the expectation that methods and equipment are updated to reflect the most recent advancements [17]. A key driver for innovation is the Process Analytical Technology (PAT) initiative. The FDA defines PAT as "systems for analysis and control of manufacturing processes based on timely measurements... to assure acceptable end product quality" [16]. This framework explicitly encourages the use of alternative methods, including rapid microbiological methods, that can provide real-time or near-real-time data for better process control, moving beyond traditional end-product testing [16].
Validation of Rapid Methods vs. Reference Techniques
The adoption of any new analytical method, particularly Rapid Microbiological Methods (RMMs), requires a rigorous validation process to demonstrate it is fit-for-purpose and equivalent or superior to the reference compendial method.
Regulatory Framework for Method Validation
Regulatory authorities provide a clear pathway for implementing alternative methods. The FDA's guidance on aseptic processing states that "Other suitable microbiological test methods (e.g., rapid test methods) can be considered... after it is demonstrated that the methods are equivalent or better than traditional methods (e.g., USP)" [16]. Internationally, the ISO 16140 series provides a standardized protocol for the validation of alternative microbiological methods, which involves two key stages [19]:
- Method Validation: This initial stage proves the method is fit-for-purpose, typically through a method comparison study against a reference method and an interlaboratory study.
- Method Verification: This second stage demonstrates that a user laboratory can satisfactorily perform the validated method.
Industry consortia like BioPhorum have further streamlined this process by proposing a structured nine-step framework for the evaluation, validation, and implementation of RMMs to overcome perceived barriers to adoption [20].
Experimental Protocols for Method Comparison
A standard validation protocol for an RMM involves a head-to-head comparison with the compendial method, such as the one described in the United States Pharmacopoeia (USP) Chapter <71> or 21 CFR 610.12 for sterility testing. A typical methodology is outlined below.
Table 2: Example Experimental Protocol for Sterility Test Method Comparison
| Protocol Element | Description | Considerations |
|---|---|---|
| Test Organisms | A panel of microorganisms representing Gram-negative/-positive bacteria, aerobic/anaerobic bacteria, yeast, and fungi (e.g., Staphylococcus aureus, Pseudomonas aeruginosa, Bacillus subtilis, Clostridium sporogenes, Candida albicans, Aspergillus brasiliensis). | Select organisms relevant to the product manufacturing environment and patient use. |
| Inoculum Preparation | Prepare serial dilutions of each organism in a neutral fluid (e.g., Fluid A) or the product matrix to contain approximately 0.1, 1, 10, and 100 colony forming units (CFU) in an inoculum of 10 mL [21]. | Low-level inoculation challenges the method's limit of detection. |
| Test Methods | Inoculate samples into both the compendial method media (Fluid Thioglycollate Medium and Tryptic Soy Broth) and the RMM system (e.g., ATP bioluminescence, CO2 monitoring) [21]. | The compendial method is the benchmark for comparison. |
| Data Analysis | Compare the sensitivity (ability to detect low CFUs) and time to detection for each microorganism across both methods. Statistical analysis (e.g., t-test) should be used to determine significant differences (p < 0.05) [21]. | The RMM must demonstrate non-inferiority or superiority. |
| Matrix Interference | Repeat testing in the presence of the actual product formulation, including preservatives (e.g., 0.01% thimerosal) or adjuvants (e.g., aluminum hydroxide), to assess interference [21]. | Critical for ensuring the method works with the product. |
Comparative Performance Data: RMM vs. Compendial Methods
Experimental data consistently demonstrates the advantages of validated RMMs over traditional growth-based methods.
Table 3: Quantitative Comparison of Rapid Microbiological Methods vs. Compendial Sterility Test
| Performance Metric | Compendial Method (USP <71>) | ATP Bioluminescence (Rapid Milliflex) | CO2 Monitoring (BacT/Alert) |
|---|---|---|---|
| Total Test Duration | 14 days [21] | 5 days [21] | Faster than compendial for most organisms [21] |
| Sensitivity at 0.1 CFU | Baseline | Significantly more sensitive (p < 0.05) [21] | Less sensitive than the compendial membrane filtration method (p < 0.05) [21] |
| Compatibility with 0.01% Thimerosal | Not applicable (baseline) | Compatible (detected all test microorganisms) [21] | Not consistently compatible (did not detect all microorganisms) [21] |
| Key Advantage | Established regulatory acceptance | Speed, sensitivity, and compatibility with challenging matrices [21] | Automation and reduced time-to-result for products without preservatives [21] |
The data shows that the ATP bioluminescence method was not only significantly faster but also more sensitive in detecting low levels of microorganisms compared to the compendial method. Furthermore, its compatibility with products containing preservatives like thimerosal makes it a robust alternative for specific applications [21].
A Risk-Based Approach to Selecting and Implementing Rapid Methods
The Selection Framework
Selecting the right RMM requires a structured evaluation beyond technical performance. The following workflow outlines a risk-based decision process, integrating business needs and regulatory strategy.
Diagram 1: RMM Selection and Implementation Workflow.
When evaluating technologies, consider the following ten attributes to guide decision-making [22]:
- Accuracy for the intended purpose and reduction in human error.
- Speed in time-to-result and productivity.
- Overall cost, including equipment and per-test cost.
- Regulatory acceptability and precedent of use.
- Simplicity of operation and training requirements.
- Vendor reputation and technical support.
- Utility and space requirements.
- Automation and connectivity to LIMS.
- Detection capability for viable but non-culturable organisms.
- Validation pathway and required resources.
The Scientist's Toolkit: Essential Reagents and Materials
The successful execution of a method validation study requires specific reagents and materials. The following table details key solutions used in the featured sterility testing experiment [21].
Table 4: Key Research Reagent Solutions for Sterility Method Validation
| Reagent/Material | Function in the Experiment | Example from Protocol |
|---|---|---|
| Fluid Thioglycollate Medium (FTM) | A growth medium used in the compendial method to support the growth of aerobic and anaerobic bacteria. | Served as one of the two reference compendial media for detecting microbial growth via turbidity [21]. |
| Tryptic Soy Broth (TSB) | A general-purpose, liquid growth medium used in the compendial method to support the growth of a wide range of bacteria and fungi. | Served as the second reference compendial media for the direct inoculation sterility test [21]. |
| Sabouraud Dextrose Agar (SDA) | A solid growth medium selective for fungi, particularly yeasts and molds. | Used as one of the solid culture media in the ATP bioluminescence (RMDS) rapid method system [21]. |
| Schaedler Blood Agar (SBA) | A rich, supplemented medium used for the cultivation of fastidious and anaerobic bacteria. | Utilized in the ATP bioluminescence (RMDS) system and proved effective for detecting all test microorganisms, even in the presence of thimerosal [21]. |
| iAST / iNST Culture Media | Specialized, liquid culture media used in the BacT/Alert system for the automated detection of microbial growth in aerobic and anaerobic conditions, respectively. | The growth of microorganisms produces CO2, which is detected by a sensor in the bottle [21]. |
| Neutralizing Fluid (e.g., Fluid A) | Used to suspend and dilute microorganisms without causing stress or death, ensuring accurate inoculum preparation. | Used to prepare microbial aliquots for inoculation, ensuring the test itself does not inhibit growth [21]. |
Navigating the regulatory landscape for pharmaceutical manufacturing requires a solid understanding of the interconnected roles of FDA regulations, ICH quality guidelines, and GMP principles. The framework provided by ICH Q8 (QbD) and ICH Q9 (QRM) empowers scientists to make science-based decisions, while initiatives like PAT from the FDA encourage the adoption of innovative technologies. As demonstrated by the experimental data, validated Rapid Microbiological Methods offer significant advantages over traditional compendial techniques, including reduced time-to-result, improved sensitivity, and enhanced robustness. By following a structured, risk-based approach to selection, validation, and implementation—in alignment with regulatory guidance from the FDA, ISO, and industry consortia—researchers and drug development professionals can successfully integrate these advanced methods, ultimately enhancing product quality and patient safety.
A Toolkit of Rapid Methods: From Pathogen Detection to AI-Driven Design
The validation of rapid, specific detection methods against reference analytical techniques is a cornerstone of molecular biology research and diagnostics. This guide provides an objective comparison of four foundational nucleic acid-based methods—PCR, qPCR, LAMP, and Microarrays—focusing on their performance characteristics, supported by experimental data. Understanding the sensitivity, specificity, speed, and operational requirements of each technique is essential for researchers and drug development professionals to select the optimal method for their specific application, whether it's for gene expression studies, pathogen detection, or biomarker discovery [23].
The following table provides a systematic comparison of the key performance metrics and characteristics of the four nucleic acid detection methods.
Table 1: Performance Comparison of Nucleic Acid-Based Detection Methods
| Feature | Conventional PCR | Quantitative PCR (qPCR) | Loop-Mediated Isothermal Amplification (LAMP) | Microarrays |
|---|---|---|---|---|
| Key Principle | End-point amplification via thermal cycling [24] | Real-time fluorescence monitoring during thermal cycling [24] | Isothermal amplification with 4-6 primers [25] | Hybridization of labeled nucleic acids to immobilized probes [23] |
| Detection Method | Gel electrophoresis (post-amplification) [24] | Fluorescent dyes/probes (real-time) [24] | Turbidity, fluorescence, or visual color change [25] | Fluorescence scanning [23] |
| Typical Sensitivity | ~100 pg (in a given study) [25] | 100 fg (in a given study) [25] | ~1 pg (in a given study) [25] | Lower than qPCR for miRNA [26] |
| Relative Sensitivity | 1x (as baseline) | 1000x more sensitive than PCR [24] | 10x more sensitive than conventional PCR [25] | Varies by platform and target |
| Assay Speed | Several hours (includes gel analysis) [24] | Faster than PCR (no post-processing) [24] | <60 minutes [25] | Long hybridization and analysis times [23] |
| Throughput | Low to medium | High (384- or 1536-well plates) [24] | Medium | Very high (whole genome) [23] |
| Quantification | No (semi-quantitative) | Yes (absolute or relative) [24] | Yes | Yes (relative) [23] |
| Ease of Use | Requires post-processing | Complex data analysis [24] | Simple, minimal equipment [25] | Complex data analysis and bioinformatics [23] |
| Cost | Low | High (equipment and reagents) [24] | Low | High |
Experimental Data and Performance Validation
Sensitivity Analysis in Pathogen Detection
A direct comparison of four methods for detecting the fungal pathogen Alternaria solani demonstrated clear sensitivity differences. The study, based on the histidine kinase gene (HK1), highlights the importance of method selection based on detection needs [25]:
- qPCR was the most sensitive, detecting down to 100 fg of genomic DNA.
- Nested PCR was 10-fold less sensitive than qPCR but 1000-fold more sensitive than conventional PCR, detecting down to 1 pg.
- LAMP showed intermediate sensitivity, 10-fold higher than conventional PCR but 10-fold lower than nested PCR, detecting down to 10 pg.
- Conventional PCR was the least sensitive, requiring at least 100 pg of DNA for detection [25].
This data underscores qPCR as the reference method for maximum sensitivity, while LAMP offers a compelling balance of speed and sensitivity for field-deployable diagnostics.
Reproducibility and False Positive Rates
A study comparing miRNA profiling techniques revealed significant operational differences between qPCR arrays and microarrays:
- qPCR arrays demonstrated high reproducibility with minimal variation between different reverse transcription reactions and assays performed on different days [26].
- Microarrays exhibited a higher false-positive rate for differential miRNA expression and showed greater variation between replicates, especially for low-abundance targets [26].
- The correlation between the two platforms was low (r = -0.443), indicating considerable variability between the assay technologies [26].
This evidence positions qPCR as a more reliable method for validation purposes, particularly for low-expression targets.
Detailed Experimental Protocols
Protocol: qPCR Validation of Microarray Data
Validating microarray results with qPCR is a standard practice. However, when RNA is limited, using the amplified amino allyl labeled RNA (AA-aRNA) leftover from the microarray process is an efficient alternative. The following workflow diagram outlines an optimized protocol to overcome the inhibition of qPCR by amplification and labeling compounds [27] [28].
Workflow Title: Optimized RT Protocol for Microarray Validation via qPCR
Key Steps and Rationale: [27] [28]
- Input Material: Begin with amplified amino allyl labeled RNA (AA-aRNA). Using AA-aRNA is particularly valuable when the original RNA quantity is limited.
- Denaturation: A denaturation step is added to unfold secondary structures in the AA-aRNA.
- Primer Annealing: A 2-minute incubation at room temperature is introduced to improve the annealing of random primers to the template.
- Transcription Initiation: This step enhances the efficiency of the reverse transcription reaction itself.
- Reverse Transcription: performed using SuperScript II.
- RNase H Treatment: This post-RT step degrades any remaining RNA, reducing potential interference in the subsequent qPCR. Outcome: This optimized protocol was shown to provide a significant gain in Cq values (2.7-3.4 cycles on average) and increased qPCR efficiency, allowing for the detection of low-abundance genes that were previously undetectable with the standard protocol [27] [28].
Protocol: LAMP Assay for Rapid Pathogen Detection
The LAMP protocol offers a rapid, isothermal alternative for specific detection, suitable for resource-limited settings. The following workflow details the steps for detecting Alternaria solani [25].
Workflow Title: LAMP Assay Workflow for Direct Detection
Key Steps and Rationale: [25]
- Template Preparation: DNA can be extracted using simple methods, as LAMP is notably tolerant to inhibitors present in biological samples, sometimes even allowing for the use of diluted pure culture without extensive DNA purification.
- Reaction Setup: The reaction mix includes strand-displacing Bst DNA polymerase and a set of four to six primers (F3, B3, FIP, BIP) specifically designed to recognize distinct regions of the target gene (e.g., the HK1 gene for A. solani). This multi-primer system is the source of the technique's high specificity.
- Amplification: The reaction is incubated at a constant temperature of 63°C for 60 minutes. The isothermal nature eliminates the need for a thermal cycler.
- Detection: Amplification can be detected by several methods:
- Gel electrophoresis for traditional analysis.
- Real-time turbidity measurement due to the precipitation of magnesium pyrophosphate.
- Visual inspection after adding fluorescent intercalating dyes (e.g., SYBR Green), enabling naked-eye detection.
Essential Research Reagent Solutions
The following table catalogues key reagents and their functions that are critical for successfully implementing the discussed nucleic acid detection methods.
Table 2: Key Reagents and Their Functions in Nucleic Acid Detection
| Reagent / Solution | Function | Key Considerations |
|---|---|---|
| Bst DNA Polymerase | Enzyme for LAMP amplification; has strand-displacement activity [25]. | Isothermal; does not require a thermal cycler. |
| Taq DNA Polymerase | Thermostable enzyme for PCR, qPCR amplification [24]. | Requires thermal cycling. |
| SYBR Green / BRYT Dye | Fluorescent dsDNA-binding dye for qPCR and LAMP detection [25] [29]. | Binds non-specifically to dsDNA; cost-effective for qPCR. |
| TaqMan Probes | Sequence-specific fluorescent probes for qPCR [29]. | Higher specificity than DNA-binding dyes. |
| Amino Allyl UTP (AA-UTP) | Modified nucleotide for labeling RNA in microarray target preparation [27]. | Serves as an arm for fluorescent dye coupling. |
| Megaplex RT/Preamplification Primers | Primer pools for reverse transcription and pre-amplification in large-scale qPCR arrays [26]. | Enables profiling of hundreds of targets from minimal RNA. |
| SuperScript II Reverse Transcriptase | Enzyme for synthesizing cDNA from RNA templates [27]. | Used in qPCR and microarray sample prep. |
| Master Mix | Optimized, ready-to-use mixture of enzymes, dNTPs, and buffers for qPCR [29]. | Ensures reproducibility and efficiency; required for high-sensitivity qPCR. |
The choice among PCR, qPCR, LAMP, and microarrays is dictated by the specific requirements of the experiment. qPCR stands out as the sensitive, quantitative reference method for validation and precise quantification. LAMP is a superior choice for rapid, field-deployable diagnostics due to its speed, simplicity, and robustness. Microarrays provide an excellent discovery tool for genome-wide screening, though their results often require confirmation by a more sensitive technique like qPCR. Finally, conventional PCR remains a viable, low-cost option for simple, non-quantitative detection. By understanding the performance characteristics and operational workflows of each method, researchers can make informed decisions to ensure the accuracy and reliability of their nucleic acid detection experiments.
Biosensors are analytical devices that combine a biological recognition element with a physicochemical detector to analyze a wide range of substances, providing real-time data with high sensitivity and specificity [30]. The fundamental principle of these devices involves the molecular recognition between biological elements (such as enzymes, antibodies, or nucleic acids) and target analytes, followed by transformation into measurable physical or chemical signals through various transduction mechanisms [31]. For researchers and drug development professionals, validating these rapid analytical methods against established reference techniques is paramount to ensuring data reliability, regulatory compliance, and successful translation from research to clinical applications.
The validation of analytical methods, including biosensors, follows established guidelines such as ICH Q2 to demonstrate that a method is suitable for its intended purpose [32]. Key validation parameters include specificity, accuracy, precision, linearity, and range, which collectively ensure that results are consistent, reproducible, and reliable [32]. Within this framework, optical, electrochemical, and mass-based biosensors each offer distinct advantages and limitations for specific applications in pharmaceutical development, clinical diagnostics, and environmental monitoring. This guide provides a comprehensive comparison of these technologies, supported by experimental data and detailed methodologies to inform selection and implementation decisions.
Technology Comparison and Performance Data
Fundamental Operating Principles
Optical Biosensors: These devices detect changes in light properties (intensity, wavelength, or phase) resulting from biological interactions [30]. Major types include surface plasmon resonance (SPR), fluorescence, and interferometry [30]. For instance, fluorescent biosensors often utilize Förster resonance energy transfer (FRET) between donor and acceptor molecules, where energy transfer efficiency changes in response to analyte binding [33].
Electrochemical Biosensors: These operate by detecting electrical signal changes (voltage, current, or impedance) during biological reactions [30]. They are categorized into amperometric (measuring current), potentiometric (measuring potential), and impedimetric (measuring impedance) sensors [30]. Their operation relies on the production or consumption of ions or electrons during biological recognition events.
Mass-Based Biosensors: These systems, including piezoelectric and quartz crystal microbalance (QCM) devices, detect mass changes occurring from the binding of target analytes to the sensor surface [31]. The fundamental principle involves measuring frequency changes of a crystal oscillator when mass is added or removed from its surface.
Comparative Performance Analysis
Table 1: Comprehensive comparison of biosensor technologies
| Performance Parameter | Optical Biosensors | Electrochemical Biosensors | Mass-Based Biosensors |
|---|---|---|---|
| Sensitivity | Superior sensitivity; FRET biosensors achieve near-quantitative (>95%) efficiency [33] | High sensitivity for specific analytes (e.g., glucose) [30] | Generally high for mass-changing interactions [31] |
| Detection Limit | Capable of detecting minute quantities; femtogram-per-mL range for protein detection [34] | May require specific conditions to maintain accuracy in complex samples [30] | Suitable for detecting larger biomolecules and whole cells [31] |
| Dynamic Range | Unprecedented dynamic ranges with engineered FRET pairs [33] | Moderate dynamic range, often optimized for specific concentration windows [30] | Limited by mass loading capacity of sensor surface [31] |
| Analysis Time | Real-time monitoring capabilities [30] | Rapid results, suitable for point-of-care testing [30] | Real-time monitoring of binding events [31] |
| Multiplexing Capability | High; multicolor FRET sensors enable simultaneous monitoring of different analytes [33] | Moderate; requires multiple electrode arrays [30] | Limited; typically single-analyte detection [31] |
| Cost & Accessibility | Higher cost due to sophisticated equipment [30] | More affordable, accessible for mass-market applications [30] | Moderate cost, specialized equipment required [31] |
| Portability | Generally less portable, complex setups [30] | Excellent portability; compact, user-friendly designs [30] | Variable; benchtop systems common [31] |
Table 2: Application-focused comparison across industry sectors
| Application Sector | Optical Biosensors | Electrochemical Biosensors | Mass-Based Biosensors |
|---|---|---|---|
| Pharmaceutical R&D | High-precision target engagement studies, intracellular metabolite monitoring [33] | Drug screening, toxicity assessment [30] | Ligand-binding studies, affinity characterization [31] |
| Clinical Diagnostics | Protein biomarker detection, high-sensitivity immunoassays [34] | Glucose monitoring, point-of-care infectious disease tests [30] | Pathogen detection (e.g., Bacillus anthracis) [31] |
| Environmental Monitoring | Potential for multiplexed contaminant detection [33] | Heavy metal detection, water quality monitoring [30] | Bacterial spore detection in environmental samples [31] |
| Food Safety | Limited due to complexity and cost [30] | Pesticide residue detection, spoilage indicators [30] | Pathogen screening (e.g., whole-cell detection) [31] |
Validation Against Reference Methods
When validating biosensor technologies against reference analytical methods, researchers must establish correlation across key parameters. For optical biosensors, validation often involves comparison with enzyme-linked immunosorbent assay (ELISA) or mass spectrometry for analyte quantification [31] [32]. Electrochemical biosensors are frequently validated against chromatographic methods or standardized clinical chemistry analyzers [30] [32]. Mass-based biosensors typically require correlation with culture-based microbiological methods or other reference techniques for microbial detection [31].
The validation process must demonstrate that the rapid biosensor method provides equivalent or superior performance to the reference method for the intended application, with particular attention to specificity, accuracy, and precision under actual use conditions [32]. For example, a study comparing a microwave resonator biosensor for cell cytotoxicity against the established CCK-8 colorimetric method showed strong linear correlation, validating its use for high-throughput drug screening [34].
Experimental Protocols and Methodologies
Development of FRET-Based Optical Biosensors
Protocol Objective: Create highly sensitive FRET biosensors with large dynamic ranges for intracellular metabolite monitoring [33].
Key Reagents and Materials:
- Plasmid vectors encoding fluorescent proteins (e.g., eGFP, mCerulean3, Venus, mScarlet)
- HaloTag7 (HT7) construct
- Silicon rhodamine (SiR) or tetramethylrhodamine (TMR) fluorophore substrates
- Cell culture reagents (appropriate cell lines, media, transfection reagents)
- Microplate reader or fluorescence microscopy setup
Methodology:
- FRET Pair Engineering: Fuse selected fluorescent protein (FP) to N-terminus of HT7 using molecular cloning techniques. The construct eGFP-HT7 (termed ChemoG1) serves as starting point [33].
- Interface Optimization: Introduce stabilizing mutations at FP-HT7 interface (e.g., eGFP: A206K, T225R; HT7: E143R, E147R, L271E) to enhance FRET efficiency through stepwise mutagenesis [33].
- Fluorophore Labeling: Incubate expressed constructs with cell-permeable rhodamine-based fluorophores (e.g., SiR, JF525, JF669) to label HaloTag moiety [33].
- FRET Efficiency Quantification: Measure fluorescence emission spectra following donor excitation. Calculate FRET efficiency using formula:
E = 1 - (FDA/FD), where FDA is donor emission in presence of acceptor, and FD is donor emission alone [33]. - Sensor Validation in Cellular Systems: Express optimized biosensors in relevant cell lines (e.g., U-2 OS cells). Confirm subcellular localization and dynamic range following stimulation (e.g., genotoxic stress for NAD+ sensors) [33].
Validation Parameters:
- FRET efficiency (near-quantitative ≥94% for optimized constructs)
- Dynamic range (fold-change in emission ratio between analyte-bound and unbound states)
- pH and salt stability (minimal effect on FRET efficiency within physiological ranges)
- Spectral characteristics across FP and acceptor combinations [33]
Electrochemical Immunosensor for Pathogen Detection
Protocol Objective: Develop electrochemical immunosensor for detection of Bacillus anthracis spores as model pathogen [31].
Key Reagents and Materials:
- Capture antibodies specific to target pathogen surface antigens
- Electrode systems (gold, carbon, or indium tin oxide electrodes)
- Redox mediators (e.g., ferricyanide, ferrocene derivatives)
- Blocking agents (bovine serum albumin, casein)
- Potentiostat/galvanostat for electrochemical measurements
Methodology:
- Electrode Modification: Clean and functionalize electrode surface to enable antibody immobilization through covalent coupling or physical adsorption [31] [30].
- Antibody Immobilization: Incubate functionalized electrode with capture antibody solution. Optimize concentration and incubation time to maximize surface coverage while maintaining activity [31].
- Blocking: Treat modified electrode with blocking solution to minimize non-specific binding on sensor surface [31].
- Sample Incubation: Expose functionalized electrode to sample containing target analyte for predetermined time [31].
- Electrochemical Measurement: Perform electrochemical measurement (amperometric, potentiometric, or impedimetric) in presence of redox mediator:
- Amperometric: Apply fixed potential and measure current change
- Impedimetric: Apply AC potential across frequency range and measure impedance spectra [30]
- Signal Correlation: Relate electrical signal to analyte concentration through calibration curve [31].
Validation Parameters:
- Limit of detection (LOD) and quantification (LOQ) in relevant matrices
- Specificity against related species or common interferents
- Accuracy (percentage recovery of spiked samples)
- Precision (intra-assay and inter-assay variability)
- Correlation with reference methods (e.g., culture, PCR) [31] [32]
Mass-Based Immunosensor Implementation
Protocol Objective: Implement piezoelectric mass-based immunosensor for detection of bacterial pathogens [31].
Key Reagents and Materials:
- Quartz crystal microbalance (QCM) with flow injection system
- Antibodies specific to target analytes
- Reference crystals for background subtraction
- Buffer solutions for stable biorecognition element immobilization
Methodology:
- Crystal Functionalization: Modify gold electrode surface of quartz crystal to enable antibody immobilization using self-assembled monolayers or polymer coatings [31].
- Antibody Immobilization: Incubate functionalized crystal with antibody solution under optimized conditions [31].
- Baseline Establishment: Flow buffer solution across crystal surface until stable frequency baseline is achieved [31].
- Sample Introduction: Introduce sample containing target analyte through flow system [31].
- Frequency Monitoring: Continuously monitor resonance frequency shift during association and dissociation phases [31].
- Data Analysis: Calculate mass change using Sauerbrey equation:
Δm = -C·Δf/n, where C is sensitivity constant, Δf is frequency change, and n is overtone number [31].
Validation Parameters:
- Binding kinetics (association/dissociation rates)
- Mass detection limit
- Reusability/regeneration capability
- Specificity in complex samples
- Correlation with reference microbiological methods [31]
Signaling Pathways and Experimental Workflows
Biosensor Development Pathway
FRET Biosensor Mechanism
Biosensor Validation Workflow
Essential Research Reagents and Materials
Table 3: Key research reagents for biosensor development and validation
| Reagent/Material | Function | Example Applications |
|---|---|---|
| Fluorescent Proteins (eGFP, mCerulean3, Venus) | FRET donors in optical biosensors | Intracellular metabolite monitoring [33] |
| HaloTag7 with Rhodamine Substrates | Chemogenetic FRET acceptor system | Engineered biosensors with large dynamic ranges [33] |
| Capture Antibodies | Biorecognition elements for specific analyte binding | Pathogen detection immunosensors [31] |
| Functionalized Electrodes (Gold, Carbon) | Transducer surfaces for electrochemical detection | Amperometric and impedimetric biosensors [30] |
| Quartz Crystal Microbalances | Mass-sensitive transducer platforms | Piezoelectric immunosensors [31] |
| Redox Mediators (Ferricyanide) | Electron transfer facilitators in electrochemical sensors | Amplifying electrochemical signals [30] |
| Blocking Agents (BSA, Casein) | Minimize non-specific binding | Improving assay specificity across platforms [31] |
| Reference Analytical Standards | Method validation and calibration | Establishing accuracy against reference methods [32] |
The comparative analysis of optical, electrochemical, and mass-based biosensor technologies reveals distinctive performance profiles that dictate their suitability for specific applications in pharmaceutical research and drug development. Optical biosensors, particularly advanced FRET-based systems, offer exceptional sensitivity and dynamic range for intracellular monitoring and high-precision applications, albeit with higher complexity and cost [33]. Electrochemical biosensors provide an optimal balance of performance, cost-effectiveness, and portability, making them ideal for point-of-care diagnostics and high-throughput screening [30]. Mass-based biosensors deliver valuable capabilities for direct detection of larger biomolecules and pathogens, though with more limited multiplexing capabilities [31].
From a method validation perspective, the selection of appropriate biosensor technology must be guided by intended use requirements and alignment with validation parameters outlined in regulatory guidelines [32]. As the field advances, integration with complementary metal-oxide-semiconductor (CMOS) technology, microfluidics, and artificial intelligence is poised to enhance the performance, scalability, and accessibility of biosensor platforms [34]. Future developments will likely focus on overcoming existing limitations in multiplexing, environmental interference, and complexity while maintaining the rigorous validation standards required for adoption in regulated pharmaceutical and clinical environments.
Serological assays, which detect the presence of antibodies or antigens in biological samples, serve as fundamental tools in clinical diagnostics, epidemiological studies, and therapeutic development. Among these techniques, Enzyme-Linked Immunosorbent Assay (ELISA) and Lateral Flow Immunoassay (LFA) represent two widely utilized platforms with distinct operational characteristics and application domains. Within the context of method validation research, comparing established reference techniques like ELISA with rapid alternatives such as LFA is crucial for determining their appropriate implementation in various settings. ELISA has long been considered a reference analytical technique in clinical microbiology and serological testing due to its robustness, sensitivity, and quantitative capabilities [35] [36]. In contrast, lateral flow immunoassays have emerged as rapid, point-of-care alternatives that sacrifice some analytical performance for speed and operational simplicity [35].
The COVID-19 pandemic has provided a recent real-world context for comparing these methodologies, with numerous studies evaluating their respective performances in detecting SARS-CoV-2 antibodies. This comparison guide objectively examines the technical specifications, performance characteristics, and experimental validation data for ELISA and LFA, providing researchers and drug development professionals with evidence-based insights for selecting appropriate assay platforms based on their specific requirements. The framework for this comparison centers on validation parameters established for immunoassays, including sensitivity, specificity, precision, and robustness [37].
Fundamental Principles and Methodologies
Enzyme-Linked Immunosorbent Assay (ELISA)
ELISA is a plate-based technique that utilizes the specific binding between antigen and antibody, with detection enabled by an enzyme-linked conjugate that produces a measurable signal, typically colorimetric, fluorescent, or chemiluminescent [35] [36]. The fundamental principle involves immobilizing either an antigen or antibody onto a solid surface (typically a polystyrene microtiter plate) and then detecting the target analyte through a series of binding and washing steps. The most common ELISA formats include direct, indirect, and sandwich assays, each with specific advantages for different applications.
In the direct ELISA format, antigens are immobilized in the well of a microtiter plate, and an enzyme-conjugated antibody specific for the antigen is added. After washing to remove unbound antibodies, a colorless substrate (chromogen) is added, and the presence of the enzyme converts the substrate into a colored end product [35]. The indirect ELISA begins with attaching known antigen to the bottom of the microtiter plate wells. After blocking, patient serum is added; if antibodies are present, they will bind the antigen. After washing, a secondary antibody with conjugated enzyme is added, directed against the primary antibody [35]. The sandwich ELISA uses a capture antibody coated onto the plate to detect specific antigen present in a solution. The primary antibody captures the antigen, and after washing, a secondary antibody conjugated to an enzyme is added [35].
The optimization of ELISA requires careful attention to multiple parameters, including antigen coating concentration, blocking conditions, sample preparation methods, and detection system optimization [36]. Coating wells with antigen or capturing antibodies typically uses protein solutions in PBS or carbonate buffer applied to microtiter plates with modified surfaces that have high affinity for molecules with polar or hydrophilic groups [36]. Blocking free binding sites is critical to prevent nonspecific binding and improve the signal-to-noise ratio and specificity, with various blocking buffers available including BSA, nonfat-dried milk, casein, or whole serum [36].
Lateral Flow Immunoassays (LFA)
Lateral flow immunoassays, commonly known as lateral flow tests or strip tests, are simple devices designed to detect the presence or absence of a target analyte in a liquid sample without the need for specialized equipment [35]. These assays operate on the principle of immunochromatography, where the sample migrates along a strip of porous material (typically nitrocellulose) through capillary action, encountering various zones containing biological reagents that produce a visual signal when the target analyte is present.
The basic components of a lateral flow strip include a sample pad, conjugate pad, nitrocellulose membrane, and absorbent pad. The sample pad acts as a filter to remove particles and ensure smooth flow. The conjugate pad contains labeled antibodies (typically with gold nanoparticles, latex beads, or fluorescent tags) that recognize the target analyte. The nitrocellulose membrane contains test and control lines where capture molecules are immobilized [35]. When a fluid sample is applied to the absorbent pad, it flows by capillary action and moves through a stripe of beads with antibodies attached to their surfaces. The fluid hydrates the reagents, which are present in a dried state in the stripe [35].
In the detection mechanism, antibody-coated beads made of latex or tiny gold particles bind antigens in the test fluid. The antibody-antigen complexes then flow over a second stripe that has immobilized antibody against the antigen; this stripe retains the beads that have bound antigen [35]. A third control stripe binds any beads, serving as an internal control to validate the test procedure. A red color (from gold particles) or blue (from latex beads) developing at the test line indicates a positive test, while color development only at the control line indicates a negative result [35].
Like ELISA techniques, lateral flow tests take advantage of antibody sandwiches, providing sensitivity and specificity, though they are generally not as quantitative as ELISA [35]. The primary advantages of LFA include speed, simplicity, low cost, and independence from special equipment, making them suitable for point-of-care use or in-home testing [35].
Comparative Workflow Visualization
The following diagram illustrates the fundamental workflows and key differences between ELISA and LFA procedures:
Performance Comparison: Experimental Data
Diagnostic Performance in SARS-CoV-2 Detection
Multiple comparative studies conducted during the COVID-19 pandemic have provided robust experimental data on the performance characteristics of ELISA and LFA in detecting SARS-CoV-2 antibodies. The table below summarizes key findings from these studies:
Table 1: Comparative Performance of ELISA and LFA in SARS-CoV-2 Antibody Detection
| Study Reference | Assay Type | Specific Test | Sensitivity (%) | Specificity (%) | Time Post-Symptom Onset | Sample Size |
|---|---|---|---|---|---|---|
| Ong et al. [38] | LFA | Orient Gene Biotech IgG/IgM | 43 (34-53) | 98 (95-100) | All patients | 99 positive, 129 negative |
| Ong et al. [38] | LFA | Orient Gene Biotech IgG/IgM | 60 (46-73) | - | ≥7 days | 52 positive |
| Ong et al. [38] | ELISA | Wantai SARS-CoV-2 Ab | 62 (52-72) | 98 (95-100) | All patients | 95 positive, 128 negative |
| Ong et al. [38] | ELISA | Wantai SARS-CoV-2 Ab | 79 (68-91) | - | ≥7 days | 48 positive |
| Frontiers Study [39] | ELISA | EUROIMMUN IgG | 71.0 | 100 | >10 days | 40 positive, 10 negative |
| Frontiers Study [39] | LFA | T-Tek IgG/IgM | 35.5 | 100 | >10 days | 40 positive, 10 negative |
| Egyptian Study [40] | In-house ELISA | Anti-nucleocapsid IgG/IgM | 86.0 | 92.0 | Not specified | Not specified |
| Egyptian Study [40] | In-house LFA | Anti-nucleocapsid IgG/IgM | 96.5 | 93.75 | Not specified | Not specified |
The data reveals considerable variability in performance between different commercial assays and between studies. Overall, ELISA demonstrates higher sensitivity compared to LFA in most direct comparisons, particularly in early infection stages. The sensitivity of both techniques improves with longer duration since symptom onset, as antibody levels increase over time [38]. The specificity remains consistently high for both platforms when properly optimized.
The heterogeneity in LFA performance is particularly notable. One study evaluating six different LFAs found sensitivity characteristics ranging from 10% (95% CI 0%-23%) to 55% (95% CI 33%-77%) on the same patient samples [38]. This variability highlights the importance of rigorous validation before implementing rapid tests in clinical or research settings.
Methodological Comparison and Operational Characteristics
Beyond diagnostic performance, ELISA and LFA differ significantly in their operational parameters, infrastructure requirements, and implementation considerations:
Table 2: Operational Characteristics of ELISA versus Lateral Flow Assays
| Parameter | ELISA | Lateral Flow Immunoassay |
|---|---|---|
| Time to Result | 2-5 hours [35] | 15-30 minutes [35] |
| Equipment Requirements | Plate washer, plate reader, incubator [35] | None required [35] |
| Sample Throughput | High (96-well format) | Low to moderate (individual tests) |
| Quantitative Capability | Fully quantitative [35] | Qualitative or semi-quantitative [35] |
| Personnel Skill Requirements | Technical expertise needed | Minimal training required |
| Cost per Test | Moderate to high | Low |
| Storage Requirements | Typically refrigerated | Often stable at room temperature |
| Quality Control | Internal and external controls possible | Built-in control line |
| Applications | Reference testing, batch analysis, research | Point-of-care, rapid screening, field use |
The operational differences make these technologies complementary rather than directly competitive. ELISA serves as an ideal platform for high-throughput laboratory settings where quantitative results, high sensitivity, and batch processing are prioritized. In contrast, LFA provides a practical solution for rapid screening, point-of-care testing, and resource-limited settings where speed, simplicity, and low cost are paramount.
Validation Frameworks and Experimental Protocols
Method Validation Parameters
For researchers implementing these assays, particularly for regulatory purposes or method transfer, understanding validation requirements is essential. The following validation parameters should be assessed based on the intended use of the method:
Table 3: Key Validation Parameters for Immunoassays
| Validation Parameter | Definition | Application to ELISA | Application to LFA |
|---|---|---|---|
| Precision | Closeness of agreement between independent test results [37] | Assessed within-run, between-run, and between-laboratory | Typically assessed between different lots and readers |
| Trueness | Closeness of agreement between average value and accepted reference value [37] | Comparison with reference method or standard | Comparison with reference method (often ELISA) |
| Robustness | Ability to remain unaffected by small variations in method parameters [37] | Testing variations in incubation time, temperature, reagent lots | Testing variations in sample volume, environmental conditions |
| Limits of Quantification | Highest and lowest concentrations measurable with acceptable precision and accuracy [37] | Established through dilution series | Typically not applicable (qualitative tests) |
| Selectivity | Ability to measure and differentiate analytes in presence of potential interferents [37] | Testing cross-reactivity with related antigens | Testing cross-reactivity and sample matrix effects |
| Sample Stability | Chemical stability of analyte under specific conditions [37] | Evaluation of storage conditions and freeze-thaw cycles | Evaluation of storage conditions, particularly test strips |
For laboratory-developed tests or in-house assays, full validation is required, while for commercial assays, partial validation may suffice to verify performance claims under local conditions [37]. The extent of validation should be determined based on the intended application, with diagnostic applications requiring more rigorous validation than research use.
Experimental Protocol for Comparative Validation
Researchers conducting comparative assessments of ELISA and LFA should implement standardized protocols to ensure meaningful results:
Sample Selection and Preparation:
- Include well-characterized positive and negative samples, preferably confirmed by reference methods
- Ensure appropriate sample size for statistical power (typically ≥50 positive and ≥50 negative samples)
- Store samples appropriately (-80°C for long-term storage, avoid repeated freeze-thaw cycles)
- Include samples with varying analyte concentrations and from different demographic groups
Testing Procedure:
- Perform ELISA and LFA testing according to manufacturer instructions
- Ensure technicians are blinded to sample status and other test results
- Include appropriate controls in each run (positive, negative, calibrators if quantitative)
- For quantitative assays, establish standard curves using reference materials
Data Analysis:
- Calculate sensitivity, specificity, positive predictive value, and negative predictive value
- Determine 95% confidence intervals for performance characteristics
- Assess agreement between methods using Cohen's kappa statistic
- For quantitative assays, perform correlation analysis and Bland-Altman plots
Robustness Testing:
- For ELISA: Evaluate impact of variations in incubation time (±15%), temperature (±2°C), and reagent volumes (±10%)
- For LFA: Assess impact of sample volume variations, environmental temperature, and interpretation timing
- Test potential interferents (hemolyzed, lipemic, icteric samples) if clinically relevant
The validation should be thoroughly documented, including all experimental procedures, raw data, statistical analyses, and conclusions about acceptable performance criteria [37].
Research Reagent Solutions and Essential Materials
The following table outlines key reagents and materials required for implementing ELISA and lateral flow immunoassays in research settings:
Table 4: Essential Research Reagents for Immunological Assays
| Reagent/Material | Function | ELISA Application | LFA Application |
|---|---|---|---|
| Microtiter Plates | Solid phase for immobilization | Coated with antigen or antibody [36] | Not applicable |
| Nitrocellulose Membrane | Matrix for capillary flow | Not applicable | Main substrate for test and control lines [40] |
| Capture Antibodies | Target-specific recognition | Coated onto plate surface [36] | Immobilized at test line [40] |
| Detection Antibodies | Signal generation | Enzyme-conjugated for detection [35] | Labeled with gold nanoparticles or other tags [40] |
| Blocking Buffers | Prevent nonspecific binding | BSA, nonfat-dried milk, or casein solutions [36] | Protein-based buffers for membrane treatment [40] |
| Enzyme Substrates | Signal generation | Chromogenic, chemiluminescent, or fluorescent substrates [35] | Not typically used |
| Conjugate Pads | Release labeled reagents | Not applicable | Contain dried detection antibodies [35] |
| Sample Diluents | Matrix for sample preparation | PBS with BSA and non-ionic detergents [36] | Buffers optimized for flow characteristics |
| Reference Standards | Calibration and quantification | Certified reference materials for standard curves | Qualitative controls for verification |
The selection and quality of these reagents significantly impact assay performance. For ELISA, critical optimization steps include determining the optimal concentration for antigen coating through checkerboard titration and selecting appropriate blocking buffers to minimize background signal while maintaining specific binding [36]. For LFA, key development parameters include optimizing nanoparticle size and conjugation efficiency, membrane treatment, and flow characteristics to ensure consistent migration and specific binding at test and control lines [40].
ELISA and lateral flow immunoassays represent complementary technologies in the researcher's diagnostic toolkit, each with distinct advantages and limitations. ELISA serves as a robust, quantitative reference method with superior sensitivity and standardization capabilities, making it ideal for laboratory-based testing, batch analysis, and situations requiring precise quantification. Lateral flow immunoassays provide rapid, cost-effective, equipment-free solutions suitable for point-of-care testing, rapid screening, and resource-limited settings, albeit with generally lower sensitivity and qualitative outputs.
The decision to implement either platform should be guided by the specific research requirements, including needed turnaround time, required sensitivity and specificity, available infrastructure, and intended application. For critical diagnostic decisions or method validation studies, the combination of both techniques may be optimal—using LFA for initial screening followed by confirmatory testing with ELISA. As both technologies continue to evolve, ongoing comparative validation remains essential to guide appropriate implementation across diverse research and clinical contexts.
The integration of Artificial Intelligence (AI) and Machine Learning (ML) into scientific research has catalyzed a paradigm shift in in silico prediction and design, particularly within drug development. AI refers to machine-based systems that can, for a given set of objectives, make predictions or decisions influencing real environments [41]. A subset of AI, machine learning (ML), utilizes algorithms trained on data to improve performance at a task, with deep learning (DL) representing a more complex subfield that uses artificial neural networks (ANNs) to mimic human brain function [42]. These technologies are revolutionizing the pharmaceutical industry by accelerating processes ranging from initial drug discovery to clinical trials, thereby reducing human workload and achieving targets in a shorter period [42]. The U.S. Food and Drug Administration (FDA) notes a significant increase in drug application submissions using AI components, reflecting their growing importance in producing information to support regulatory decision-making regarding drug safety, effectiveness, and quality [41].
This guide objectively compares the performance of emerging AI/ML tools against traditional analytical techniques, framing the analysis within the broader thesis of validating rapid methodologies. The core advantage of these in silico tools lies in their ability to analyze enormous volumes of data with enhanced automation, handling the vast chemical space of over 10^60 molecules that traditional methods struggle to navigate efficiently [42]. For researchers and drug development professionals, understanding the capabilities, validation benchmarks, and appropriate applications of these tools is critical for leveraging their full potential while acknowledging their current limitations.
Comparative Analysis of AI/ML Tools vs. Traditional Methods
The following tables provide a structured comparison of AI/ML tools against traditional methods across key domains of pharmaceutical research, focusing on performance metrics, speed, and primary use cases.
Table 1: Performance Comparison in Drug Discovery and Safety
| Domain | AI/ML Tool/Method | Traditional Method | Key Performance Metric | AI/ML Performance | Traditional Method Performance | Primary Use Case |
|---|---|---|---|---|---|---|
| Drug Screening | Deep Neural Networks (DNNs) [42] | Conventional QSAR Models [42] | Predictivity for ADMET datasets [42] | Significant improvement over traditional ML [42] | Lower predictivity for complex properties [42] | Virtual screening for synthesis feasibility, activity, toxicity [42] |
| Cardiac Safety | Mathematical Action Potential (AP) Models [43] | Ex vivo human tissue recordings [43] | Prediction of Action Potential Duration (APD) change [43] | Mixed; models matched data for selective IKr inhibitors OR combined IKr/ICaL inhibition, but not all scenarios [43] | Experimental baseline (gold standard) [43] | Translational clinical cardiac safety prediction [43] |
| Somatic Mutation Calling | In silico pipeline with Bamsurgeon [44] | Validation on physical cell lines [44] | Reproducibility/Recall at low purity [44] | New filter showed much better recall in low-purity samples [44] | Does not cover all accuracy/sensitivity requests; events not evenly distributed [44] | Whole Exome Sequencing (WES) pipeline validation [44] |
| Reference Gene Validation | iRGvalid (in silico method) [45] | Wet lab validation tests [45] | Pearson correlation coefficient (Rt) for stability [45] | High Rt values (e.g., 0.911) achieved; robust using large datasets [45] | Time-consuming, labor-intensive, potential biases from limited samples [45] | Validating stable reference genes for gene expression studies [45] |
Table 2: Comparison of Analysis Speed and Resource Requirements
| Method Category | Typical Timeframe | Key Resource Requirements | Relative Cost | Labor Intensity |
|---|---|---|---|---|
| AI/ML In Silico Tools [42] | Days to weeks | Computational power, specialized algorithms, large curated datasets [42] | Lower operational cost; high initial setup cost | Low after development |
| Traditional Wet Lab Methods (e.g., cell line validation) [44] | Months to years | Laboratory equipment, reagents, biological samples, skilled technicians [44] | High (e.g., >$100,000 for systematic reviews) [46] | High |
| Rapid Review (Knowledge Synthesis) [46] | 1–12 months | Information specialists, single reviewer for some steps [46] | Moderate (less than full systematic review) [46] | Moderate |
| Full Systematic Review (Knowledge Synthesis) [46] | 0.5–2 years | Full team for dual independent review, librarians, statisticians [46] | High (≥$100,000) [46] | Very High |
Experimental Protocols for Key AI/ML Applications
Protocol: iRGvalid for Reference Gene Validation
The iRGvalid method provides a robust in silico workflow to validate and identify the most stable reference genes from a pool of candidates using high-throughput gene expression data, eliminating the need for initial wet lab validation [45].
- Candidate Pool and Data Collection: Establish a candidate reference gene pool from literature or in-house studies. Select a set of expression data representing the study population from a database like The Cancer Genome Atlas (TCGA). Data should be normalized to TPM (Transcripts Per Kilobase Million) and log2-transformed [45].
- Double-Normalization Strategy:
- Step 1: Normalize the expression level of each individual gene against the total gene expression level of each sample.
- Step 2: Normalize the target gene to the candidate reference gene(s). For a single gene, use
Log2(TPM + 1)target - Log2(TPM + 1)ref. For a combination, use the arithmetic mean ofLog2(TPM + 1)reffor the combined reference genes [45].
- Regression Analysis and Evaluation: Perform linear regression analysis between the pre- and post-normalized target gene expression values across the entire sample set. Calculate the Pearson correlation coefficient (Rt) to evaluate the stability of the reference gene(s). A higher Rt value (closer to 1) indicates a more stable reference gene [45].
Protocol: In Silico Somatic Mutation Calling Validation
This protocol uses an in silico approach to validate and fine-tune bioinformatic pipelines for identifying somatic mutations in Whole Exome Sequencing (WES) data, addressing gaps in physical cell line validation [44].
- Artificial Mutation Introduction: Use a tool like Bamsurgeon (v1.4.1) to introduce artificial mutations into a normal .BAM file. This creates a synthetic tumor sample where the ground truth of introduced mutations is known [44].
- Pipeline Processing and Mutation Calling: Process the synthetic tumor-normal sample pair through the standard mutation calling pipeline (e.g., using tools like Strelka2) [44].
- Performance Assessment: Compare the mutations called by the pipeline against the known set of introduced mutations.
- Precision: Calculate the proportion of called mutations that are true positives (were introduced).
- Recall (Sensitivity): Calculate the proportion of introduced mutations that were successfully detected by the pipeline.
- Reproducibility: Assess the consistency of mutation calling across different simulated conditions, such as varying tumor purity levels [44].
Protocol: AI for Virtual Drug Screening
AI and ML algorithms can streamline the early drug discovery process by predicting the properties and activity of compounds in silico [42].
- Data Set Curation: Compile a large dataset of compounds with known biochemical activities and physicochemical properties. This serves as the training data for the AI model [42].
- Model Training and Validation: Train ML models (e.g., Random Forest, Support Vector Machines, Deep Neural Networks) on the curated dataset. Use a subset of held-out data for validation to test the model's predictivity [42].
- Prediction on Virtual Compound Libraries: Apply the trained model to screen large virtual chemical spaces (e.g., PubChem, ChemBank). The model predicts key properties such as biological activity, solubility, lipophilicity, and toxicity for each compound [42].
- Hit Selection and Validation: Select the top-ranking compounds ("hits") predicted to have the desired profile. These hits are then procured or synthesized for subsequent in vitro and in vivo experimental validation [42].
Workflow and Signaling Pathways
The following diagrams, generated using Graphviz DOT language, illustrate key workflows and logical relationships in AI-driven in silico methodologies.
iRGvalid Workflow for Gene Validation
AI-Driven Drug Screening and Validation
Continual Learning in AI Models
The "Nested Learning" paradigm addresses catastrophic forgetting in ML, crucial for models that need to learn sequentially without losing prior knowledge [47]. This is visualized as a continuum of memory systems.
The Scientist's Toolkit: Essential Research Reagents and Solutions
This section details key computational tools, datasets, and platforms that constitute the essential "research reagents" for AI-driven in silico prediction and design.
Table 3: Key Resources for AI/ML In Silico Research
| Item Name | Type | Function/Benefit | Example Use Case |
|---|---|---|---|
| TCGA (The Cancer Genome Atlas) Data [45] | Dataset | Provides large volumes of standardized, real-world genomic and transcriptomic data for model training and validation. | Validating stable reference genes in cancer research [45]. |
| IBM Watson [42] | AI Platform/Supercomputer | Analyzes patient medical information against vast databases to suggest treatment strategies and assist in rapid disease detection. | Rapid detection of diseases like breast cancer; analyzing medical information [42]. |
| Bamsurgeon [44] | Software Tool | Introduces artificial mutations into .BAM files, creating ground truth datasets for validating bioinformatics pipelines. | Validating somatic mutation calling in WES data [44]. |
| Deep Neural Networks (DNNs) [42] | Algorithm/Architecture | Recognizes complex, non-linear patterns in large datasets; superior for predicting biological activity and toxicity. | Virtual screening of compound libraries for drug discovery [42]. |
| E-VAI [42] | Analytical AI Platform | Uses ML algorithms to analyze market dynamics, competitors, and stakeholders to predict key sales drivers. | Strategic decision-making in pharmaceutical marketing and resource allocation [42]. |
| Continuum Memory System (CMS) [47] | Architectural Paradigm | Creates a spectrum of memory modules updating at different frequencies, enabling effective continual learning. | Preventing catastrophic forgetting in models that learn from sequential tasks [47]. |
| Virtual Chemical Spaces (e.g., PubChem, ChemBank) [42] | Database | Open-access repositories of millions of compounds, providing the "virtual matter" for in silico screening. | Ligand-based virtual screening and compound selection [42]. |
The comparative analysis presented in this guide underscores that AI and ML tools offer a powerful and often transformative alternative to traditional reference techniques in biomedical research and drug development. The core thesis of validating these rapid methods reveals a consistent trade-off: a significant increase in speed and scalability, sometimes at the cost of the comprehensive, though time-consuming, accuracy provided by gold-standard reference methods [46] [43].
The experimental data shows that AI/ML tools excel in specific, well-defined tasks. For instance, they demonstrate superior predictivity for ADMET properties compared to classical QSAR models [42] and offer a robust, high-throughput method for validating reference genes [45]. However, benchmarking against rigorous experimental standards remains crucial. As seen in cardiac safety testing, while in silico models provide valuable insights, their predictions do not yet perfectly recapitulate all experimental ex vivo observations, highlighting an area for further model refinement [43]. This reinforces the principle that for many applications, AI tools are best deployed as highly efficient screening mechanisms to prioritize candidates for downstream experimental validation, rather than as complete replacements for reference techniques. The future of in silico prediction lies in a collaborative framework, where rapid AI methods and traditional analytical techniques are used in concert to accelerate the path from discovery to clinical application.
The monitoring of microbiological water quality in pharmaceutical manufacturing is critical for ensuring product safety. For decades, the industry has relied on compendial methods, such as the heterotrophic plate count (HPC), which require a lengthy incubation period of up to 5 days [3]. This delay between sampling and obtaining results poses a significant risk, as it can postpone corrective actions following an out-of-specification (OOS) result [3]. Rapid microbiological methods (RMM), particularly those based on adenosine triphosphate (ATP) bioluminescence, have emerged as a viable alternative, offering results in minutes to hours instead of days [3]. This case study objectively evaluates the performance of ATP bioluminescence against traditional compendial methods for water quality monitoring, framed within the broader thesis of validating rapid methods against reference analytical techniques.
ATP bioluminescence is a biochemical reaction that leverages the firefly luciferase enzyme to detect viable microorganisms [48] [49]. The core reaction involves the oxidation of the substrate luciferin in the presence of ATP, magnesium, and oxygen, catalyzed by luciferase. This reaction produces light—typically measured in Relative Light Units (RLU)—in direct proportion to the amount of ATP present [3] [49].
A key advantage of this technology is that ATP is a universal energy currency found in all living cells, making the assay a broad indicator of viable contamination [49]. The reaction's high quantum yield, reported to be about 45% for firefly luciferase, allows for highly sensitive detection without the need for an external light source, thereby avoiding issues like autofluorescence and photobleaching common in fluorescence-based methods [48].
Principal Detection Modalities
In practice, two main approaches are used for ATP bioluminescence in water monitoring:
- Direct ATP Measurement: A sample is concentrated via membrane filtration and immediately analyzed. This method is extremely fast (results in about one minute) but has a higher limit of detection, typically in the range of 100 to 1000 colony-forming units (CFU) [3].
- Indirect ATP Measurement (with Enrichment): The filtered sample is incubated in a nutrient broth for a short enrichment period (e.g., overnight). Any microorganisms present will multiply and consume the added ATP. A subsequent drop in the light signal indicates microbial growth. This method can detect down to 1 CFU and provides results within 24 hours [3].
Comparative Performance Data: ATP Bioluminescence vs. Compendial Methods
The following tables summarize experimental data from studies comparing ATP bioluminescence with the traditional membrane filtration method (HPC) for monitoring pharmaceutical and hospital water systems.
Table 1: Summary of Comparative Studies and Key Findings
| Study Context/ Water System | Reference Method | ATP Bioluminescence Method | Correlation with HPC | Key Outcomes and Advantages of ATP |
|---|---|---|---|---|
| Pharmaceutical Manufacturing (Purified Water) [3] | Membrane filtration (R2A agar), 5-day incubation | Pallchek System (Direct & Indirect) | Good correlation demonstrated after system qualification | Provides results in minutes (direct) or 24 hours (indirect). Enables faster corrective actions. |
| Hospital Water Sources (Faucets & Purifiers) [50] [51] | Membrane filtration (PCA & Sabouraud agar) | 3M Clean-Trace Water ATP Test | No significant correlation found in complex hospital water matrix | Highlights limitation: ATP from non-microbial sources can interfere in certain environments. |
| Controlled Inoculum (S. aureus & C. parapsilosis) in Distilled Water [50] [51] | Spectrophotometry (Absorbance) | 3M Clean-Trace Water ATP Test | Strong, significant correlation (p<0.0001) | Confirms technology's fundamental reliability in a controlled, clean matrix. |
Table 2: Performance Characteristics and Limitations
| Parameter | Compendial Method (e.g., HPC) | ATP Bioluminescence Method |
|---|---|---|
| Time to Result | 5-14 days [3] [52] | 1 minute (direct) to 24 hours (indirect) [3] |
| Limit of Detection | 1 CFU [3] | 1 CFU (indirect); 100-1000 CFU (direct) [3] |
| Specificity | Detects only culturable microorganisms | Detects ATP from all viable cells (bacteria, yeast, mold) and can be affected by non-microbial ATP [50] |
| Primary Advantage | Gold standard, well-established, low material cost | Speed, facilitates real-time decision-making and PAT [3] |
| Primary Limitation | Long incubation delay, may not detect stressed organisms | Lower sensitivity for direct detection, potential for interference [3] [50] |
Experimental Protocols for Method Comparison
For a rigorous validation study comparing ATP bioluminescence to compendial methods, the following detailed protocols can be employed.
System Suitability and Qualification for ATP Bioluminescence
Before sample analysis, the performance of the ATP system must be verified [3].
- Instrument Background Check: The luminometer is placed on its test plate, and a reading is taken. The background should be <20 RLU [3].
- Reagent Background Check: A sample tray is placed on the test plate. Then, 150 µL of extractant and 100 µL of reconstituted bioluminescence reagent are added, and a measurement is taken within five seconds. The reading should be <80 RLU [3].
- Positive Control (Reagent Performance): A known ATP standard (e.g., 100 µL of a 10⁻⁹ M solution) is added to a sample holder, followed by 100 µL of bioluminescence reagent. The reading should typically fall between 10⁵ and 10⁶ RLU [3].
Direct Comparison Protocol for Water Samples
This protocol outlines a side-by-side test of water samples from a pharmaceutical distribution loop.
- Step 1: Sample Collection: Aseptically collect identical volumes of water from the same sample point (e.g., 200-300 mL) into sterile containers, potentially containing sodium thiosulfate to neutralize chlorine [50] [51].
- Step 2: Parallel Sample Processing:
- Compendial Method (HPC): Filter 100 mL of the sample through a 0.45 µm membrane. Transfer the membrane onto R2A agar and incubate at 30°C for 5 days. Count the colonies and express the result as CFU/100 mL [3] [51].
- ATP Bioluminescence (Direct): Filter a separate 100 mL aliquot through a 0.45 µm membrane. Follow the manufacturer's instructions for the specific ATP system (e.g., place the membrane in a reagent tube, activate the reaction, and measure RLU in the luminometer) [3].
- ATP Bioluminescence (Indirect): Filter another 100 mL aliquot and transfer the membrane to a vessel containing 10 mL of liquid culture media. Incubate for 18-24 hours at 30°C. After incubation, analyze 8 mL of the broth using the ATP bioluminescence assay [3].
- Step 3: Data Analysis: Compare the results. A positive indirect ATP test (low light output after enrichment) or a high direct ATP RLU reading should correlate with a high HPC count from the same sample point.
The workflow for this comparative analysis is summarized in the following diagram:
Validation within a Regulatory Framework
The validation of any rapid method must demonstrate its equivalence to the compendial method. Regulatory guidelines like USP 〈1223〉, Ph. Eur. 5.1.6, and PDA Technical Report 33 provide the framework for this validation [52].
A risk-based approach is increasingly adopted. For instance, a study designed according to USP 〈1223〉 tested equivalency on 120 samples using a "decision equivalence" model, acknowledging the binary (positive/negative) nature of the test. The study calculated a lower one-sided confidence interval for the difference in detection probabilities and found the ATP method to be statistically non-inferior to the 14-day USP 〈71〉 sterility test, with a difference within the non-inferiority limit of Δ=0.2 [52].
Recent updates, such as the new USP 〈73〉 "ATP Bioluminescence-Based Microbiological Methods for the Detection of Contamination in Short-Life Products" effective August 2025, provide clearer pathways for implementing these methods, especially for advanced therapies with short shelf-lives [52]. This reduces the validation burden, allowing users to leverage existing primary validation data and focus on product-specific suitability testing.
The validation pathway is a systematic process:
The Scientist's Toolkit: Essential Research Reagents and Materials
The following table details key components required for implementing ATP bioluminescence for water quality monitoring.
Table 3: Essential Research Reagent Solutions for ATP Bioluminescence
| Item | Function/Description | Example from Search Results |
|---|---|---|
| Luminometer | Instrument that measures the light output (RLU) from the bioluminescence reaction. | Pallchek Luminometer [3], EnSURE Touch [49] |
| ATP Assay Kit | Contains the lyophilized or liquid reagents, including luciferase and luciferin. | Pall High Sensitivity Reagent Test Kit [3], 3M Clean-Trace Water [50] |
| ATP Standard | A solution of known ATP concentration used for calibration and verifying reagent performance. | Supplier's ATP Correlation Kit [3] |
| Sterile Membranes (0.45µm) | For concentrating microorganisms from large water sample volumes. | Nitrocellulose membrane [50] [51] |
| Sterile Sampling Containers | For aseptic collection and transport of water samples. | Whirl-Pak Thio-Bags with sodium thiosulfate [50] [51] |
| Culture Media | For the compendial method and for the enrichment step in indirect ATP testing. | R2A Agar [3], Mueller-Hinton Broth [53], Sabouraud Dextrose Agar [50] |
ATP bioluminescence presents a compelling rapid alternative to traditional compendial methods for monitoring water quality in pharmaceutical manufacturing. The primary advantage is unequivocally speed, reducing the time to result from days to hours or even minutes, which aligns perfectly with Process Analytical Technology (PAT) initiatives and enables faster corrective actions [3].
However, this case study also highlights critical limitations. The technology's effectiveness can be matrix-dependent. While it shows excellent correlation with traditional methods in controlled settings and purified water systems [3], its performance can be compromised in complex water matrices where non-microbial ATP or interfering substances are present [50] [51]. Furthermore, the direct detection method has a higher limit of detection than the plate count.
Therefore, the choice to implement ATP bioluminescence should be based on a rigorous, risk-based validation study that demonstrates its equivalence to the compendial method for the specific water system in question. When properly validated, ATP bioluminescence becomes a powerful tool for enhancing microbial control strategies, protecting product quality, and ultimately, ensuring patient safety.
Overcoming Implementation Hurdles: A Troubleshooting Guide for Rapid Methods
Addressing Matrix Interferences and Sample Preparation Challenges
In analytical chemistry, particularly within pharmaceutical and clinical research, the accuracy of a result is fundamentally tied to the quality of the sample preparation process. Matrix interferences—where other components within a sample skew the measurement of an analyte—represent a significant hurdle for scientists. Effective sample preparation lays the foundation for reliable and reproducible data, a non-negotiable requirement throughout a drug product's lifecycle [54]. This guide objectively compares a modern, rapid dilution method for serum analysis against traditional sample preparation techniques, framing the comparison within the broader thesis of validating rapid methods against reference analytical techniques.
The central challenge is that sample matrices, such as serum, are complex. They contain proteins, salts, and organic molecules that can suppress or enhance the analyte signal in techniques like Inductively Coupled Plasma Mass Spectrometry (ICP-MS), leading to inaccurate measurements [55]. This discussion will explore how innovative, rapid methodologies are being developed and validated to overcome these persistent obstacles of contamination, inconsistent sampling, and complex matrix effects [56].
Understanding Sample Preparation and Matrix Interferences
Fundamental Challenges in Sample Preparation
Sample preparation is a critical step that directly influences the quality and reliability of the data obtained [56]. Several common challenges can compromise the integrity of results:
- Inconsistent Sampling Techniques: Variations in how samples are collected can introduce significant variability, making it difficult to draw meaningful comparisons or conclusions [56].
- Contamination Risks: Contamination is a constant threat, from the moment of collection through to preparation. Even minuscule amounts of foreign substances can significantly skew results, leading to inaccurate measurements [56].
- Sample Size and Availability: Researchers often work with scarce or difficult-to-procure samples, making it imperative to maximize their utility without compromising data quality [56].
- Handling Hazardous Materials: In some instances, researchers must contend with hazardous materials, which pose risks to both human health and the environment during sample collection and preparation [56].
The Problem of Matrix Interferences in Analytical Techniques
Matrix interference occurs when other components in a sample affect the accurate detection and quantification of the target analyte. In the context of biological samples like serum, the matrix is complex, containing proteins, lipids, and salts [55]. When using ICP-MS, these components can cause polyatomic interference and signal drift, leading to inaccurate readings for essential and toxic elements such as Lead (Pb), Cadmium (Cd), and Arsenic (As) [55]. Failure to adequately address these interferences can result in data that does not reflect the true state of the sample, with consequences for diagnostics, exposure assessment, and pharmaceutical quality control.
Comparison of Sample Preparation Methods
This section provides a detailed, objective comparison between a rapid dilution approach and the reference method of microwave digestion for preparing serum samples for multi-element analysis by ICP-MS.
Experimental Protocols
To ensure a fair comparison, the following detailed methodologies outline the procedures for both the reference and rapid methods.
Reference Method: Microwave Digestion
Microwave digestion is a widely accepted reference technique for preparing complex biological samples.
- Aliquoting: Precisely transfer 0.5 mL of the serum sample into a specialized microwave digestion tube.
- Acid Addition: Add 3 mL of ultrapure nitric acid to the tube. The acid acts as a digesting agent, breaking down organic materials.
- Digestion: Place the sealed tube into a microwave digestion instrument (e.g., Anton Paar Multiwave GO). Run a controlled temperature ramping program to completely digest the organic matrix.
- Cooling and Dilution: After digestion and cooling, carefully release pressure. Dilute the resulting digestate to a final volume, typically 15 mL, with ultra-pure water (18.2 MΩ·cm) [55].
- Analysis: The digested and diluted sample is now ready for analysis by ICP-MS.
Rapid Method: Direct Dilution with Matrix Matching
This method focuses on simplicity and speed while actively managing matrix effects.
- Diluent Preparation: Prepare a mixed diluent consisting of 0.5% ultra-pure nitric acid, 0.02% Triton X-100 (a surfactant to homogenize the solution), and 2% methanol (an organic solvent to improve signal stability) [55].
- Internal Standard Addition: Incorporate a multi-element internal standard solution (Sc, In, Y, Tb, Bi at 20 μg/L) directly into the diluent to correct for instrument drift and matrix suppression/enhancement [55].
- Sample Dilution: Dilute the serum sample 1 in 25 with the prepared matrix-matching diluent [55].
- Vortex Mixing: Mix the solution thoroughly to ensure homogeneity.
- Analysis: The diluted sample is directly analyzed by an ICP-MS equipped with a collision cell (using Helium gas) to remove polyatomic interferences [55].
Performance Data Comparison
The table below summarizes quantitative performance data for the rapid dilution method compared to the reference digestion method, highlighting its suitability for high-throughput analysis.
Table 1: Performance Comparison of Sample Preparation Methods for Serum Element Analysis by ICP-MS
| Performance Metric | Reference Method: Microwave Digestion | Rapid Method: Direct Dilution |
|---|---|---|
| Total Sample Preparation Time | Several hours (including digestion cycle) | Minutes [55] |
| Sample Volume Consumed | ~500 μL | 60 μL [55] |
| Linear Range (Coefficient of Determination) | ≥ 0.999 (for similar methods) | ≥ 0.9996 for all 23 elements [55] |
| Limits of Detection (LOD) | Low (ng/L range) | 0.0004 – 0.2232 μg/L (0.4 - 223.2 ng/L) [55] |
| Precision (Relative Standard Deviation) | < 10% (typical for validated methods) | < 12.19% (intra- and inter-day) [55] |
| Recovery (%) | 85-115% (acceptable range) | 88.98 – 109.86% [55] |
| Analysis of 1000 Samples | Impractical due to time constraints | Demonstrated as feasible and effective [55] |
Workflow Visualization
The following diagram illustrates the logical relationship and comparative steps involved in the two sample preparation pathways, underscoring the simplicity of the rapid method.
Figure 1: A logical workflow comparing the sample preparation steps for the traditional microwave digestion and the rapid direct dilution methods.
The Scientist's Toolkit: Key Research Reagent Solutions
Successful implementation of the rapid dilution method, and mitigation of matrix interference, relies on a specific set of reagents and tools. The following table details these essential materials and their functions.
Table 2: Essential Reagents and Materials for the Rapid Dilution Method
| Item | Function / Role in the Protocol |
|---|---|
| Ultra-pure Nitric Acid | Digestant; breaks down proteins and releases bound metals in the dilution step [55]. |
| Triton X-100 (Surfactant) | Homogenizes the solution, ensuring a consistent matrix between samples and standards to improve accuracy [55]. |
| Methanol / Butanol (Solvent) | Organic modifiers that enhance ionization efficiency and aerosol transport in the ICP-MS, boosting signal stability [55]. |
| Multi-element Internal Standard (Sc, In, Y, Tb, Bi) | Corrects for instrument drift and matrix-induced signal suppression or enhancement during analysis [55]. |
| ICP-MS with Collision/Reaction Cell | The analytical instrument; the collision cell (with He gas) eliminates polyatomic interferences, which is critical for accurate results with minimal sample preparation [55]. |
| Certified Reference Material (CRM) | Standard reference material (e.g., Trace Element Serum) used for method validation and ensuring accuracy [55]. |
Objective Comparison of Method Performance
The experimental data presented in Table 1 allows for a clear, objective comparison. The rapid dilution method demonstrates performance that is comparable to the reference digestion method in key areas of accuracy (recovery rates of 89-110%), precision (RSD < 12.19%), and sensitivity (LODs in the sub-μg/L range) [55]. This indicates that the simplified preparation does not sacrifice data quality when appropriately validated.
The most significant advantages of the rapid method are its dramatic improvements in throughput and efficiency. The ability to prepare samples in minutes rather than hours, while consuming only 60 μL of serum, makes it exceptionally suited for large-scale epidemiological studies or high-throughput pharmaceutical analysis where time and sample volume are critical constraints [55]. This aligns with the growing need for innovative solutions that streamline workflows without compromising data integrity [56].
Validation within the Broader Thesis
Framed within the context of validating rapid methods versus reference techniques, this comparison strongly supports the thesis. The rapid dilution method has been rigorously validated against a reference method using a certified serum reference material, with measured results for key elements falling within the specified range of the certificate [55]. This successful validation, coupled with its simplicity and speed, positions direct dilution as a powerful alternative to traditional digestion for routine, high-throughput analysis of liquid biological samples. It effectively addresses the classic challenges of matrix interference and sample preparation not through exhaustive removal of the matrix, but through intelligent compensation and matching, representing a modern approach to analytical problem-solving.
In the landscape of analytical science, the Limit of Detection (LOD) serves as a fundamental benchmark for method sensitivity, defining the lowest concentration of an analyte that can be reliably distinguished from a blank sample [57] [58]. Within the broader thesis of validating rapid methods against reference analytical techniques, optimizing for LOD is not merely a procedural requirement but a strategic imperative. It directly impacts a method's ability to detect trace-level compounds, thereby influencing decisions in pharmaceutical development, forensic analysis, and food safety [59] [4] [6]. The transition from traditional, often time-consuming compendial methods to Rapid Microbiological Methods (RMMs) and advanced chromatographic techniques necessitates a rigorous and comparative approach to LOD validation to ensure that gains in speed do not compromise analytical sensitivity [6] [60]. This guide objectively compares the performance of various rapid techniques, providing the experimental data and protocols essential for researchers and drug development professionals to make informed decisions.
LOD Fundamentals: Definitions and Calculation Frameworks
A clear understanding of LOD and its related parameters is crucial for any comparative validation study. The LOD is the lowest analyte concentration that can be reliably detected, but not necessarily quantified, with a specified degree of confidence [58]. It is distinct from the Limit of Quantitation (LOQ), which is the lowest concentration that can be measured with acceptable precision and accuracy [58] [61]. Furthermore, the Limit of Blank (LoB) defines the highest apparent analyte concentration expected to be found when replicates of a blank sample are tested [58].
Confusion often arises between LOD and analytical sensitivity. True sensitivity is defined as the slope of the analytical calibration curve (S = dy/dx), indicating how the measurement signal responds to changes in analyte concentration [57]. A method can be highly sensitive (producing a large signal change per unit concentration) yet have a poor LOD if background noise is significant.
Multiple statistical approaches exist for LOD determination, and the choice of method can influence the resulting value. Key methodologies are summarized in the table below.
Table 1: Statistical Approaches for Determining the Limit of Detection
| Approach Group | Core Concept | Representative Equation | Key Considerations |
|---|---|---|---|
| Signal-to-Noise [61] | Based on the ratio of the analyte signal to baseline noise. | LOD typically requires S/N ≥ 2:1 or 3:1. | Simple and widely used in chromatography; can be subjective for noisy baselines. |
| Blank Standard Deviation [58] [62] | Uses the mean and standard deviation of blank measurements. | LOD = Mean˅blank + 1.645(SD˅blank) (for α=5%)LOD = 3.3 × (σ/S) [62] | Requires a sufficient number of blank replicates (e.g., n=20). Assumes normal distribution of blank signals. |
| Calibration Curve [63] | Utilizes the standard error of the regression and the calibration curve slope. | LOD = 3.3 * (S˅d / b)Where S˅d is the standard deviation of the residuals and b is the slope. | A robust approach that incorporates the performance of the entire analytical method. |
The following diagram illustrates the statistical relationship between LoB, LOD, and the distributions of blank and low-concentration samples.
Figure 1: Statistical Definition of LoB and LOD. The LoB is derived from the blank distribution, while the LOD is a higher value derived from both the blank and a low-concentration sample, ensuring it can be distinguished from the LoB with high probability [58].
Comparative Experimental Data: LOD Performance Across Techniques
Validating rapid methods requires direct, quantitative comparison with reference techniques. The following tables summarize experimental LOD data from published studies and guidelines, highlighting the performance achievable with optimized methods.
Table 2: LOD Comparison of Rapid vs. Conventional GC-MS for Forensic Drug Analysis [4]
| Analyte | Conventional GC-MS LOD (μg/mL) | Rapid GC-MS LOD (μg/mL) | % Improvement | Key Optimization |
|---|---|---|---|---|
| Cocaine | 2.5 | 1.0 | 60% | Optimized temperature programming and carrier gas flow rate (2 mL/min). |
| Heroin | Data not specified in source | Improvement of at least 50% reported. | >50% | Reduced total run time from 30 min to 10 min using a 30-m DB-5 ms column. |
| General Performance | -- | -- | -- | RSDs < 0.25% for stable compounds; match quality scores > 90%. |
Table 3: LOD/LOQ Performance in Other Analytical Fields
| Method / Technique | Analyte / Application | Reported LOD | Reported LOQ | Reference Method / Context |
|---|---|---|---|---|
| Dumas Combustion [64] | Protein in Cereals & Oilseeds | 0.006% | 0.02% | Kjeldahl method; correlation R² = 0.9990. |
| HPLC with Absorbance Detection [61] | General Purity Testing | S/N ≥ 2:1 or 3:1 | S/N ≥ 10:1 | ICH Q2(R1) guideline validation criteria. |
| Rapid Microbiological Methods (RMM) [6] | Microbial Contamination | Must demonstrate equivalency to compendial methods (e.g., plate count). | Must demonstrate equivalency. | Validation per USP <1223> and Ph. Eur. 5.1.6. |
Detailed Experimental Protocols for LOD Determination and Optimization
Protocol 1: LOD Validation for a Rapid GC-MS Method for Seized Drugs
This protocol outlines the methodology used to achieve the significant LOD improvements shown in Table 2 [4].
1. Instrumentation and Materials:
- GC-MS System: Agilent 7890B GC connected to a 5977A single quadrupole MSD.
- Column: Agilent J&W DB-5 ms (30 m × 0.25 mm × 0.25 μm).
- Carrier Gas: Helium (99.999% purity) at a fixed flow rate of 2 mL/min.
- Test Solutions: Custom mixtures of target analytes (e.g., Cocaine, Heroin, MDMA) prepared in methanol at ~0.05 mg/mL.
- Data Acquisition: Agilent MassHunter and Enhanced ChemStation software.
2. Method Development and Optimization:
- Temperature Programming: The primary optimization focus. The initial conventional method's 30-minute runtime was reduced to 10 minutes by adjusting the temperature ramp rate and final hold times.
- Flow Rate Optimization: A fixed flow rate of 2 mL/min was established as optimal for speed and separation efficiency.
- Comparative Analysis: The same test solutions and instruments were used to run both the conventional and optimized rapid methods for direct comparison.
3. LOD Determination and Validation:
- Sample Preparation: For solid seized samples, 0.1 g of powdered material was extracted with 1 mL of methanol via sonication and centrifugation. For trace samples, swabs moistened with methanol were used to collect residues from surfaces, which were then vortexed in methanol for analysis.
- LOD Calculation: The LOD was determined empirically by analyzing progressively diluted samples and establishing the lowest concentration that could be reliably detected with a signal-to-noise criterion and confirmed by the reproducibility of detection.
- Validation Metrics: The method's repeatability and reproducibility were assessed by calculating Relative Standard Deviations (RSDs) of retention times (<0.25%). Accuracy was confirmed by analyzing 20 real case samples and achieving match quality scores exceeding 90% against library spectra.
Protocol 2: LOD and LOQ Determination via Signal-to-Noise in HPLC
For chromatographic methods used in purity testing, the following protocol is standard practice [61].
1. Baseline Noise Measurement:
- Record a baseline using a blank sample injection.
- For a horizontal baseline, measure the difference between the highest and lowest baseline signals over a specified time window. The noise height is half of this difference.
- For a sloping baseline (common in gradient elution), carefully draw upper and lower tangents that follow the true baseline drift. The vertical distance between these tangents is used to determine the noise height.
2. Analyte Signal Measurement:
- Inject a sample containing a low concentration of the analyte.
- Measure the height of the analyte peak from the center of the baseline noise.
3. Calculation of S/N and Determination of LOD/LOQ:
- Calculate the Signal-to-Noise Ratio (S/N) = (Analyte Peak Height) / (Noise Height).
- The LOD is the concentration that yields an S/N of 2:1 or 3:1.
- The LOQ is the concentration that yields an S/N of 10:1.
The general workflow for troubleshooting and optimizing LOD in an analytical method is summarized below.
Figure 2: LOD Optimization and Troubleshooting Workflow. A systematic approach to improving LOD, covering instrument selection, sample preparation, and data analysis [61] [62] [4].
The Scientist's Toolkit: Essential Reagents and Materials for LOD Optimization
Successful LOD optimization relies on the selection of appropriate reagents and materials. The following table details key solutions used in the featured experiments and broader practice.
Table 4: Research Reagent Solutions for LOD-Critical Experiments
| Item / Solution | Function in LOD Optimization | Example from Protocols |
|---|---|---|
| High-Purity Solvents | Minimize baseline noise and background interference, especially in UV detection at low wavelengths. | Using HPLC-grade acetonitrile over methanol to reduce intrinsic absorption [61]. |
| Certified Reference Materials | Provide known, traceable analyte concentrations for accurate instrument calibration and LOD verification. | Drug analytes (Cocaine, Heroin) sourced from Sigma-Aldrich (Cerilliant) [4]. |
| Blank Matrix Samples | Essential for empirical determination of LoB and for assessing matrix interference in the method. | Use of drug-free sample swabs and blank methanol injections [58] [4]. |
| Solid-Phase Extraction (SPE) Cartridges | Pre-concentrate analytes and clean up complex sample matrices, directly improving the effective LOD. | Cited as a key sample preparation technique for LOD optimization [62]. |
| Stable Isotope-Labeled Internal Standards | Correct for analyte loss during preparation and ionization variability in mass spectrometry, improving precision at low levels. | Common practice in quantitative LC-MS/MS, though not explicitly listed in the search results. |
| Optimized Chromatographic Columns | Improve separation efficiency and peak shape, leading to higher signal intensity and better S/N ratios. | Use of a DB-5 ms column for GC-MS; selecting columns with appropriate dimensions and stationary phase [61] [4]. |
The pursuit of optimal Limits of Detection is a cornerstone in the validation of rapid analytical methods. As demonstrated, significant improvements in LOD—over 50% in the case of rapid GC-MS for drug analysis—are achievable through systematic optimization of instrument parameters, sample preparation, and data processing [4]. The experimental data and detailed protocols provided herein offer a framework for scientists to conduct their own comparative studies. A successful validation strategy must be holistic, integrating rigorous statistical assessment of LOD [58] [63], practical troubleshooting to minimize noise [61], and a thorough understanding of regulatory expectations [59] [6]. By adhering to these principles, researchers can confidently deploy rapid methods that are not only faster but also demonstrably sensitive and fit for their intended purpose in drug development and beyond.
For researchers and scientists in drug development, the validation of any analytical method is a critical step in ensuring data integrity and regulatory compliance. Within this process, specificity stands as a cornerstone, confirming that a method can accurately measure the analyte of interest amidst a complex sample matrix. This attribute is paramount for avoiding cross-reactivity and preventing false positives, which can compromise research outcomes and patient safety. This guide objectively compares the performance of rapid methods against traditional reference techniques, with a focused examination of experimental data related to specificity. Establishing robust specificity is a fundamental pillar in the broader thesis of validating modern rapid methods against established analytical techniques, ensuring that gains in speed do not come at the cost of accuracy.
Core Principles of Specificity Validation
Specificity validation definitively determines an analytical method's ability to uniquely identify and quantify the target analyte in the presence of other components that are expected to be present, such as impurities, degradants, or matrix components [65]. A method with high specificity will yield an unambiguous result, proving that the measured signal is due solely to the analyte and not an interfering substance.
The primary risks of inadequate specificity are:
- Cross-Reactivity: This occurs when the method detects substances that are structurally or functionally similar to the target analyte, such as metabolites, homologous proteins, or closely related species in microbiological assays [65].
- False Positives: A direct consequence of cross-reactivity, where a sample is incorrectly identified as containing the analyte.
- False Negatives: Where an interference masks or inhibits the detection of the analyte, leading to an incorrect negative result.
For microbiological rapid diagnostic tests (RDTs), the principles of inclusivity and exclusivity testing are used to define specificity. Inclusivity is the ability of the test to detect the target organism from a wide range of strains, while exclusivity confirms that the test does not react with non-target, but closely related, organisms [59].
Experimental Protocols for Assessing Specificity
A robust experimental protocol is essential for generating conclusive data on method specificity. The following methodologies are adapted from international validation guidelines for both microbiological and chemical analytical methods [59] [66].
Protocol for Inclusivity and Exclusivity Testing
This protocol is critical for microbiological assays, such as those for Salmonella, Listeria, and E. coli, but the principles apply to molecular and immunoassays in drug development.
- Objective: To verify the method's detection capability for a wide range of target strains (inclusivity) and its lack of reaction with non-target strains (exclusivity).
- Materials:
- A panel of 30-50 well-characterized target strains (for inclusivity) representing genetic and phenotypic diversity.
- A panel of 30 or more non-target strains (for exclusivity), including closely related species and common environmental flora.
- Reference method materials (e.g., culture media, confirmation reagents).
- Rapid method kits or equipment.
- Procedure:
- Prepare standardized inocula for each strain in the inclusivity and exclusivity panels.
- Test each sample using the rapid method under validation and the reference method according to established protocols.
- For each strain, record the result as positive or negative.
- Data Analysis:
- Calculate the inclusivity rate as the percentage of target strains correctly identified as positive.
- Calculate the exclusivity rate as the percentage of non-target strains correctly identified as negative [59].
- Acceptance Criteria: A high-performing method typically demonstrates inclusivity and exclusivity rates of 100%, though minor deviations may be investigated and justified.
Protocol for Cross-Reactivity Assessment in Immunoassays
This protocol is designed to evaluate potential interferences in ligand-binding assays, a common format in pharmaceutical bioanalysis.
- Objective: To determine the potential for structurally similar compounds (e.g., metabolites, co-administered drugs) to produce a signal in the assay.
- Materials:
- Stock solutions of the target analyte.
- Stock solutions of potential interfering compounds (metabolites, precursors, etc.).
- Assay reagents, buffers, and plates.
- Procedure:
- Prepare samples spiked with the potential interfering compound at a high, physiologically relevant concentration (e.g., 1000 ng/mL or 10-fold the expected maximum concentration).
- Prepare a control sample spiked with only the analyte at a low concentration near the lower limit of quantification (LLOQ).
- Prepare a blank sample (matrix without analyte or interferent).
- Analyze all samples in replicate (n≥3) using the rapid method.
- Data Analysis:
- Compare the measured concentration of the sample containing the interferent to the control sample.
- Calculate the apparent analyte concentration caused by the interferent.
- Acceptance Criteria: The measured concentration in the presence of the interferent should be less than the LLOQ of the assay, demonstrating that the cross-reactivity does not generate a clinically or analytically significant signal.
Protocol for Specificity in Chromatographic Methods
For techniques like HPLC or UPLC, specificity is demonstrated by resolving the analyte peak from all potential impurities.
- Objective: To prove that the analyte chromatographic peak is pure and free from co-eluting substances.
- Materials:
- Blank sample matrix.
- Sample of the analyte at working concentration.
- Samples spiked with known impurities, degradants (from forced degradation studies), and matrix components.
- Procedure:
- Chromatographic analysis of the blank matrix to identify endogenous peaks.
- Analysis of the analyte to establish retention time and peak shape.
- Analysis of samples containing the analyte plus individual and combined potential interferents.
- Use of diode-array detector (DAD) or mass spectrometer (MS) to check peak purity.
- Data Analysis:
- Assess the chromatographic resolution between the analyte peak and the closest eluting potential interferent. Resolution (Rs) > 2.0 is generally desirable.
- Review peak purity indices from DAD or MS data to confirm a homogeneous peak.
- Acceptance Criteria: The analyte peak should be baseline resolved from all other peaks, and peak purity tools should confirm no co-elution.
Comparative Performance Data: Rapid vs. Reference Methods
The following tables summarize quantitative data from field studies and validation reports, comparing the specificity-related performance of rapid methods against traditional reference techniques.
Table 1: Performance Comparison of Microbiological Rapid Methods vs. Traditional Culture
This table summarizes data from validation studies for pathogen detection, following AOAC guidelines [59].
| Microorganism | Method Type | Specificity (%) | False Positive Rate (%) | Exclusivity Panel (No. of Strains) |
|---|---|---|---|---|
| Salmonella spp. | Reference Culture (MLG) | 100.0 | 0.0 | 30 |
| Rapid Immunoassay (VIDAS) | 99.5 | 0.5 | 30 | |
| Rapid PCR (BAX System) | 99.8 | 0.2 | 30 | |
| Listeria monocytogenes | Reference Culture (FDA-BAM) | 100.0 | 0.0 | 30 |
| Rapid Chromogenic Media | 99.2 | 0.8 | 30 | |
| Rapid Lateral Flow (Duopath) | 98.9 | 1.1 | 30 | |
| E. coli O157 | Reference Culture (USDA-MLG) | 100.0 | 0.0 | 30 |
| Rapid Immunoassay (Reveal) | 99.4 | 0.6 | 30 |
Table 2: Performance of Malaria Rapid Diagnostic Tests (RDTs) vs. Microscopy
This table is based on a field evaluation of bivalent RDTs in a central Indian study, highlighting variability in specificity for Plasmodium vivax [66].
| RDT Brand (Target Antigen) | Parasite Species | Sensitivity (%) [95% CI] | Specificity (%) [95% CI] | Heat Stability (Sensitivity at 45°C after 90 days) |
|---|---|---|---|---|
| Microscopy (Gold Standard) | P. falciparum | 100.0 [Reference] | 100.0 [Reference] | N/A |
| P. vivax | 100.0 [Reference] | 100.0 [Reference] | N/A | |
| RDT A (pLDH/HRP2) | P. falciparum | 98.0 [95.9-98.8] | 99.1 [98.5-99.5] | >95% |
| P. vivax | 80.0 [94.9-83.9] | 98.5 [97.8-99.0] | ~78% | |
| RDT B (pLDH/HRP2) | P. falciparum | 76.0 [71.7-79.6] | 97.8 [96.9-98.4] | >90% |
| P. vivax | 20.0 [15.6-24.5] | 99.0 [98.3-99.4] | <50% |
Visualizing Experimental Workflows
The following diagrams illustrate the key experimental pathways and workflows for specificity validation using the specified color palette.
Diagram 1: Specificity validation workflow.
Diagram 2: Cross-reactivity in immunoassays.
The Scientist's Toolkit: Essential Research Reagents & Materials
The following table details key reagents and materials essential for conducting rigorous specificity validation studies.
Table 3: Key Research Reagent Solutions for Specificity Validation
| Item | Function in Specificity Assessment |
|---|---|
| Characterized Strain Panels | Collections of target and related non-target organisms used for inclusivity/exclusivity testing in microbiological assays [59]. |
| Analytical Grade Reference Standards | Highly pure samples of the analyte and potential interferents (metabolites, impurities) used to challenge the method's selectivity [65]. |
| Specific Antibodies (Monoclonal/Polyclonal) | For immunoassays; the quality and specificity of the antibody are the primary determinants of cross-reactivity. |
| Primers and Probes | For molecular methods (PCR, qPCR); must be designed to target unique genetic sequences to minimize off-target binding. |
| Chromatographic Columns | Different stationary phases (C18, HILIC, etc.) are tested to achieve optimal separation of the analyte from interferents. |
| Sample Matrix Blanks | The actual biological matrix (e.g., plasma, serum, tissue homogenate) without the analyte, used to identify background interference. |
The Role of Standard Reference Materials (SRMs) in Verifying Accuracy
In the demanding fields of pharmaceutical development and clinical diagnostics, the veracity of analytical results is paramount. What haunts analytical scientists after a day's work is often not merely the sensitivity or precision of their methods, but a more fundamental question: Are the results accurate, truly reflecting the actual value? [67] This challenge is particularly acute when validating rapid analytical methods against established reference techniques. In this context, Standard Reference Materials (SRMs) emerge as indispensable tools, providing the anchor of traceability that allows researchers to confidently answer this question [67].
Produced by organizations like the National Institute of Standards and Technology (NIST), SRMs are certified for specific chemical or physical properties, serving as benchmarks for method validation, instrument calibration, and quality assurance [68] [67]. Their role is crucial in the transition from discovery-oriented omics research to targeted, quantitative validation—a bottleneck in biomarker development and drug discovery pipelines [69]. This guide objectively compares the performance of SRM-supported validation against alternative approaches, providing researchers with data-driven insights for their analytical workflows.
SRM Fundamentals and Commutability in Clinical Assays
The Evolving Landscape of Clinical SRMs
NIST maintains a growing portfolio of over 30 SRMs for clinical diagnostics, with a deliberate shift from lyophilized materials to fresh-frozen matrices that demonstrate improved commutability with routine clinical assays [68]. Commutability—the ability of a reference material to behave similarly to native patient samples across different measurement procedures—is essential for ensuring that validation results translate to real-world applications. This evolution directly supports the needs of in-vitro diagnostic (IVD) manufacturers who must comply with traceability requirements under the European Union's IVD medical device directive [68].
The certification of SRMs involves carefully designed programs that typically employ multiple analytical methods and often multiple laboratories [67]. The resulting uncertainty statements on SRM certificates are more than simple precision estimates; they encompass method imprecision, potential systematic errors between methods, and material variability, providing a comprehensive assessment of accuracy [67].
The Critical Need for SRMs in Analytical Chemistry
Even the most precise methods can yield inaccurate results, and without SRMs for validation, analysts may significantly overestimate their measurement certainty. A revealing survey of literature data for NIST SRM 1571 (Orchard Leaves) demonstrated that for non-certified elements like aluminum and titanium, reported values spanned ranges of 99-824 μg/g and 2.4-191 μg/g respectively, with uncertainty estimates often failing to capture the true variability [67]. This underscores a critical reality: precision does not guarantee accuracy. The availability of a certified value for iron (300 ± 20 μg/g) in the same material resulted in a much tighter clustering of reported values (121-884 μg/g), though still revealing substantial deviations in some reports [67]. This data highlights how SRMs serve as reality checks, revealing methodological biases that might otherwise go undetected.
Performance Comparison: SRM-Guided Analysis Versus Alternatives
Quantitative Mass Spectrometry vs. Immunoassays
Targeted mass spectrometry techniques, particularly Selected Reaction Monitoring (SRM) and Multiple Reaction Monitoring (MRM), have emerged as powerful alternatives to immunoassays for protein quantification, especially during biomarker validation [69]. The table below compares their key performance characteristics:
Table 1: Comparison of SRM/MRM Mass Spectrometry with Immunoassays for Protein Quantification
| Performance Characteristic | SRM/MRM Mass Spectrometry | Traditional Immunoassays (ELISA) |
|---|---|---|
| Principle | Based on mass spectrometry, quantifying peptide segments for direct measurement of protein expression levels [70] | Based on antibodies, quantifying protein-protein interactions indirectly [70] |
| Specificity | High; capable of distinguishing post-translational modifications, SNPs, and protein variants [70] | Variable; potentially affected by cross-reactivity [70] |
| Throughput | High; can monitor 50-100 transitions in a single analysis [69] | Medium to High; traditional ELISA measures single-plex, while liquid chip technology can test dozens of targets [70] |
| Development Time & Cost | Moderate; requires peptide selection and method optimization [70] | High; lengthy antibody production and validation [69] |
| Reproducibility | Excellent; R² typically 0.88-0.93 between technical replicates [69] | Generally good but batch-to-batch antibody variation possible |
| Sensitivity | Moderate (fmol level) [69] | High [70] |
The data shows that SRM/MRM assays provide an excellent balance of specificity, reproducibility, and multiplexing capability without requiring specific antibodies, which are often unavailable for novel protein targets [69] [70].
Correlation Between SRM/MS and Immunoassay Results
Direct comparisons between SRM/MS and established immunoassays demonstrate generally good correlation, though this varies by specific analyte. In one study quantifying serum proteins, the correlation between SRM/MS and LUMINEX assays was excellent for serum amyloid A (SAA; R² = 0.928) and sex hormone binding globulin (SHBG; R² = 0.851), but less ideal for ceruloplasmin (CP; R² = 0.565) [69]. This variance highlights the importance of method-specific validation using appropriate SRMs.
SRM/MRM assays demonstrate linearity across concentration ranges of 10³-10⁴, with detection capabilities at the 0.2-2 fmol level, comparable to many commercial ELISA kits [69]. The technique's reproducibility between technical replicates is generally very good but can depend on the specific proteins/peptides being monitored (R² = 0.931 and 0.882 for SAA and SHBG, and 0.723 for CP in one study) [69].
Table 2: Analytical Performance of SRM/MRM for Specific Protein Targets
| Protein Target | Linear Range | Detection Limit | Correlation with Immunoassay (R²) | Reproducibility (R²) |
|---|---|---|---|---|
| Serum Amyloid A (SAA) | 10³-10⁴ | 0.2-2 fmol | 0.928 [69] | 0.931 [69] |
| Sex Hormone Binding Globulin (SHBG) | 10³-10⁴ | 0.2-2 fmol | 0.851 [69] | 0.882 [69] |
| Ceruloplasmin (CP) | 10³-10⁴ | 0.2-2 fmol | 0.565 [69] | 0.723 [69] |
Experimental Protocols for SRM-Based Method Validation
Protocol 1: Validating XRF Methods for Lead Detection Using SRM 2569
NIST SRM 2569 (Lead in Paint Films) provides a case study in validating non-destructive test methods, particularly those based on X-ray fluorescence (XRF) spectrometry [71].
Materials Required:
- SRM 2569 Level 2 (known to present data interpretation challenges as analysis area decreases)
- XRF spectrometer
- Mounting apparatus to minimize coupon handling
Methodology:
- Measure at least three independent locations on the SRM coupon to account for material heterogeneity
- Calculate the median of the replicate lead results for comparison to certified values
- Document method repeatability through repeated measurements
- Test for bias by comparing results to SRM-certified values
Key Consideration: SRM 2569 is not recommended for routine control chart materials because frequent handling causes rapid coupon deterioration. This highlights the importance of using SRMs appropriately—primarily for method validation rather than daily quality control [71].
Protocol 2: Protein Quantification Using SRM/MRM Without Isotope Labeling
This protocol, adapted from literature, enables rapid protein quantification when immunoassays are unavailable [69].
Materials Required:
- Purified protein standards or neat serum samples
- Standard proteins for calibration curves (e.g., ceruloplasmin, serum amyloid A)
- Trypsin (sequencing grade) for protein digestion
- Dithiotheritol (DTT) for reduction
- Iodoacetamide (IAA) for alkylation
- Triple quadrupole mass spectrometer with nano-HPLC system
Methodology:
- Sample Preparation:
- Dilute serum samples 1:100 with 50 mM ammonia bicarbonate
- Denature and reduce proteins with 10 mM DTT at 95°C for 5 minutes
- Alkylate with iodoacetamide (20 mM final concentration) for 30 minutes in the dark
- Digest with trypsin (enzyme:protein ratio 1:50) at 37°C for 12 hours
- Terminate digestion with formic acid (1% final concentration)
Transition Development:
- Select proteotypic peptides unique to the target protein using software tools (e.g., Skyline, MIDAS)
- Apply filters: Q1 m/z > 400, Q3 m/z < 1200, peptides 6-30 amino acids in length
- For each signature peptide, select 2-3 fragment ions with the highest SRM response
- Optimize collision energy for each transition
LC-SRM/MRM Analysis:
- Load digested sample onto reversed-phase C18 column
- Separate peptides using 5%-40% acetonitrile gradient over 40 minutes
- Monitor transitions with dwell time of 80 ms per transition
- Use information-dependent acquisition to trigger MS/MS scans when transition intensity exceeds 200 cps
Data Analysis:
- Integrate peak areas automatically using analytical software
- Construct calibration curves using standard proteins
- Quantify target proteins in unknown samples based on transition intensities
This workflow demonstrates how SRM/MRM can be deployed without isotopic labeling, reducing cost and complexity while maintaining quantitative accuracy comparable to immunoassays [69].
Workflow Visualization: SRM/MRM Method Development
The following diagram illustrates the complete workflow for developing and implementing a targeted SRM/MRM assay, from initial discovery to quantitative validation:
This workflow highlights the iterative nature of method development, where data processing results may feed back into refined hypothesis generation. The transition from discovery phases (yellow) to implementation phases (green) represents the critical validation bridge that SRM/MRM provides.
Automated Data Processing and Statistical Validation
As SRM/MRM experiments scale to encompass hundreds of transitions across thousands of samples, automated data processing becomes essential. The mProphet algorithm was developed specifically to address this need, providing automated statistical validation for large-scale SRM experiments [72]. This system computes accurate error rates for peptide identification and combines multiple data features into a statistical model to maximize specificity and sensitivity, replacing subjective manual inspection with consistent, objective criteria [72].
Similarly, in online controlled experiments, automated Sample Ratio Mismatch (SRM) detection has been implemented to proactively identify data quality issues [73]. These systems automatically perform chi-squared tests on experiment traffic distribution and alert researchers via email or chat applications when mismatches are detected, enabling rapid investigation of root causes such as platform-specific implementation errors or performance-related data loss [73].
Essential Research Reagent Solutions
The following table details key materials and reagents essential for implementing SRM-based validation protocols:
Table 3: Essential Research Reagents for SRM-Based Method Validation
| Reagent/Material | Function | Example Applications |
|---|---|---|
| NIST SRM 2569 | Validation of XRF methods for lead detection in paint films [71] | Consumer product safety testing |
| NIST SRM 955c/d | Quality control for toxic metal analysis in blood matrices [68] | Clinical and occupational health monitoring |
| NIST SRM 967a | Reference material for creatinine measurement in human serum [68] | Clinical diagnostics (kidney function) |
| Triple Quadrupole Mass Spectrometer | Targeted quantification via SRM/MRM with high sensitivity and specificity [74] [70] | Protein biomarker verification, metabolomics |
| Trypsin (Sequencing Grade) | Protein digestion to generate peptides for SRM/MRM analysis [69] | Bottom-up proteomics |
| Stable Isotope-Labeled Peptides | Internal standards for precise quantification in proteomics [69] | Absolute protein quantification |
| mProphet Software | Automated statistical validation of large-scale SRM data sets [72] | Data quality control in targeted proteomics |
Standard Reference Materials provide the fundamental link between rapid analytical methods and internationally recognized measurement systems. In the validation of new methodologies—particularly the transition from discovery-oriented omics to targeted quantification—SRMs offer the traceability and accuracy assessment that underpin scientific credibility. While techniques like SRM/MRM mass spectrometry provide powerful alternatives to traditional immunoassays, their validation depends ultimately on connection to higher-order reference materials and methods.
The continuing evolution of SRMs, particularly toward fresh-frozen clinical materials that better commutate with routine assays, ensures their ongoing relevance in diagnostic and pharmaceutical development. As the pace of analytical innovation accelerates, the role of SRMs in verifying accuracy remains not merely relevant, but increasingly essential for researchers, scientists, and drug development professionals committed to measurement integrity.
Adopting a Risk-Based Approach for Efficient Validation (GAMP 5, CSA)
In the highly regulated life sciences environment, the validation of computerized systems is critical for ensuring data integrity, product quality, and patient safety. For decades, Good Automated Manufacturing Practice (GAMP), particularly its fifth version known as GAMP 5, has served as the industry standard for computer system validation (CSV). However, a significant shift is occurring with the introduction of Computer Software Assurance (CSA), a modernized approach championed by the U.S. Food and Drug Administration (FDA) that emphasizes risk-based critical thinking over prescriptive documentation [75].
This evolution reflects a broader industry movement toward more efficient, focused quality assurance processes. While traditional GAMP 5 provides a structured, lifecycle-based validation process with strong emphasis on comprehensive documentation, CSA represents a streamlined framework that prioritizes critical thinking and risk-based approaches to reduce unnecessary validation efforts without compromising system quality or compliance [75] [76]. Understanding the distinctions, applications, and synergistic potential of these frameworks is essential for researchers, scientists, and drug development professionals seeking to optimize their validation strategies while maintaining rigorous regulatory compliance.
Framework Comparison: GAMP 5 versus Computer Software Assurance
Core Principles and Strategic Objectives
GAMP 5 and CSA, while sharing the ultimate goal of ensuring system reliability and compliance, differ fundamentally in their philosophical approach and implementation strategies. The following table summarizes their key characteristics:
Table 1: Core Characteristics of GAMP 5 and CSA
| Characteristic | GAMP 5 | Computer Software Assurance (CSA) |
|---|---|---|
| Primary Focus | Lifecycle-based validation with comprehensive documentation [75] | Risk-based assurance focusing on patient safety, product quality, and data integrity [75] [77] |
| Core Approach | Structured, process-driven validation [75] | Critical thinking and risk-informed decision making [75] [78] |
| Documentation Strategy | Extensive documentation throughout the validation lifecycle [75] | "Right-sized," value-driven documentation; consolidated records where possible [77] |
| Testing Emphasis | Often rigorous, scripted testing across many system functions [76] | Risk-based testing with increased unscripted (ad hoc) testing to uncover hidden bugs [76] [78] |
| Regulatory Alignment | Global industry standard for compliance [75] | FDA-driven initiative to modernize validation processes [75] |
| Efficiency | Can involve significant effort on lower-risk system aspects [77] | Aims to reduce "non-value-added" activities and over-documentation [75] |
The GAMP 5 Second Edition: Bridging to Modern Practices
The release of the GAMP 5 Second Edition in July 2022 marked a significant update to accommodate technological advancements and explicitly incorporate CSA principles [78]. Key updates include:
- Formal Recognition of Agile Development: The second edition acknowledges the shift from traditional waterfall models to agile, iterative development, allowing for continuous integration and testing [78].
- Explicit Emphasis on Critical Thinking: A new appendix (M12) encourages a risk-based, patient-centric approach over rigid compliance checklists, focusing effort on what truly matters [78].
- Guidance for Advanced Technologies: New appendices address the validation of Artificial Intelligence (AI), Machine Learning (ML), blockchain, and cloud computing [78].
- Smarter Testing aligned with CSA: Appendix D5 supports risk-based testing strategies and incorporates unscripted testing methods, moving away from exhaustive scripted testing for all functions [78].
Experimental Validation: Applying GAMP 5 and CSA Principles
Protocol for a Risk-Based Validation Approach
The following workflow diagram illustrates a modernized validation process integrating GAMP 5 and CSA principles, suitable for validating a diverse range of systems from standard software to complex AI-driven platforms:
Workflow Title: Integrated GAMP 5 & CSA Validation Process
Methodology Details: This integrated protocol emphasizes critical thinking and risk-based decisions at every stage. The process begins with a clear definition of the system's intended use and its potential impact on patient safety, product quality, and data integrity [75] [77]. The system is then categorized according to the GAMP 5 category framework (e.g., Standard Software, Configured, Custom) to determine the appropriate validation approach [77]. A pivotal step involves leveraging supplier expertise and existing documentation, such as design-level testing evidence, to avoid redundant efforts [77]. A focused risk assessment identifies critical aspects requiring rigorous testing versus those needing less scrutiny [78]. The subsequent validation strategy, testing execution, and documentation are all tailored based on the system's risk profile, ensuring efficient use of resources while maintaining a high level of assurance [76] [77].
Quantitative Comparison of Validation Outcomes
Adopting a CSA-informed approach within the GAMP framework fundamentally reallocates validation effort. The following table quantifies the efficiency gains, contrasting traditional CSV with the modern CSA approach:
Table 2: Efficiency Comparison: Traditional CSV vs. CSA Approach
| Validation Activity | Traditional CSV Effort | CSA-Based Effort | Key Efficiency Driver |
|---|---|---|---|
| Requirements & Risk Documentation | Extensive, separate documents [78] | Consolidated, integrated documents [78] [77] | Combined User/Functional Requirements & Risk Assessment [78] |
| Testing Effort Distribution | Heavily scripted, broad coverage [76] | ~80% testing, ~20% documentation (anecdotal) [76] | Risk-based focus; ad-hoc & exploratory testing [76] [78] |
| Focus on High-Risk Functions | Can be diluted by uniform testing [77] | Highly concentrated and rigorous [77] | Critical thinking applied to patient impact [78] [77] |
| Leveraging Supplier Work | Often re-testing from scratch [77] | Qualified and leveraged extensively [77] | Supplier qualification and collaboration [77] |
| Overall Validation Efficiency | Lower due to non-value-added tasks [75] | Higher; reduces cost and time to market [76] | Holistic, risk-smart application of resources [75] [76] |
Implementing a combined GAMP 5 and CSA strategy requires not just a shift in mindset but also the application of specific tools and documents. The following table lists key components of the modern validation toolkit.
Table 3: Research Reagent Solutions for Efficient Validation
| Tool or Document | Function in Validation Process |
|---|---|
| Integrated Requirements & Risk Specification | Combines user/functional requirements with risk assessment into a single, streamlined document, promoting clarity and traceability [78] [77]. |
| Risk Assessment Matrix | A structured tool to identify, analyze, and evaluate risks to patient safety, product quality, and data integrity, guiding the entire validation strategy [76] [77]. |
| Unscripted (Ad hoc) Test Protocols | Formalizes exploratory testing to uncover unforeseen bugs, leveraging tester critical thinking and freeing them from strict scripts for non-critical features [76] [78]. |
| Supplier Qualification Package | Documentation providing assurance of a software supplier's development practices, enabling leverage of their testing evidence [77]. |
| Electronic Test Platforms | Automated testing tools that facilitate continuous validation and efficient execution of test cases, especially for regression testing [75]. |
The journey from traditional GAMP 5 CSV to a modern approach enhanced by Computer Software Assurance represents a necessary evolution for the life sciences industry. Rather than viewing CSA as a replacement for GAMP 5, it is more accurate to see it as a powerful enhancement that injects critical thinking, efficiency, and a sharper risk-based focus into established validation practices [78] [77].
The GAMP 5 Second Edition formally acknowledges this synergy, providing a framework where agile development, cloud computing, and advanced technologies like AI can be validated effectively without sacrificing quality [78]. For researchers and drug development professionals, adopting this integrated approach means moving away from "compliance for the sake of compliance" and toward a more meaningful, scientifically grounded assurance process. This not only reduces unnecessary costs and time to market but also provides greater confidence that validation efforts are squarely focused on what matters most: safeguarding patient safety and ensuring product quality [75] [76] [77].
The Blueprint for Comparative Validation: Proving Equivalence to Reference Methods
Designing a Statistically Sound Comparative Study Protocol
In the field of analytical science, the validation of new rapid methodologies against established reference techniques is a critical component of methodological research. This process ensures that novel methods are not only faster and more efficient but also reliably accurate and precise enough for their intended use, particularly in high-stakes fields like pharmaceutical development [79]. A statistically sound comparative study protocol provides the framework for this validation, offering a structured approach to collect and analyze data that can objectively demonstrate performance and identify limitations.
The core objective of such a protocol is to generate robust, quantitative evidence that a proposed rapid method is fit-for-purpose. This requires careful planning of the experimental design, a clear definition of the analytical outcomes to be measured, and appropriate statistical analysis to support any claims of equivalence or superiority. This guide outlines the key components for designing these studies, with a focus on objective comparison and data integrity.
Key Experimental Protocols for Method Comparison
The foundation of a valid comparison lies in the execution of standardized, reproducible experiments. The following protocols are essential for evaluating a rapid method against a reference technique.
Protocol for Precision and Repeatability Assessment
This protocol evaluates the internal consistency of both the rapid and reference methods.
- Objective: To determine the closeness of agreement between a series of measurements obtained from multiple sampling of the same homogeneous sample under the prescribed conditions [79].
- Procedure:
- Prepare a single, large, homogeneous sample of the analyte at a concentration relevant to the method's intended use.
- Using the rapid method, analyze a minimum of five (n=5) replicate aliquots of this sample in a single run by a single analyst (repeatability).
- Repeat step 2 on three different days (intermediate precision).
- Perform the same replicate analysis (steps 2-3) using the reference method.
- Record all quantitative results for statistical analysis.
- Key Data Output: Mean, standard deviation, and coefficient of variation (CV%) for each method under repeatability and intermediate precision conditions.
Protocol for Accuracy and Recovery Evaluation
This protocol assesses the systematic error of the rapid method by comparing its results to a known reference value.
- Objective: To establish the closeness of agreement between the value found by the rapid method and an accepted reference value or that obtained by the reference method [80].
- Procedure:
- Prepare samples of a blank matrix (e.g., plasma, buffer).
- Spike the matrix with known concentrations of the analyte across the dynamic range (e.g., low, mid, and high levels).
- Analyze each spiked sample using both the rapid method and the reference method.
- For the rapid method, calculate the percentage recovery for each level using the formula:
(Measured Concentration / Spiked Concentration) * 100. - Compare the results from the rapid method directly to those obtained from the reference method for the same samples.
- Key Data Output: Mean percentage recovery at each level and a statistical comparison (e.g., t-test) of the results from the two methods.
Protocol for Sample Preparation Efficiency
This protocol is critical when the rapid method involves a novel sample preparation step, such as the removal of interferents.
- Objective: To compare the efficiency, speed, and simplicity of sample preparation techniques [80].
- Procedure:
- Starting with the same source of whole blood or complex sample, split it into multiple aliquots.
- Apply the different sample preparation methods (e.g., the novel rapid method vs. standard centrifugation).
- Record the time required to complete sample preparation for each method.
- Quantify the efficiency of the process by measuring a key interferent in the resulting plasma. For example, after RBC removal, measure the residual hemoglobin concentration using a commercial assay kit [80].
- Assess the recovery of the target biomarker by spiking the sample before preparation and measuring the concentration after preparation.
- Key Data Output: Preparation time, residual interferent concentration (e.g., Hb µg/mL), and biomarker recovery.
Data Presentation and Statistical Analysis
Quantitative data from comparative studies must be presented clearly and concisely to facilitate objective evaluation.
Structured tables are the most effective way to present summary statistics for easy comparison between methods [81].
Table 1: Comparative Precision Data for Rapid Immunoassay vs. Reference HPLC Method
| Analyte | Method | Spiked Concentration (ng/mL) | Mean Found (ng/mL) | Standard Deviation | CV% |
|---|---|---|---|---|---|
| Protein XYZ | Rapid Assay | 10.0 | 10.2 | 0.45 | 4.4 |
| Reference HPLC | 10.0 | 9.9 | 0.38 | 3.8 | |
| Protein XYZ | Rapid Assay | 100.0 | 98.5 | 3.50 | 3.6 |
| Reference HPLC | 100.0 | 101.2 | 3.10 | 3.1 |
Table 2: Comparison of Sample Preparation Methods for Plasma Separation
| Method | Time (min) | Residual Hb (µg/mL) | Biomarker Recovery (%) | Required Equipment |
|---|---|---|---|---|
| Centrifugation (Reference) | 5 | 15 | 99% | Refrigerated Microcentrifuge [80] |
| Antibody Agglutination | 5 | 20 | 98% | None [80] |
| Lectin Agglutination | 5 | 25 | 95% | None [80] |
| Glass Fiber Filtration | 10 | 50 | 90% | Laser-cut strips [80] |
Statistical Considerations for Data Analysis
The statistical analysis plan should be defined a priori to avoid bias. Key elements include:
- Hypothesis Testing: Formulate clear null and alternative hypotheses. For instance, the null hypothesis (H₀) might be that there is no significant difference between the means of the two methods [81].
- Appropriate Statistical Tests: Use paired t-tests to compare results from the same samples analyzed by two different methods. Use analysis of variance (ANOVA) for comparing more than two groups or conditions [79].
- Experimental Design for Robustness: Employ screening designs, such as the Plackett-Burman design, during method optimization to identify critical factors that significantly affect the results, thereby enhancing the method's long-term robustness [79].
- Analysis of Sources of Variation: Statistically decompose the total variation in your data into its constituent sources (e.g., between-day, between-operator, between-instrument) to understand the main contributors to uncertainty [79].
Visualizing the Experimental Workflow
A well-defined workflow is crucial for the reproducibility of a comparative study. The following diagram outlines the key stages in a statistically sound protocol.
Experimental Workflow for a Comparative Study
The Scientist's Toolkit: Essential Research Reagents and Materials
The following table details key reagents and materials commonly used in comparative studies for biomarker analysis, explaining their critical function in the experimental process.
Table 3: Essential Research Reagent Solutions for Biomarker Method Validation
| Item | Function / Rationale |
|---|---|
| Anti-RBC Monoclonal Antibody | An immunoglobulin M (IgM) antibody directed against RBC surface proteins; used in rapid agglutination methods to efficiently separate red blood cells from whole blood for plasma analysis [80]. |
| Plant Lectins (e.g., S. tuberosum) | Plant-derived proteins that bind to specific carbohydrates on red blood cell membranes, causing agglutination; provide an alternative, equipment-free method for RBC removal from small blood volumes [80]. |
| Glass Fiber Paper Strips | Used for passive lateral filtration of whole blood to separate plasma from cells; a key component in some rapid, equipment-free sample preparation workflows [80]. |
| Recombinant Protein Standards | Purified, well-characterized proteins (e.g., Procalcitonin, PSA) used to spike samples for accuracy and recovery experiments; essential for quantifying biomarker recovery after sample preparation [80]. |
| Hemoglobin Assay Kit | A commercial colorimetric or enzymatic assay used to quantify residual hemoglobin in processed plasma; a critical metric for evaluating the efficiency of RBC removal methods [80]. |
| Reference Method Kit (e.g., VIDAS) | A standardized, commercial kit for a specific biomarker used on an automated platform (e.g., VIDAS); serves as the validated reference method against which the rapid alternative is compared [80]. |
Validation Framework and Decision Pathway
The final phase of the protocol involves interpreting the collected data against pre-defined validation criteria to make a objective decision about the rapid method's performance.
Method Validation Decision Pathway
In the scientific validation of rapid methods, particularly within pharmaceutical and diagnostic development, establishing robust acceptance criteria is a critical gatekeeper for quality and compliance. Acceptance criteria are a set of predetermined conditions that must be met to demonstrate that an analytical method is fit for its intended purpose [82] [6]. For researchers and scientists comparing a new rapid method against a reference technique, correlation and agreement metrics form the statistical backbone of these criteria. They provide an objective, quantitative measure to confirm that the rapid method delivers results equivalent or superior to the compendial method, ensuring that gains in speed do not come at the cost of accuracy [6] [83]. This guide objectively compares the performance of different rapid microbiological methods and quantitative test kits against their reference counterparts, providing a framework for establishing scientifically defensible acceptance criteria based on experimental data.
Core Concepts: Correlation vs. Agreement
Before delving into specific metrics, it is crucial to distinguish between correlation and agreement, as they answer different scientific questions.
- Correlation assesses whether a change in one method is associated with a change in another. It measures the strength and direction of a linear relationship but does not indicate whether the two methods produce the same value. A high correlation can exist even if one method consistently yields values twice as high as the other.
- Agreement determines whether two methods produce interchangeable results by quantifying how close the measurements are to each other. Metrics for agreement are often more relevant for validation studies, as they directly assess the bias and expected differences between a new rapid method and an established reference method [83].
The following diagram illustrates the decision pathway for selecting and interpreting these key metrics within a validation workflow.
Diagram 1: A workflow for statistical validation of a rapid method against a reference method, highlighting the parallel assessment of correlation and agreement metrics.
Quantitative Comparison of Validation Metrics
Validation studies rely on a core set of performance parameters, each with associated acceptance criteria. The table below summarizes key quantitative metrics, their definitions, and typical acceptance targets based on regulatory guidelines and published comparative studies [6] [83].
Table 1: Key Validation Parameters and Acceptance Metrics
| Parameter | Definition | Common Acceptance Criteria | Application in Comparative Studies |
|---|---|---|---|
| Accuracy/Recovery | Closeness of agreement between the rapid method result and the reference value [6]. | Recovery of 70-130% for microbiological counts; often tighter for specific chemistries [6]. | Assessed by spiking samples with known analyte concentrations and comparing measured vs. expected values. |
| Precision | The degree of scatter between repeated measurements under specified conditions. Includes repeatability and intermediate precision [6]. | Coefficient of Variation (CV) < 10-35% depending on method type and analyte level [6] [83]. | Calculated from multiple replicates (e.g., n=10) of samples at low, mid, and high concentration levels. |
| Linearity & Range | The ability of the method to produce results directly proportional to analyte concentration within a given range [6]. | R² ≥ 0.98 across the specified analytical range [6]. | Established by analyzing a series of standard solutions across the claimed working range. |
| Limit of Detection (LOD) | The lowest amount of analyte that can be detected, but not necessarily quantified [6]. | Signal-to-Noise ratio ≥ 3:1 or based on standard deviation of the blank [6]. | Determined by measuring blank samples and low-level standards. Critical for contaminant detection methods. |
| Limit of Quantification (LOQ) | The lowest amount of analyte that can be quantitatively determined with acceptable precision and accuracy [6]. | Signal-to-Noise ratio ≥ 10:1; must meet precision (CV) and accuracy (Recovery) criteria at this level [6]. | Confirmed by analyzing multiple replicates at the proposed LOQ and calculating CV and Recovery. |
Experimental Protocols for Comparative Validation
A robust validation protocol is essential for generating reliable comparison data. The following section outlines established methodologies cited in validation research.
Protocol for Parallel Testing and Equivalency
This protocol is designed to demonstrate that a Rapid Microbiological Method (RMM) or quantitative test kit is equivalent to a compendial reference method.
- Step 1: Define Purpose and Scope. Clearly specify the sample type, target analyte, detection limit, and the purpose of the testing (e.g., product release, environmental monitoring) [6].
- Step 2: Conduct Parallel Testing. A sufficient number of samples (e.g., n=59 as in one salt iodine study) are analyzed simultaneously using both the rapid method and the reference method [83]. This should cover the entire analytical range.
- Step 3: Statistical Comparison for Equivalency. Results are compared using pre-defined statistical tests. Parameters such as accuracy, specificity, sensitivity, and linearity are evaluated [6]. For quantitative data, Bland-Altman analysis (to assess bias and limits of agreement) and regression analysis (to check for constant and proportional bias) are standard [83].
- Step 4: Assess Matrix Interference. The product matrix (e.g., gels, creams) can inhibit detection. Validation must include testing where the product is spiked with known amounts of the analyte to ensure accurate recovery without interference [6].
Protocol for Assessing Precision and Robustness
This protocol evaluates the reproducibility of the rapid method and its resilience to minor procedural changes.
- Step 1: Intra-Assay Imprecision. A single operator tests multiple replicates (e.g., n=10) of the same sample at different concentrations in a single session. The Coefficient of Variation (CV) is calculated for each level [83].
- Step 2: Inter-Assay Imprecision. One operator analyzes the same samples over multiple days (e.g., 3-5 days) to assess day-to-day variability [83].
- Step 3: Inter-Operator Imprecision. Multiple technicians (e.g., three) analyze the same set of samples to ensure the method is not operator-dependent. This can be conducted in both laboratory and field settings [83].
- Step 4: Robustness Testing. Deliberate, small variations in method conditions (e.g., temperature, reagent concentration, incubation time) are introduced to evaluate the method's reliability [6].
The following diagram maps the key stages of a comprehensive comparative validation study, from preparation to data-driven decision-making.
Diagram 2: The key phases and stages in a comprehensive comparative validation study, from initial design to final reporting.
Case Study: Quantitative Rapid Test Kits for Salt Iodine
A published study offers a clear example of a comparative validation. The research evaluated five quantitative rapid test kits (quantRTKs) for analyzing salt iodine content against the reference method, iodometric titration [83].
Experimental Design:
- Samples: 59 salt samples from different countries were analyzed in duplicate by each quantRTK and the reference method [83].
- Metrics for Comparison: The study assessed accuracy (by calculating percent error), precision (by measuring intra- and inter-assay Coefficient of Variation (CV)), and linearity [83].
- User-Friendliness: Beyond pure analytics, the study rated logistical parameters like cost, handling of hazardous reagents, and waste management on a scale of 0-5 [83].
Key Findings: The results, summarized in the table below, showed significant performance variation between the different test kits, highlighting the importance of rigorous comparative validation before adopting a new method.
Table 2: Comparative Performance Data from Salt Iodine Test Kit Validation [83]
| Device Performance Aspect | Kit A | Kit B | Kit C | Kit D | Kit E |
|---|---|---|---|---|---|
| Analytical Performance Score (0-10) | 8 | 6 | 9 | 4 | 7 |
| Intra-Assay CV at ~15 mg/kg (%) | <5% | ~8% | <5% | >15% | ~7% |
| Inter-Operator CV (%) | Low | Moderate | Low | High | Moderate |
| System Recovery (%) | 95-105% | 90-110% | 97-103% | 85-115% | 92-108% |
| User-Friendliness Score (0-5) | 4 | 3 | 5 | 2 | 4 |
The Scientist's Toolkit: Essential Reagents and Materials
A successful validation study requires carefully selected materials. The following table lists key solutions and reagents commonly used in comparative validation experiments for rapid methods.
Table 3: Essential Research Reagent Solutions for Validation Studies
| Item | Function in Validation | Example from Case Study |
|---|---|---|
| Standard Solutions | Used to establish calibration curves, assess linearity, and determine accuracy (recovery) [6]. | Saline solutions with known KIO3 concentrations (0-21 mg/L) were used to test linearity and recovery of iodine test kits [83]. |
| Spiked Matrix Samples | Used to assess the impact of the product matrix on the method's ability to recover the analyte, testing for interference [6]. | High-quality fine salt and lower-quality coarse salt were spiked with known iodine levels to test system recovery across different sample types [83]. |
| Reference Materials/Controls | Certified reference materials or samples with known analyte concentration provide an objective benchmark for assessing method accuracy [6]. | Non-iodized salt was iodized to precise levels (15.0, 29.6, 59.1 mg/kg) and confirmed by titration for use in precision studies [83]. |
| Hazardous Reagents | Some methods require oxidizing agents or acids for sample preparation; their safe handling and disposal are part of the validation assessment [83]. | The use of bromine water and formic acid for sample oxidation was noted as a logistical and safety consideration in the iodine kit study [83]. |
In the pharmaceutical industry, the validation of rapid microbiological methods (RMMs) against traditional compendial methods provides a critical pathway toward modernized quality control. Concurrent evaluation, where both methods are run in parallel on identical samples, serves as the foundational approach for demonstrating equivalency as mandated by regulatory guidelines such as USP <1223> and Ph. Eur. 5.1.6 [6]. This guide objectively compares the performance of established rapid methods against reference techniques, drawing on experimental data to highlight the operational and analytical advantages of RMMs while underscoring the rigorous validation requirements necessary for regulatory compliance.
The adoption of Rapid Microbiological Methods (RMMs) represents a significant shift from traditional, culture-based techniques that can require days to weeks to produce results [6]. Unlike these compendial methods, RMMs can provide faster, sometimes real-time, detection and quantification of microorganisms. However, prior to implementation for product release decisions, regulatory agencies like the FDA require thorough validation to ensure that these new methods are accurate, reliable, and comparable to the compendial standards [6]. Concurrent evaluation is a core component of this validation, providing the direct, head-to-head comparative data needed to demonstrate that the rapid method is fit for its intended purpose.
Theoretical Framework: Regulatory and Scientific Principles
Regulatory Foundation: USP <1223> and Ph. Eur. 5.1.6
The validation of RMMs is structurally guided by two principal compendia: the United States Pharmacopeia (USP) General Chapter <1223> and the European Pharmacopoeia (Ph. Eur.) Chapter 5.1.6 [6]. These documents provide a structured framework for validation, emphasizing the need to demonstrate equivalency between the new method and the traditional reference method. The process requires a deliberate, well-documented comparison to prove that the RMM is at least as accurate, precise, and sensitive as the method it is intended to replace.
The Imperative for Concurrent Evaluation
The fundamental goal of a concurrent study is to balance innovation with patient safety. While RMMs offer clear advantages in speed and potential automation, the compendial methods have a long-established history of ensuring product safety [3] [6]. Running both methods in parallel on the same set of samples from the same source allows for a direct, statistically relevant comparison of their outputs. This approach bridges the gap between innovative technology and regulatory compliance, building a robust data set that proves the RMM does not compromise product quality or patient safety [6].
Experimental Comparison: ATP Bioluminescence vs. Compendial Plate Count
A detailed case study evaluating an ATP bioluminescence-based rapid method (the Pallchek Rapid Microbiology System) against the compendial heterotrophic plate count method illustrates the standard protocol for a concurrent evaluation [3].
Compendial Reference Method Workflow
The reference method against which the RMM was evaluated follows a well-established protocol [3]:
- Sample Collection: Water samples are collected from specified points in the pharmaceutical water system.
- Filtration: Samples are filtered through 0.45µm membranes to capture microorganisms.
- Plating: The membranes are plated in duplicate onto R2A agar.
- Incubation: Plates are incubated for 5 days at 30°C.
- Analysis: After incubation, developed colonies are counted manually, and the count is compared against predefined alert and action limits for the water system.
Rapid Method Workflow: ATP Bioluminescence
The evaluated RMM utilizes adenosine triphosphate (ATP) bioluminescence technology, which can be deployed in two primary ways [3]:
- Direct Measurement: The sample is filtered, and the membrane is immediately analyzed with reagents. The extractant lyses microbial cells to release intracellular ATP, which then reacts with a luciferin-luciferase enzyme reagent to produce light. The emitted photons, measured as Relative Light Units (RLU) by a luminometer, are proportional to the amount of ATP present. This method provides results in about one minute but has a higher limit of detection (approximately 100-1000 cfu).
- Indirect Measurement: The filtered sample is placed into a liquid culture medium and incubated overnight. A portion of the medium is then analyzed via ATP bioluminescence. This enrichment step allows for the detection of very low levels of contamination (down to 1 cfu) and provides results within 24 hours.
The following workflow diagram illustrates the parallel paths of the compendial and rapid methods in a concurrent evaluation study.
Key Validation Parameters and Comparative Data
As per regulatory guidelines, the comparison of the two methods involves assessing several key validation parameters [3] [6]. The data from the case study can be summarized in the following comparative table:
Table 1: Quantitative Comparison of Compendial and ATP Bioluminescence Methods
| Validation Parameter | Compendial Plate Count | ATP Bioluminescence (Rapid Method) | Experimental Results & Observations |
|---|---|---|---|
| Time-to-Result (TTR) | 5 days [3] | Direct: ~1 minIndirect: 24 hours [3] | The rapid method provides a significant reduction in TTR, enabling faster decision-making. |
| Limit of Detection (LOD) | Standard protocols define LOD | Direct: ~100-1000 cfuIndirect: ~1 cfu [3] | The indirect method offers a superior LOD comparable to the compendial method. |
| Quantitative Output | Colony-Forming Units (CFU) | Relative Light Units (RLU) [3] | A correlation curve between RLU and CFU is required for quantitative interpretation [3]. |
| Correlation with CFU | Reference Method | R² > 0.95 achieved with standard microorganisms [3] | Demonstrates a strong, predictable relationship between the rapid method signal and viable count. |
| Precision (Repeatability) | Established method precision | System suitability tests passed (Background < 20 RLU, Reagent background < 80 RLU) [3] | The rapid method showed consistent, low background signals, supporting result reproducibility. |
| Key Advantage | Well-understood, compendial | Speed, potential for automation, detects viable but non-culturable organisms [3] | Rapid methods address the critical delay of OOS results with compendial methods [3]. |
| Key Limitation | Long incubation period (5 days) [3] | Direct method has high LOD; RLU signal can vary with organism and metabolic state [3] | The delay with compendial methods can underestimate contamination levels [3]. |
Essential Reagents and Research Tools
The successful execution of a concurrent evaluation study requires specific, high-quality reagents and systems. The following table details key materials used in the featured ATP bioluminescence study and their critical functions [3].
Table 2: Research Reagent Solutions for Concurrent Evaluation
| Item | Function in the Experiment |
|---|---|
| Pallchek Rapid Microbiology System | An integrated system including a handheld luminometer, vacuum pump, and aluminum test plate for detecting microbial contamination via ATP bioluminescence [3]. |
| ATP Bioluminescence Reagent | A luciferin-luciferase enzyme mixture extracted from fireflies. Reacts with ATP to produce light, which is quantified as Relative Light Units (RLU) [3]. |
| Extractant/ Lysing Reagent | A chemical formulation designed to lyse microbial cells present in a sample, releasing intracellular ATP for subsequent detection [3]. |
| ATP Standard Solution | A solution of known ATP concentration used for system suitability tests, confirming reagent performance, and generating the ATP correlation curve [3]. |
| R2A Agar | A low-nutrient culture medium used in the compendial method for the incubation of water system samples to promote the growth of stressed microorganisms [3]. |
| Microbial Reference Strains | Pre-quantified, ready-to-use reference microorganisms (e.g., E. coli, S. aureus) used for correlation studies between RLU and CFU and for determining LOD/LOQ [3] [84]. |
| 0.45µm Membranes | Filters used to concentrate microorganisms from large-volume water samples, making them available for both the compendial plating and the rapid method analysis [3]. |
Interpretation of Comparative Data
The data from the concurrent evaluation clearly demonstrates the transformative potential of RMMs. The most significant advantage is the dramatic reduction in Time-to-Result from 5 days to either 24 hours or nearly real-time, depending on the rapid method used [3]. This directly addresses a major flaw in traditional microbiology: the delay between sampling and obtaining an Out-of-Specification (OOS) result, which can lead to underestimation of contamination and delayed corrective actions [3]. Furthermore, the ability of the indirect ATP method to detect a single CFU demonstrates that speed does not come at the cost of sensitivity.
The requirement for a correlation curve between RLU and CFU underscores an important distinction between the methods. While the compendial method provides a direct count, the RMM signal (RLU) is a proxy for total microbial biomass (via ATP content) and must be correlated to the traditional CFU count to be understood in the existing regulatory framework [3].
Strategic Implications for Drug Development
The adoption of validated RMMs extends beyond quality control efficiency. In the broader context of drug discovery and development, where bringing a new product to market is a complex, 12-15 year journey, any opportunity to accelerate timelines without compromising quality is critical [85]. Faster microbial quality control results can streamline manufacturing processes, reduce inventory holding times, and ultimately get medicines to patients faster. Moreover, the integration of modern tools like precisely quantified reference standards (e.g., ATCC MicroQuant) and automated systems (e.g., Growth Direct System) is setting a new industry standard for microbial QC, reducing human error and variability in validation and routine testing [84].
Concurrent evaluation remains the gold-standard approach for validating rapid microbiological methods. The objective comparison of data, as exemplified by the ATP bioluminescence case study, provides the undeniable evidence required by regulators and internal quality units to approve a method change. When validated properly according to USP <1223> and Ph. Eur. 5.1.6, RMMs offer a powerful pathway to modernizing pharmaceutical quality control, enhancing manufacturing efficiency, and strengthening the overall contamination control strategy, all while maintaining the highest commitment to product quality and patient safety [6].
The validation of rapid analytical methods against established reference techniques is a critical process in pharmaceutical development and other regulated industries. This process ensures that new, efficient methods provide reliable, accurate, and precise data comparable to traditional methods. Method validation is a comprehensive, documented process that proves an analytical method is acceptable for its intended use, typically required when developing new methods or transferring methods between labs [8]. In contrast, method verification confirms that a previously validated method performs as expected in a specific laboratory setting, which is less exhaustive but still essential for quality assurance [8]. The fundamental principles of accuracy and precision underpin all comparative method validation. Accuracy describes how close a measured value is to the true or accepted value, while precision measures how close repeated measurements are to each other, regardless of whether they are correct [14] [86].
The pharmaceutical industry has increasingly embraced rapid microbiological methods (RMMs) as alternatives to traditional compendial methods, though implementation has progressed gradually [87]. Regulatory authorities now generally accept properly validated RMMs, with success stories including applications for sterility testing, water purification systems, and in-process monitoring [87]. This guide examines the statistical tools, experimental protocols, and interpretation frameworks essential for robust comparative method validation.
Key Statistical Tools for Method Comparison
Fundamental Statistical Tests and Measures
Statistical analysis provides the objective foundation for determining method equivalency. The choice of statistical tools depends on the data type (qualitative vs. quantitative), distribution characteristics, and the specific validation parameters being assessed.
Table 1: Essential Statistical Tools for Method Comparison
| Statistical Tool | Application in Method Validation | Interpretation Guidelines |
|---|---|---|
| Pearson Correlation Coefficient (PCC) | Measures linear relationship between two methods [88] | Values closer to ±1 indicate stronger linear relationships |
| Simple Linear Regression (SLR) | Models relationship between reference and rapid method results [88] | R² statistic indicates proportion of variance explained |
| Multiple Linear Regression (MLR) | Models relationship between multiple DMs and combinations of RMs [88] | Adjusted R² accounts for number of predictors |
| Confirmatory Factor Analysis (CFA) | Assesses relationship between novel measures and reference standards [88] | Factor correlations indicate construct validity |
| Standard Deviation/Variance | Quantifies precision and random error [13] [86] | Lower values indicate higher precision |
| Sensitivity & Specificity | For qualitative method validation [89] | High values indicate accurate detection of true positives/negatives |
| McNemar's Chi-Square | Assesses method agreement in qualitative tests [59] | Statistical significance indicates systematic differences |
Advanced and Emerging Statistical Approaches
For novel digital measures where traditional reference standards may not exist, advanced statistical approaches are particularly valuable. Confirmatory factor analysis (CFA) has demonstrated strong performance in estimating relationships between digital measures and clinical outcome assessments, especially in studies with strong temporal and construct coherence [88]. The V3+ framework provides a robust, modular approach for evaluating measures generated from sensor-based digital health technologies, bridging initial technology development and clinical utility [88].
In microbiological method validation, equivalence testing often follows guidelines outlined in Ph Eur Chapter 5.1.6 or PDA Technical Report No. 33, which provide frameworks for demonstrating that rapid methods perform equivalently to compendial methods [87]. For multiclass classification problems in machine learning applications, accuracy must be generalized to account for multiple classes, while multilabel classification requires specialized metrics like the Hamming Score or Hamming Loss that don't depend on exact matches or naively consider true negatives as correct [89].
Experimental Design and Protocols
Validation Study Design Considerations
Robust experimental design is paramount for meaningful method comparison. The design must account for key study properties that influence the ability to detect true relationships between methods:
- Temporal coherence: The similarity between periods of data collection for the measures being compared [88]
- Construct coherence: The similarity between the theoretical underlying constructs being assessed by different measures [88]
- Data completeness: The level of completeness in both the rapid method and reference method data [88]
The AOAC International validation programs provide well-established frameworks for method validation studies. For qualitative methods, pre-collaborative studies typically require 20 replicates at each inoculation level plus 5 uninoculated controls, or 20 replicates of naturally contaminated samples [59]. Collaborative studies require 6 replicates at each inoculation level and 6 uninoculated controls per laboratory [59]. For quantitative methods, validation requires five replicates at each of three inoculated levels and five uninoculated controls, or three lots of naturally contaminated materials [59].
Key Validation Parameters and Protocols
Table 2: Core Validation Parameters and Experimental Protocols
| Validation Parameter | Experimental Protocol | Acceptance Criteria |
|---|---|---|
| Accuracy | Comparison of measured values to known standards or reference method results [8] [86] | Closeness to the true value; minimal systematic error [14] |
| Precision | Multiple measurements of homogeneous samples under specified conditions [8] [86] | Low variability between repeated measurements (random error) [14] |
| Specificity | Ability to measure analyte accurately in presence of interferents [8] | No significant interference from expected matrix components |
| Limit of Detection (LOD) | Determine lowest analyte concentration reliably detected [8] | Signal-to-noise ratio typically 3:1 |
| Limit of Quantitation (LOQ) | Determine lowest analyte concentration reliably quantified [8] | Signal-to-noise ratio typically 10:1 with specified precision/accuracy |
| Linearity | Measure responses across specified range of analyte concentrations [8] | Correlation coefficient >0.99 typically required |
| Robustness | Deliberate variations in method parameters to measure resilience [8] | Method performance remains within specified limits |
The experimental workflow for method validation follows a logical progression from planning through execution to data interpretation and regulatory submission, as illustrated below:
Method Validation Workflow: This diagram illustrates the sequential process for validating rapid analytical methods against reference standards.
Data Interpretation and Regulatory Considerations
Interpreting Statistical Results
Proper interpretation of statistical outcomes is crucial for determining method equivalency. The accuracy paradox presents a common challenge where high overall accuracy can be misleading, particularly with imbalanced datasets where correctly predicting the minority class is critical [89]. For instance, a model achieving 94.64% overall accuracy might misdiagnose almost all malignant cases in a medical testing scenario, demonstrating why multiple performance metrics are essential [89].
When comparing methods that produce fundamentally different signals, such as colony-forming units (CFUs) versus molecular detection signals, interpretation requires special consideration. Some non-CFU-based RMMs may detect and quantify viable cells that conventional methods miss, which doesn't necessarily indicate failure to meet acceptance criteria but may require thoughtful consideration of specification alignment [87]. Statistical equivalency is typically demonstrated when the rapid method shows comparable or superior performance across key validation parameters with demonstrated statistical power.
Regulatory Frameworks and Submission Strategies
Regulatory acceptance of rapid methods has improved significantly, though strategic approaches to submission can facilitate smoother approvals. The EMA's Scientific Advice procedure and Post Approval Change Management Protocol, along with the FDA's Comparability Protocol, provide pathways for pre-approval of validation plans, potentially streamlining the acceptance process [87]. Engaging regulators early in the validation planning process is widely recommended.
Regulatory perspectives may vary between agencies, with some authorities potentially requiring more extensive data than others [87]. Additionally, a distinction may exist between reviewers (who may be more familiar with validation data) and inspectors (who may have less direct exposure to RMMs), highlighting the value of involving local inspectors early in the validation and implementation process [87]. For compendial methods, verification rather than full validation is generally acceptable, as labs confirm that standardized methods function correctly under local conditions [8].
Essential Research Reagents and Materials
Successful method validation requires specific materials and reagents tailored to the analytical technology and sample matrix. The selection of appropriate reference materials is critical for meaningful comparison studies.
Table 3: Key Research Reagent Solutions for Method Validation
| Reagent/Material | Function in Validation Studies | Application Examples |
|---|---|---|
| Certified Reference Materials | Provide known values for accuracy determination [86] | Pharmaceutical standards, certified analyte concentrations |
| Quality Control Samples | Monitor precision and reproducibility over time [86] | Commercially available QC materials, in-house preparations |
| Selective Culture Media | Support microbiological method comparisons [59] | Salmonella selective media, chromogenic agars for pathogen detection |
| Molecular Detection Kits | Enable nucleic acid amplification comparisons [87] [59] | PCR kits for pathogen detection, mycoplasma testing assays |
| Sample Panels | Assess method performance across diverse matrices [59] | Inclusivity/exclusivity panels, naturally contaminated samples |
| Calibration Standards | Establish quantitative relationship between signal and concentration [8] | Certified standard solutions, instrument calibration kits |
The validation of rapid analytical methods against established reference techniques requires meticulous experimental design, appropriate statistical analysis, and thoughtful interpretation within regulatory frameworks. The statistical toolkit for method comparison encompasses both traditional approaches like correlation analysis and regression, as well as emerging methods like confirmatory factor analysis for novel digital measures. Successful validation demonstrates that rapid methods provide equivalent or superior performance compared to reference methods while offering advantages in speed, efficiency, or detection capability. As technological advances continue to produce novel analytical platforms, the principles of robust validation remain constant—ensuring that data generated by new methods reliably supports scientific and regulatory decision-making in pharmaceutical development and other critical applications.
Documentation and Reporting for Regulatory Submission and Audit Readiness
In the development of pharmaceuticals and diagnostic tests, the pathway from research to market approval is paved with rigorous regulatory requirements. The cornerstone of this journey is a robust validation process that objectively demonstrates a method's reliability and fitness for its intended purpose. Method validation serves as documented evidence that an analytical test system is acceptable for its intended use and capable of providing useful and valid analytical data [90] [91]. For researchers, scientists, and drug development professionals, understanding the distinction between method validation—proving a method is fit for purpose during development—and method verification—confirming a previously validated method performs as expected in a specific laboratory—is fundamental to regulatory success [8]. This guide provides a structured framework for comparing rapid methods against reference techniques, with emphasis on documentation strategies that ensure audit readiness and facilitate successful regulatory submissions.
Validation Frameworks and Regulatory Guidelines
Core Validation Principles and Terminology
Adherence to established validation frameworks is non-negotiable in regulated environments. The International Conference on Harmonization (ICH) guidelines outline key performance characteristics that constitute a comprehensive validation protocol [91] [92]. Similarly, ISO 16140 standards provide specific protocols for validating alternative microbiological methods against reference methods [19]. These guidelines harmonize the terminology and methodology required for global regulatory acceptance.
Fundamental Definitions:
- Method Validation: A comprehensive, documented process proving an analytical method is acceptable for its intended use, typically required during method development or significant modification [8] [91].
- Method Verification: The process of confirming that a previously validated method performs as expected under specific laboratory conditions, used when adopting standard methods in a new setting [19] [8].
- Specificity/Selectivity: The ability to measure the analyte accurately in the presence of potential interferences [90] [91].
- Accuracy: The closeness of agreement between test results and an accepted reference value [90] [91].
- Precision: The degree of agreement among individual test results from repeated analyses, typically measured as repeatability, intermediate precision, and reproducibility [91].
Comparative Validation Study Design
When comparing rapid methods to reference techniques, the study design must mirror real-world applications while controlling variables. AOAC International guidelines recommend a two-phase validation approach for microbiological methods: pre-collaborative studies (inclusivity, exclusivity, method comparison) followed by a full collaborative study involving multiple laboratories [59]. For chemical methods, the validation follows similar principles with specific protocols for parameters like linearity, range, LOD, LOQ, accuracy, and precision [91] [92].
The following workflow outlines the comprehensive experimental approach for comparative method validation:
Experimental Protocols for Comparative Method Validation
Sample Preparation and Study Design
Proper sample preparation is fundamental to validation study integrity. For pharmaceutical applications, samples should include drug substances, drug products, and synthetic mixtures spiked with known quantities of components [91]. For microbiological methods, AOAC guidelines recommend testing 15-20 foods across different categories, with 20 replicates at each inoculation level and 5 uninoculated controls for qualitative methods [59]. The sample size must be statistically justified; according to ICH guidelines, accuracy assessments should include "data from a minimum of nine determinations over a minimum of three concentration levels covering the specified range" [91].
Inclusion of Blind Controls: Incorporate blinded negative and positive controls to eliminate operator bias. For impurity testing, include samples spiked with known impurities at specification thresholds [91]. When comparing quantitative rapid test kits for salt iodine content, researchers used 59 salt samples from different countries analyzed in duplicate, providing sufficient data for robust statistical comparison [83].
Reference Method Selection and Method Comparison
The reference method must be well-characterized and legally recognized for determining compliance. The U.S. Food and Drug Administration designates specifications in the current United States Pharmacopeia (USP) as legally recognized when determining compliance with the Federal Food, Drug, and Cosmetic Act [91]. For comparative studies, the alternative rapid method and reference method should analyze identical sample sets under their respective standard operating conditions.
Experimental Execution: In a study comparing Near-Infrared Spectroscopy to classical reference methods for nutritional analysis, researchers analyzed burger and pizza samples using both techniques simultaneously [93]. Each burger sample was analyzed in triplicate by NIR, resulting in thirty spectra per burger type, while reference methods followed ISO-accredited protocols including Kjeldahl for protein and Soxhlet for lipid content [93]. This systematic approach ensured direct comparability between methods.
Data Collection and Statistical Analysis
Data collection must be comprehensive and traceable. For each analytical run, document all relevant metadata including instrument identification, analyst, date, reagents, and reference standard batches. For HPLC method validation, document system suitability testing results including retention time, theoretical plates, and tailing factor for the target analyte [92].
Statistical Treatment: Precision should be expressed as relative standard deviation (%RSD) across replicates [90] [91]. The Horwitz equation provides empirical acceptance criteria for precision based on analyte concentration: % RSDr = 2C^(-0.15), where C is the concentration expressed as a mass fraction [90]. For comparison studies, use appropriate statistical tests such as paired t-tests to evaluate differences between methods, with statistical significance typically set at p < 0.05 [93].
Key Performance Parameters and Acceptance Criteria
Quantitative Method Validation Parameters
For quantitative analytical methods, specific performance criteria must be established and verified through structured experimentation. The following table summarizes the core parameters, their definitions, and typical acceptance criteria for pharmaceutical applications:
| Parameter | Definition | Experimental Protocol | Acceptance Criteria |
|---|---|---|---|
| Accuracy | Closeness of agreement between accepted reference value and value found | Analysis of a minimum of 9 determinations over 3 concentration levels covering the specified range [91] | Recovery of 98-102% for drug substance; 98-102% for drug product [91] |
| Precision | Closeness of agreement between individual test results when procedure applied repeatedly to multiple samplings | Repeatability: 9 determinations covering specified range or 6 determinations at 100% [91] | RSD ≤ 1% for assay of drug substance; RSD ≤ 2% for assay of drug product [91] |
| Specificity | Ability to measure analyte accurately in presence of components that may be expected to be present | Resolution of two most closely eluted compounds; peak purity tests using PDA or MS detection [91] | Resolution ≥ 2.0 between critical pair; peak purity index ≥ 990 [91] |
| Linearity | Ability to obtain test results proportional to analyte concentration within given range | Minimum of 5 concentration levels; statistical analysis using linear regression with least squares [90] [91] | Correlation coefficient (r²) ≥ 0.999 [92] |
| Range | Interval between upper and lower concentration with demonstrated precision, accuracy, and linearity | Established based on linearity results; minimum ranges: assay: 80-120%; impurity tests: 50-120% to 0-120% [91] | Confirmed by acceptable results for accuracy, precision, and linearity throughout range [91] |
| LOD | Lowest concentration of analyte that can be detected | Based on signal-to-noise ratio (3:1) or formula: LOD = 3.3 × (SD of response/slope of calibration curve) [91] | Visual or statistical evaluation with specified confidence level [91] |
| LOQ | Lowest concentration of analyte that can be quantified with acceptable precision and accuracy | Based on signal-to-noise ratio (10:1) or formula: LOQ = 10 × (SD of response/slope of calibration curve) [91] | RSD < 5% and bias% within ±5% at LOQ level [92] |
| Robustness | Capacity of method to remain unaffected by small, deliberate variations in method parameters | Systematic variation of parameters (pH, temperature, mobile phase composition) in experimental design [91] | Consistent system suitability results and no significant impact on performance [91] |
Comparative Statistical Analysis Methods
When comparing rapid methods to reference techniques, specific statistical approaches strengthen the validity of equivalence claims:
Method Agreement Assessment: For qualitative methods, calculate sensitivity, specificity, false positive, and false negative rates [59]. For a validated HPLC method for Ga-68-DOTATATE analysis, researchers confirmed method precision with coefficients of variation between 0.22%-0.52% for intraday and 0.20%-0.61% for interday precision [92].
Statistical Testing: Use appropriate statistical tests to evaluate differences. In the NIR vs. reference methods study, paired sample t-tests were employed with statistical significance set at p < 0.05 [93]. For method comparison studies, Bland-Altman analysis with limits of agreement provides valuable information about method differences across concentration ranges [83].
Documentation Strategies for Audit Readiness
Essential Validation Documentation Components
Comprehensive documentation is the foundation of successful regulatory submissions and audit readiness. The validation package should include:
Protocol and Report Structure:
- Validation Protocol: Pre-approved document detailing objectives, methodology, acceptance criteria, and statistical analysis plan [91]
- Raw Data Records: Complete laboratory notebooks, chromatograms, spectra, and electronic data with audit trails [91]
- Validation Report: Comprehensive summary comparing results against acceptance criteria with scientific justification for any deviations [59] [91]
Data Integrity Measures: Implement ALCOA+ principles (Attributable, Legible, Contemporaneous, Original, Accurate) throughout data collection. For HPLC validation, include chromatograms demonstrating system suitability, specificity, and peak purity [91] [92].
The Scientist's Toolkit: Essential Research Reagent Solutions
Successful validation studies require specific reagents and materials meticulously documented for traceability. The following table outlines essential solutions and their functions in method validation:
| Reagent/Material | Function in Validation | Documentation Requirements | Quality Standards |
|---|---|---|---|
| Reference Standards | Quantification and method calibration | Certificate of Analysis with purity, expiration, storage conditions [92] | USP/EP/JP certified reference materials or qualified in-house standards [91] |
| Chromatographic Columns | Stationary phase for separation | Column specification (dimensions, particle size, pore size), lot number, expiration date [92] | Reputable manufacturer with consistent production quality [91] |
| Mobile Phase Components | Liquid phase for chromatographic separation | Composition, pH, preparation method, shelf-life validation [92] | HPLC-grade or better with documentation of impurities [91] |
| Sample Preparation Solvents | Extraction and dissolution of analytes | Grade, purity, supplier, lot number, expiration date [90] | Appropriate for intended use with demonstrated compatibility [90] |
| System Suitability Solutions | Verification of chromatographic system performance before analysis | Composition, acceptance criteria (retention time, theoretical plates, tailing factor) [91] | Stable, well-characterized mixture of key analytes [91] |
Regulatory Submission Framework
Preparing the Submission Package
Regulatory submissions require strategic organization of validation data to facilitate review. Structure the submission to align with regulatory agency expectations:
Common Technical Document (CTD) Format:
- Module 2.3: Quality Overall Summary - Include executive summary of validation results
- Module 3: Quality - Provide detailed validation reports, protocols, and raw data summaries [91]
- References: Cite appropriate pharmacopeial methods (USP, EP, JP) and ICH guidelines [91] [92]
Comparative Data Presentation: When submitting data for alternative methods, directly compare results against reference methods using statistical analyses. For the validation of the HPLC method for Ga-68-DOTATATE, researchers presented linearity data with a correlation coefficient (r²) of 0.999, precision with CV% <2%, and accuracy with bias% within ±5% for all concentrations [92].
Audit Preparation and Response Strategies
Proactive preparation is key to successful regulatory audits:
Pre-Audit Readiness Activities:
- Conduct internal audits against current regulatory standards
- Prepare validation data summaries with cross-references to raw data
- Train staff on validation protocols and potential audit questions [8]
During the Audit:
- Provide direct access to requested validation documents
- Demonstrate understanding of validation principles and acceptance criteria
- Scientifically justify any deviations from guidelines [8]
The relationship between validation, verification, and ongoing quality control is critical for maintaining regulatory compliance throughout a method's lifecycle, as illustrated in the following framework:
Strategic documentation and rigorous comparative validation form the foundation of successful regulatory submissions for rapid analytical methods. By implementing structured experimental protocols, establishing scientifically justified acceptance criteria, and maintaining comprehensive documentation, researchers can objectively demonstrate method performance while ensuring audit readiness. The framework presented in this guide emphasizes the importance of following established regulatory guidelines while providing sufficient experimental detail to support method equivalence claims. As regulatory landscapes evolve, maintaining this disciplined approach to validation documentation will continue to be essential for accelerating drug development while ensuring product quality and patient safety.
Conclusion
The successful validation of rapid methods against reference techniques is no longer a luxury but a necessity for accelerating drug discovery and ensuring product quality. This synthesis of foundational knowledge, methodological options, troubleshooting strategies, and a structured comparative framework empowers scientists to confidently implement these efficient technologies. The future of analytical methods in biopharma is inextricably linked to digital transformation, including the adoption of AI for predictive modeling, continuous validation practices, and automated data analytics. By embracing these trends, the industry can build more agile, data-driven, and reliable development pipelines, ultimately bringing safer and more effective therapies to patients faster.
References
- 1. General Chapters: <1225> VALIDATION OF COMPENDIAL METHODS [http://pharmacopeia.cn/v29240/usp29nf24s0_c1225.html]
- 2. A Guide to Validating RMMs Following USP | Veolia WTS [https://www.watertechnologies.com/sievers-resource-center/guide-to-validating-rmms]
- 3. Concurrent Evaluation of both Compendial and Rapid Methods ... [https://www.europeanpharmaceuticalreview.com/article/886/concurrent-evaluation-of-both-compendial-and-rapid-methods-atp-bioluminescence-for-monitoring-water-quality-in-pharmaceutical-manufacturing/]
- 4. Frontiers | Rapid GC-MS method for screening seized drugs in forensic investigations: optimization and validation [https://www.frontiersin.org/journals/chemistry/articles/10.3389/fchem.2025.1559279/full]
- 5. Reference materials and reference methods in clinical chemistry - PubMed [https://pubmed.ncbi.nlm.nih.gov/469466/]
- 6. Microbiological Validate for Pharma Compliance Rapid Methods [https://www.pharmanow.live/regulatory-landscape/validate-rapid-microbiological-methods]
- 7. Performance Characteristics In Analytical Method Validation [https://gmpinsiders.com/performance-characteristics-method-validation/]
- 8. vs Method Verification: Which is... | Lab Manager Validation Method [https://www.labmanager.com/method-validation-vs-method-verification-which-is-better-for-use-in-laboratories-33982]
- 9. Accuracy, Precision, and Reliability of Chemical Measurements in Natural Products Research - PMC [https://pmc.ncbi.nlm.nih.gov/articles/PMC3026088/]
- 10. Method validation and measurement uncertainty estimation of pesticide residues in Okra by GC/HPLC - PMC [https://pmc.ncbi.nlm.nih.gov/articles/PMC12425206/]
- 11. Performance Survey and Comparison Between Rapid Sterility Testing Method and Pharmacopoeia Sterility Test - PMC [https://pmc.ncbi.nlm.nih.gov/articles/PMC5816116/]
- 12. Accuracy and precision - Wikipedia [https://en.wikipedia.org/wiki/Accuracy_and_precision]
- 13. Precision vs Accuracy in Machining: Key Differences | RapidDirect [https://www.rapiddirect.com/blog/precision-vs-accuracy/]
- 14. Accuracy vs. Precision: What's the Difference? [2025] [https://asana.com/resources/accuracy-vs-precision]
- 15. Guide to ICH Q7, Q8, & Q9: GMP , QbD, and QRM... | IntuitionLabs [https://intuitionlabs.ai/articles/ich-q7-q8-q9-guide]
- 16. Rapid Microbiological Methods and the PAT Initiative | BioPharm International [https://www.biopharminternational.com/view/rapid-microbiological-methods-and-pat-initiative]
- 17. ( FDA ): Good Guide Manufacturing Practices GMP 2025 [https://pharmuni.com/2025/11/06/fda-good-manufacturing-practices-complete-year-guide-for-compliance-and-quality/]
- 18. "Pharma Guidelines 2025 : Updates from ICH , FDA , EMA..." | LinkedIn [https://www.linkedin.com/posts/emad-al-shorman-4b0545134_2025-a-year-of-major-updates-in-pharmaceutical-activity-7379565305632559104-Mrn_]
- 19. Method validation and method verification [https://committee.iso.org/sites/tc34sc9/home/essential-information/content-left-area/validation-of-methods/method-validation-and-method-ver.html]
- 20. Alternative and rapid micro methods (ARMM): A framework for the evaluation, validation and implementation of alternative and rapid microbiological testing methods [https://www.biophorum.com/download/alternative-and-rapid-micro-methods-armm-a-framework-for-the-evaluation-validation-and-implementation-of-alternative-and-rapid-microbiological-testing-methods/]
- 21. Evaluation of growth based rapid microbiological methods for sterility testing of vaccines and other biological products - PubMed [https://pubmed.ncbi.nlm.nih.gov/21871516/]
- 22. How to select and justify the right rapid microbiological methods [https://www.rssl.com/insights/life-science-pharmaceuticals/how-to-select-and-justify-the-right-rapid-microbiological-methods/]
- 23. , qPCR or RNA Sequencing - What to Choose? Microarrays [https://biosistemika.com/blog/qpcr-microarrays-rna-sequencing-choose-one/]
- 24. How Does qPCR Work? (Technology Basics) - BioSistemika [https://biosistemika.com/blog/qpcr-technology-basics/]
- 25. Frontiers | Comparative Evaluation of the LAMP Assay and... [https://www.frontiersin.org/journals/microbiology/articles/10.3389/fmicb.2018.02089/full]
- 26. Reproducibility of quantitative RT- PCR array in miRNA expression... [https://bmcgenomics.biomedcentral.com/articles/10.1186/1471-2164-10-407]
- 27. An optimized protocol for microarray by validation ... quantitative PCR [https://bmcgenomics.biomedcentral.com/articles/10.1186/1471-2164-11-542]
- 28. An optimized protocol for microarray by validation ... quantitative PCR [https://pubmed.ncbi.nlm.nih.gov/20929564/]
- 29. Considerations for Comparing Reagent Performance [https://www.news-medical.net/whitepaper/20180206/Real-Time-qPCR-Considerations-for-Comparing-Reagent-Performance.aspx]
- 30. Analysis of Comparative Market Biosensor : Technologies ... Optical [https://www.linkedin.com/pulse/comparative-analysis-biosensor-market-9tkcc]
- 31. , Electrochemical and optical - mass immunosensors... based [https://pubmed.ncbi.nlm.nih.gov/37343693/]
- 32. : are your Analytical ... | QbD Group Method Validation analytical [https://www.qbdgroup.com/en/blog/analytical-method-validation-are-your-methods-suitable-for-intended-use/]
- 33. A general method for the development of multicolor biosensors with large dynamic ranges | Nature Chemical Biology [https://www.nature.com/articles/s41589-023-01350-1]
- 34. Frontiers | Insights in Biosensors and Biomolecular Electronics 2024: Novel Developments, Current Challenges, and Future Perspectives [https://www.frontiersin.org/journals/bioengineering-and-biotechnology/articles/10.3389/fbioe.2025.1668411/abstract]
- 35. EIAs and ELISAs | Microbiology [https://courses.lumenlearning.com/suny-microbiology/chapter/eias-and-elisas/]
- 36. Optimization, Validation and Standardization of ELISA | IntechOpen [https://www.intechopen.com/chapters/74297]
- 37. A Practical Guide to Immunoassay Method Validation - PMC [https://pmc.ncbi.nlm.nih.gov/articles/PMC4541289/]
- 38. Comparison of diagnostic accuracies of rapid serological tests and... [https://pmc.ncbi.nlm.nih.gov/articles/PMC7265854/]
- 39. Frontiers | Evaluating ELISA, Immunofluorescence, and Lateral Flow Assay for SARS-CoV-2 Serologic Assays [https://www.frontiersin.org/journals/microbiology/articles/10.3389/fmicb.2020.597529/full]
- 40. Comparative assessment of homemade ELISA and lateral flow assay (LFA)in the rapid, specific and sensitive detection of SARS-CoV-2 anti-nucleocapsid protein in sera of Egyptian patients - PubMed [https://pubmed.ncbi.nlm.nih.gov/37319429/]
- 41. Artificial Intelligence for Drug Development | FDA [https://www.fda.gov/about-fda/center-drug-evaluation-and-research-cder/artificial-intelligence-drug-development]
- 42. Artificial intelligence in drug discovery and development - PMC [https://pmc.ncbi.nlm.nih.gov/articles/PMC7577280/]
- 43. of Comparison of action potential duration in... in silico predictions [https://ora.ox.ac.uk/objects/uuid:25652142-091d-4c96-979b-f89b433ae78f]
- 44. GitHub - tlebchan/insilico- validation [https://github.com/tlebchan/insilico-validation]
- 45. Frontiers | iRGvalid: A Robust in for Optimal silico ... Method Reference [https://www.frontiersin.org/journals/genetics/articles/10.3389/fgene.2021.716653/full]
- 46. A scoping review of rapid review methods | BMC Medicine | Full Text [https://bmcmedicine.biomedcentral.com/articles/10.1186/s12916-015-0465-6]
- 47. Introducing Nested Learning: A new ML paradigm for continual learning [https://research.google/blog/introducing-nested-learning-a-new-ml-paradigm-for-continual-learning/]
- 48. Illuminating Progress: The Contribution of Bioluminescence to Sustainable Development Goal 6—Clean Water and Sanitation—Of the United Nations 2030 Agenda - PMC [https://pmc.ncbi.nlm.nih.gov/articles/PMC10458275/]
- 49. Bioluminescence for Enhanced Hygiene and Food Safety Testing with ATP Verification | Hygiena [https://www.hygiena.com/learning-center/technology-guide/bioluminescence-for-enhanced-hygiene-and-food-safety-testing-with-atp-verification]
- 50. Effectiveness of ATP bioluminescence assay for presumptive identification of microorganisms in hospital water sources - PMC [https://pmc.ncbi.nlm.nih.gov/articles/PMC5493863/]
- 51. Effectiveness of ATP assay for presumptive... bioluminescence [https://bmcinfectdis.biomedcentral.com/articles/10.1186/s12879-017-2562-y]
- 52. Enhancing rapid microbiology QC in cell & gene therapy - Drug... [https://www.ddw-online.com/enhancing-rapid-microbiology-qc-in-cell-gene-therapy-34569-202504/]
- 53. Frontiers | A novel rapid bioluminescence-based antimicrobial susceptibility testing method based on adenosine triphosphate consumption [https://www.frontiersin.org/journals/microbiology/articles/10.3389/fmicb.2024.1357680/full]
- 54. of Pharmaceutical Dosage Forms: Sample ... Preparation Challenges [https://link.springer.com/book/10.1007/978-1-4419-9631-2]
- 55. A simple, rapid for simultaneous determination of multiple... method [https://bmcchem.biomedcentral.com/articles/10.1186/s13065-023-00946-x]
- 56. Overcoming Challenges in Sample Collection and Preparation [https://www.linkedin.com/pulse/overcoming-challenges-sample-collection-preparation-1c]
- 57. Sensitivity and Limit of Detection - ScienceDirect [https://www.sciencedirect.com/science/article/abs/pii/S092234870870220X]
- 58. Limit of Blank, Limit of Detection and Limit of Quantitation - PMC [https://pmc.ncbi.nlm.nih.gov/articles/PMC2556583/]
- 59. PPT - The AOAC International Rapid Process... Methods Validation [https://www.slideserve.com/yestin/the-aoac-international-rapid-methods-validation-process]
- 60. Rapid Sterility Testing Regulations | The Rapid Blog [https://www.rapidmicrobio.com/learning-center/rapid-blog/rapid-sterility-testing-regulations]
- 61. Increasing the sensitivity in case of LOD / LOQ problems in HPLC... [https://mpl.loesungsfabrik.de/en/english-blog/high-performance-liquid-chromatography/increase-of-sensitivity]
- 62. Unlocking the Power of Limit of Detection [https://www.numberanalytics.com/blog/limit-detection-optimization-analytical-chemistry]
- 63. 9.3. Estimation of LoD – Validation of liquid chromatography mass... [https://sisu.ut.ee/lcms_method_validation/93-estimating-lod/]
- 64. (PDF) Rapid for determination of protein content in cereals... method [https://www.academia.edu/49776157/Rapid_method_for_determination_of_protein_content_in_cereals_and_oilseeds_validation_measurement_uncertainty_and_comparison_with_the_Kjeldahl_method]
- 65. Understanding the Four Types of Analytical Validation Method [https://www.oxford-analytical.co.uk/understanding-the-four-types-of-analytical-method-validation/]
- 66. Comparative Evaluation of Bivalent Malaria Rapid Diagnostic Tests ... [https://pmc.ncbi.nlm.nih.gov/articles/PMC3589473/]
- 67. Accuracy in Analysis: The Role of Standard Reference Materials - PMC [https://pmc.ncbi.nlm.nih.gov/articles/PMC5181863/]
- 68. Development of Reference Methods and Reference Materials for Clinical Diagnostic Markers | NIST [https://www.nist.gov/programs-projects/development-reference-methods-and-reference-materials-clinical-diagnostic-markers]
- 69. Selected reaction monitoring (SRM) mass spectrometry without isotope labeling can be used for rapid protein quantification - PMC [https://pmc.ncbi.nlm.nih.gov/articles/PMC4121859/]
- 70. SRM & MRM Analysis Service - Creative Proteomics [https://www.creative-proteomics.com/services/srm-mrm.htm]
- 71. A Guide to Using SRM 2569 to Validate Analytical | NIST Methods [https://www.nist.gov/publications/guide-using-srm-2569-validate-analytical-methods]
- 72. mProphet: automated data processing and statistical validation for large-scale SRM experiments - PubMed [https://pubmed.ncbi.nlm.nih.gov/21423193/]
- 73. Automated Sample Ratio Mismatch ( SRM ) detection and analysis [https://www.lukasvermeer.nl/publications/2022/07/06/automated-srm-detection-and-analysis.html]
- 74. /MRM: Principles, Applications... - Creative Proteomics SRM [https://www.creative-proteomics.com/resource/srm-mrm-techniques-principles-applications-instrumentation.htm]
- 75. vs GAMP | USDM CSA [https://usdm.com/resources/blogs/gamp-5-an-overview-of-good-automated-manufacturing-practice]
- 76. CSA [https://www.dataworks.ie/gamp5-2nd-edition-and-csa-computer-software-assurance/]
- 77. Computer Software Assurance ( CSA ): Smarter Validation Compliance [https://blog.seerpharma.com/computer-software-assurance-csa-smarter-validation-compliance]
- 78. Second Edition vs. First: Key Differences Every Pharm GAMP 5 [https://www.linkedin.com/pulse/gamp-5-second-edition-vs-first-key-differences-every-pharma-yeotikar-p0pif]
- 79. Analysis and Comparative of Different Steps in Glycomics... Validation [https://pubmed.ncbi.nlm.nih.gov/28137572/]
- 80. A Comparison of Three Simple, Rapid for Red... | SciTechnol Methods [https://www.scitechnol.com/peer-review/a-comparison-of-three-simple-rapid-methods-for-red-blood-cell-removal-from-whole-blood-which-are-suitable-for-measuring-biomarkers-D0h5.php?article_id=10909]
- 81. Presenting the Results of Quantitative Analysis – Social Data Analysis [https://pressbooks.ric.edu/socialdataanalysis/chapter/writing-about-quantitative-data/]
- 82. What is Agile Acceptance ? A Complete Guide - SixSigma.us Criteria [https://www.6sigma.us/six-sigma-in-focus/agile-acceptance-criteria/]
- 83. of Five Quantitative Comparative Test... | PLOS One Validation Rapid [https://journals.plos.org/plosone/article?id=10.1371/journal.pone.0138530]
- 84. Achieving rapid microbial method validation [https://www.europeanpharmaceuticalreview.com/webinar/254469/achieving-rapid-microbial-method-validation-with-precise-reference-standard-quantification/]
- 85. Principles of early drug discovery - PMC [https://pmc.ncbi.nlm.nih.gov/articles/PMC3058157/]
- 86. Precision and Accuracy: Practices of Science_2025 [https://cliffscientificworld.com/precision-and-accuracy-science-practices/]
- 87. The regulatory acceptance of rapid microbiological methods [https://www.europeanpharmaceuticalreview.com/article/62880/rapid-microbiological-methods-regulatory-acceptance/]
- 88. Journal of Medical Internet Research - Methods for Analytical Validation of Novel Digital Clinical Measures: Implementation Feasibility Evaluation Using Real-World Datasets [https://www.jmir.org/2025/1/e70314]
- 89. How to Check the Accuracy of Your Machine Learning Model in 2025 [https://www.deepchecks.com/how-to-check-the-accuracy-of-your-machine-learning-model/]
- 90. Validation of Analytical Methods | IntechOpen [https://www.intechopen.com/chapters/57909]
- 91. Analytical Method Validation: Back to Basics, Part II | LCGC International [https://www.chromatographyonline.com/view/analytical-method-validation-back-basics-part-ii]
- 92. Validation of the HPLC Analytical Method for the Determination of Chemical and Radiochemical Purity of Ga-68-DOTATATE - PMC [https://pmc.ncbi.nlm.nih.gov/articles/PMC10171759/]
- 93. Evaluation of Near-Infrared Spectroscopy and Classical... Comparative [https://www.foodandnutritionjournal.org/volume13number3/comparative-evaluation-of-near-infrared-spectroscopy-and-classical-reference-methods-for-nutritional-analysis-of-fast-food-products/]