Targeted vs. Non-Targeted Method Validation: A Strategic Guide for Analytical Scientists
This article provides a comprehensive comparison of targeted and non-targeted analytical method validation for researchers and drug development professionals.
Targeted vs. Non-Targeted Method Validation: A Strategic Guide for Analytical Scientists
Abstract
This article provides a comprehensive comparison of targeted and non-targeted analytical method validation for researchers and drug development professionals. It explores the foundational principles, strategic applications, and distinct validation pathways for each approach, grounded in current regulatory frameworks like ICH Q14 and leveraging advancements in high-resolution mass spectrometry. The content addresses common troubleshooting scenarios and offers a practical framework for selecting and optimizing methods based on project goals, whether for precise quantification or comprehensive biomarker discovery. By synthesizing key challenges and comparative strengths, this guide aims to empower scientists in making informed decisions to ensure robust, reliable, and fit-for-purpose analytical procedures in biomedical and clinical research.
Core Principles: Defining Targeted and Non-Targeted Analytical Strategies
Targeted analytical paradigms are fundamental to hypothesis-driven research, enabling the precise and accurate quantification of predefined analytes in complex biological matrices. Unlike non-targeted approaches that screen for unknown compounds, targeted methods focus on specific molecules of interest, utilizing advanced instrumentation like triple quadrupole mass spectrometry to achieve exceptional sensitivity and specificity. This approach is particularly critical in pharmaceutical development, clinical diagnostics, and metabolic research where precise quantification of known biomarkers, therapeutics, or pathway metabolites is required for decision-making. The core strength of targeted methodologies lies in their ability to provide absolute quantification through calibration curves and isotopically labeled standards, delivering the rigorous data quality demanded in regulated environments [1].
This guide objectively compares the performance of targeted analytical approaches against non-targeted alternatives, providing experimental data and detailed methodologies to illustrate their respective capabilities in life sciences research.
Performance Comparison: Targeted vs. Non-Targeted Methods
A systematic comparison of targeted and non-targeted metabolomics methods reveals distinct performance characteristics suited to different research objectives [2]. The targeted approach demonstrates superior performance for quantitative precision, while non-targeted methods provide broader coverage for biomarker discovery.
Table 1: Analytical Performance Comparison Between Targeted and Non-Targeted Metabolomics
| Performance Characteristic | Targeted Metabolomics | Non-Targeted Metabolomics |
|---|---|---|
| Primary Objective | Quantification of known metabolites | Discovery of unknown biomarkers |
| Number of Metabolites | 181 metabolites (39 quantitative, 142 semi-quantitative) [2] | Thousands of chromatographic features |
| Quantification Capability | Absolute quantification using native & isotopic standards [2] | Relative quantification (peak area) |
| Analytical Precision | Superior precision in replicate analyses [2] | Lower precision, requires drift correction |
| Metabolite Identification | Definitive identification with standards | Tentative identification via databases |
| Data Quality | Reduced false positives; accounts for matrix effects [2] | Higher risk of false identifications |
Table 2: Method Validation Parameters for Targeted Proteomics in Clinical Applications
| Validation Parameter | Performance Requirement | Example: Chromogranin A Assay [1] |
|---|---|---|
| Dynamic Range | 4 orders of magnitude | Quantification over 4 orders of magnitude |
| Accuracy | Comparison to reference methods | Wider dynamic range vs. immunoassay |
| Precision | High inter-laboratory concordance | Demonstrated in monoclonal antibody assays |
| Specificity | Monitor multiple ion transitions | Minimum 2 transitions per analyte (quantifier & qualifier) |
| Throughput | Comparable or improved vs. alternatives | Increased throughput per batch vs. immunoassay |
Experimental Protocols for Method Comparison
Protocol for Targeted Metabolomics
Sample Preparation:
- Protein precipitation using cold acetonitrile
- Addition of stable isotope-labeled internal standards (SIS) for each analyte
- Derivatization for certain metabolite classes (e.g., amino acids)
- Reconstruction in mobile phase-compatible solvent [2]
Instrumental Analysis:
- Quantitative Analysis: UPLC-MS/MS with scheduled MRM for 39 metabolites (amino acids, biogenic amines, neurotransmitters, nucleobases)
- Semi-Quantitative Analysis: Flow injection-MS/MS for 142 lipids (50 carnitines, 83 phosphatidylcholines, 9 sphingomyelins)
- Chromatographic separation: HILIC or C18 columns depending on metabolite class
- Calibration curves using authentic standards covering expected physiological ranges [2]
Data Processing:
- Peak integration and review using vendor software
- Concentration calculation based on standard curves and internal standard correction
- Quality assessment using quality control (QC) samples [2]
Protocol for Non-Targeted Metabolomics
Sample Preparation:
- Protein precipitation with methanol:acetonitrile (1:1) for broad metabolite coverage
- Pooled QC samples for monitoring instrumental performance
- No internal standards for unknown compounds [2]
Instrumental Analysis:
- UPLC-HRMS (Orbitrap platform) with positive electrospray ionization
- Data-dependent acquisition (DDA) for MS/MS fragmentation
- Testing of ionization modes and stationary phases (C18 vs. HILIC) to maximize feature detection [2]
Data Processing:
- Feature detection, alignment, and integration using software (e.g., Compound Discoverer)
- Signal drift correction using algorithms (e.g., batchCorr)
- Compound identification using MS2 libraries (e.g., mzCloud)
- Multivariate statistical analysis for biomarker discovery [2]
Protocol for Comparison of Methods Experiment
Experimental Design:
- Analysis of minimum 40 patient specimens covering entire working range [3]
- Selection of specimens representing spectrum of diseases expected in routine application
- Analysis over minimum of 5 days to minimize systematic errors from single run [3]
- Specimens analyzed within two hours by test and comparative methods to ensure stability [3]
Statistical Analysis:
- Graphical analysis using difference plots (test minus comparative result vs. comparative result)
- Calculation of linear regression statistics (slope, y-intercept, standard deviation about the line)
- Estimation of systematic error (SE) at medical decision concentrations: Yc = a + bXc; SE = Yc - Xc [3]
- Correlation coefficient (r) calculation to assess data range adequacy [3]
Targeted Analysis Workflow
The Scientist's Toolkit: Essential Research Reagents and Materials
Table 3: Essential Research Reagents for Targeted Mass Spectrometry
| Reagent/Material | Function | Application Example |
|---|---|---|
| Stable Isotope-Labeled Standards (SIS) | Internal standards for precise quantification; correct for matrix effects and recovery [1] | SIS peptides/proteins in targeted proteomics [1] |
| Authentic Chemical Standards | Calibration curve generation; definitive metabolite identification [2] | Native standards for amino acids, lipids, etc. [2] |
| Quality Control Materials | Monitor analytical performance across batches; assess precision and accuracy [4] | Pooled QC (PQC) or surrogate QC (sQC) samples [4] |
| Immunoaffinity Enrichment Reagents | Enrich target analytes from complex matrices; improve sensitivity [1] | Anti-peptide antibodies for thyroglobulin assay [1] |
| Sample Preparation Consumables | Deplete high-abundance proteins; clean up samples [1] | Solid-phase extraction cartridges; precipitation reagents [1] |
Analytical Method Selection Logic
Analytical and Regulatory Requirements for Clinical Translation
The translation of targeted assays into clinical practice requires meeting stringent regulatory requirements and analytical performance metrics. For protein biomarker assays using targeted proteomics, this involves establishing test characteristics, defining intended use, and demonstrating clinical benefit during feasibility assessment [1]. Currently, targeted proteomics assays fall under Laboratory Developed Tests (LDTs), requiring individual laboratories to develop, validate, and implement methods on approved instrumentation while maintaining compliance with quality management systems [1].
Key validation parameters include accuracy, precision, sensitivity, specificity, and reproducibility. The comparison of methods experiment is particularly critical for assessing systematic error when implementing new clinical methods [3]. This involves analyzing patient specimens by both new and comparative methods, then estimating systematic errors based on observed differences, with particular attention to errors at critical medical decision concentrations [3].
Targeted analytical paradigms provide the precision, accuracy, and reproducibility required for quantitative analysis of known analytes in complex biological systems. While non-targeted approaches offer advantages for discovery-phase research, targeted methods deliver the rigorous quantification necessary for clinical application, therapeutic monitoring, and hypothesis-driven research. The selection between these approaches should be guided by research objectives, with targeted methods providing optimal performance for quantification of predefined analytes and non-targeted methods excelling at comprehensive biomarker discovery. As demonstrated through systematic comparisons, targeted methodologies consistently demonstrate superior precision and quantitative capabilities, making them indispensable for applications requiring high data quality and reproducibility.
The field of chemical analysis is undergoing a fundamental transformation, moving from a focused, hypothesis-driven approach to a comprehensive, discovery-oriented paradigm. Targeted analysis has long been the gold standard for quantitative analytical chemistry, focusing on predefined compounds with established methods and reference standards. In contrast, non-targeted analysis (NTA) represents a paradigm shift toward hypothesis-generating exploration that comprehensively characterizes samples without predefined targets [5]. This methodological evolution is driven by the recognition that targeted methods inherently miss unexpected or unknown chemicals present in complex samples [6]. The growing importance of NTA stems from its capacity to detect both familiar components and completely uninvestigated compounds, providing crucial insights into sample composition that would otherwise remain obscured by traditional targeted frameworks [5].
The fundamental distinction between these approaches lies in their core objectives: targeted methods confirm presence or absence of known analytes, while NTA aims to discover previously unidentified chemicals [7]. This comparative analysis examines the current landscape of both methodologies, their validation frameworks, performance characteristics, and practical applications to guide researchers in selecting appropriate strategies for their analytical challenges.
Fundamental Principles and Comparative Workflows
Core Conceptual Differences
The conceptual foundations of targeted and non-targeted methodologies reflect their divergent analytical purposes:
Targeted Analysis operates within a closed-list framework where analysts determine beforehand which specific compounds to monitor. This approach relies on reference standards for each target compound to generate calibration curves and establish retention times [8]. The targeted paradigm provides excellent sensitivity and quantification for known compounds but offers no capability to detect analytes outside its predefined scope [6].
Non-Targeted Analysis employs an open-list framework designed to capture as many chemical features as possible without prior knowledge of what might be present [5]. Rather than confirming predetermined hypotheses, NTA generates new hypotheses about sample composition through comprehensive data acquisition and advanced data mining techniques [9]. This makes NTA particularly valuable for discovering emerging contaminants, transformation products, and unexpected chemicals in complex matrices [10].
Workflow Comparison
The operational workflows for targeted and non-targeted approaches differ significantly in sample preparation, instrumentation, data acquisition, and processing requirements. The following diagram illustrates the core workflow of the non-targeted paradigm:
Table 1: Core Workflow Differences Between Targeted and Non-Targeted Approaches
| Workflow Component | Targeted Analysis | Non-Targeted Analysis |
|---|---|---|
| Sample Preparation | Selective extraction optimized for specific analytes | Minimal/generic preparation to preserve chemical diversity [5] |
| Extraction Techniques | Solid-phase extraction (SPE) with selective sorbents | Multi-sorbent SPE, QuEChERS, or dilute-and-shoot [9] |
| Chromatography | Optimized separation for target compounds | Generic gradients for broad coverage [11] |
| Mass Spectrometry | Low-resolution (triple quadrupole) with MRM | High-resolution MS (Orbitrap, Q-TOF) with full-scan acquisition [10] [5] |
| Data Acquisition | Multiple reaction monitoring (MRM) | Data-independent (DIA) or data-dependent (DDA) acquisition [12] [11] |
| Data Processing | Targeted integration using predefined transitions | Untargeted peak picking, alignment, and compound identification [9] |
| Compound Identification | Matching retention time and MRM transition to standards | Spectral library matching, in silico fragmentation, retention time prediction [10] |
Performance Metrics and Validation Frameworks
Quantitative Performance Comparison
Rigorous performance assessment reveals fundamental trade-offs between targeted and non-targeted approaches. A systematic comparison of quantitative performance using per- and polyfluoroalkyl substances (PFAS) as a model system demonstrated distinct characteristics for each method [6]:
Table 2: Quantitative Performance Comparison Between Targeted and Non-Targeted Approaches
| Performance Metric | Targeted Analysis | qNTA with Expert-Selected Surrogates | qNTA with Global Surrogates |
|---|---|---|---|
| Relative Accuracy | Benchmark (1×) | ~1.5× decrease | ~4× decrease |
| Uncertainty | Lowest | ~70× increase | ~1000× increase |
| Reliability | Highest | ~5% decrease | ~5% decrease |
| Calibration Approach | Compound-specific calibration curves | Surrogate calibration using similar compounds | Bootstrap-sampled calibration from all available surrogates |
| Internal Standard Use | Matched isotope-labeled standards | Limited or class-based internal standards | Limited or class-based internal standards |
The data reveal that while targeted approaches provide superior accuracy and precision for known compounds, quantitative non-targeted analysis (qNTA) strategies offer viable semi-quantitative estimates when reference standards are unavailable [6]. The performance degradation in qNTA stems primarily from response factor variability between structurally diverse compounds, highlighting the critical importance of surrogate selection strategies.
Validation Parameters
Traditional method validation follows established guidelines with clearly defined parameters, while NTA validation requires more flexible, fit-for-purpose approaches:
Table 3: Validation Parameters for Targeted Versus Non-Targeted Methods
| Validation Parameter | Targeted Analysis | Non-Targeted Analysis |
|---|---|---|
| Specificity | Demonstrated for each target analyte | Method capability to detect diverse chemical classes |
| Accuracy | Spike recovery with reference standards | Limited to identified compounds with available standards |
| Precision | Repeatability and intermediate precision | System stability and feature detection reproducibility |
| Detection Limit | Established for each target | Variable across chemical space; depends on ionization efficiency |
| Linearity | Demonstrated for each target | Typically assessed using quality control samples |
| Identification Confidence | Based on retention time and transition matching | Tiered system (Level 1-5) based on spectral matching and standards [9] |
Traditional validation parameters defined in guidelines like ICH Q2(R1) apply well to targeted methods but require adaptation for NTA [8]. The tiered confidence level system for identification (Level 1: confirmed with reference standard; Level 5: exact mass unknown) has emerged as a crucial validation framework for NTA [9].
Experimental Protocols and Applications
Representative Methodologies
Non-Targeted Analysis of Emerging Contaminants
Protocol Overview: This methodology enables comprehensive screening of unknown environmental contaminants through high-resolution mass spectrometry and advanced data processing [10].
Sample Preparation:
- Minimal Processing: Protein precipitation with methanol/acetonitrile (1:1) for biological samples [13]
- Broad-Spectrum Extraction: Multi-sorbent solid-phase extraction (Oasis HLB + ISOLUTE ENV+) for water samples [9]
- Quality Controls: Include pooled quality control samples and procedural blanks
Instrumental Analysis:
- Platform: UHPLC coupled with Q-TOF or Orbitrap mass spectrometer
- Chromatography: Reversed-phase (C18) or HILIC with generic gradient
- Acquisition: Data-independent acquisition (DIA) for comprehensive fragmentation data
Data Processing:
- Peak Picking: Using software like XCMS, MS-DIAL, or OpenMS
- Compound Identification: Spectral library searching (GNPS, NIST) and in silico fragmentation
- Statistical Analysis: Multivariate analysis (PCA, PLS-DA) and machine learning classification
Validation Approach:
- Reference Materials: Use of certified reference materials when available
- Cross-Platform Comparison: Analysis of same samples with complementary techniques
- Tiered Identification: Reporting confidence levels based on available evidence [9]
Targeted Pharmaceutical Validation
Protocol Overview: This approach provides validated quantification of specific pharmaceutical compounds according to regulatory standards [8] [11].
Sample Preparation:
- Selective Extraction: Optimized solid-phase extraction or liquid-liquid extraction
- Internal Standards: Deuterated or stable isotope-labeled analogs for each target
Instrumental Analysis:
- Platform: HPLC coupled with triple quadrupole mass spectrometer
- Chromatography: Optimized isocratic or gradient separation
- Acquisition: Multiple reaction monitoring (MRM) with compound-specific transitions
Method Validation:
- Specificity: No interference at retention times of target analytes
- Linearity: Minimum of 5 concentration points across working range
- Accuracy and Precision: Within 15% of nominal values for all targets
- Stability: Evaluation under various storage and processing conditions
Application Case Studies
Rheumatoid Arthritis Biomarker Discovery
A comprehensive multi-center study exemplifies the integration of non-targeted discovery with targeted validation [13]. Researchers analyzed 2,863 blood samples across seven cohorts using:
- Non-Targeted Discovery: UHPLC-HRMS profiling identified potential metabolite biomarkers distinguishing rheumatoid arthritis from osteoarthritis and healthy controls
- Targeted Validation: Six promising biomarkers were validated using targeted LC-MS/MS with stable isotope-labeled internal standards
- Model Performance: The metabolite-based classifiers achieved AUC values of 0.8375-0.9280 for RA vs. healthy controls and 0.7340-0.8181 for RA vs. osteoarthritis across independent validation cohorts
This integrated approach demonstrates how non-targeted discovery generates hypotheses that can be rigorously validated using targeted methods for clinical application.
Food Contact Material Safety Assessment
Non-targeted analysis has proven particularly valuable for identifying non-intentionally added substances (NIAS) in plastic food contact materials, where the complete chemical composition is unknown [12]. The workflow includes:
- Migration Testing: Exposure of materials to food simulants under controlled conditions
- Comprehensive Screening: UHPLC-HRMS analysis with data-independent acquisition
- Risk Assessment: Application of Threshold of Toxicological Concern (TTC) and Cramer classification to prioritize unidentified features
This application highlights the unique capability of NTA to address analytical challenges where the targets are fundamentally unknown.
The Scientist's Toolkit: Essential Research Reagents and Solutions
Table 4: Essential Research Reagents and Solutions for Non-Targeted Analysis
| Category | Specific Products/Techniques | Function and Application |
|---|---|---|
| Sample Preparation | QuEChERS, Oasis HLB SPE, ISOLUTE ENV+ | Broad-spectrum extraction with minimal analyte discrimination [9] |
| Chromatography | Acquity BEH C18, HSS T3, Accucore Phenyl Hexyl columns | Separation of diverse chemical classes with different selectivity [11] |
| Mass Spectrometry | Orbitrap Exploris, Q-TOF systems | High-resolution accurate mass measurement for elemental composition assignment [10] [13] |
| Data Processing | XCMS, MS-DIAL, Compound Discoverer | Untargeted peak detection, alignment, and feature reduction [9] |
| Compound Identification | NIST, GNPS, mzCloud libraries | Spectral matching for structural elucidation [12] |
| Quantitative Surrogates | Perdeuterated internal standards, class-based surrogates | Response factor estimation for quantitative NTA [6] |
| Quality Control | Pooled QC samples, NIST SRM 1950 | Monitoring system stability and data quality [9] |
Integrated Workflow for Contemporary Analytical Challenges
The complementary strengths of targeted and non-targeted approaches suggest an integrated workflow that leverages the advantages of both paradigms:
This integrated approach begins with non-targeted screening to characterize sample composition and identify potential compounds of interest, followed by targeted method development for priority substances requiring precise quantification [13]. The workflow creates a virtuous cycle where non-targeted analysis discovers new relevant compounds that can be incorporated into future targeted methods.
The analytical landscape continues to evolve from purely targeted approaches toward integrated strategies that leverage the discovery power of non-targeted analysis with the quantitative rigor of targeted methods. While targeted analysis remains essential for regulatory compliance and precise quantification, non-targeted approaches provide unprecedented capability to discover novel contaminants, transformation products, and unexpected chemicals in complex matrices [10] [12].
The choice between these paradigms depends fundamentally on the analytical question: targeted methods answer "how much is there of these specific compounds?" while non-targeted approaches address "what is in this sample?" [5] [7]. As analytical technologies advance and computational tools become more sophisticated, the integration of both approaches will increasingly drive innovation in environmental monitoring, pharmaceutical development, food safety, and clinical diagnostics [13] [9].
Future directions will likely focus on improving quantitative performance of NTA through better response prediction models [10], expanding spectral libraries for compound identification [12], and developing harmonized validation frameworks that accommodate the unique characteristics of non-targeted methods [7]. By understanding the complementary strengths and limitations of each approach, researchers can design more comprehensive analytical strategies that address the complex chemical characterization challenges of the future.
The International Council for Harmonisation (ICH) Q14 guideline, entitled "Analytical Procedure Development," provides a modernized, science-based framework for the development and lifecycle management of analytical procedures used in the assessment of drug substance and drug product quality [14] [15]. Effective in March 2024, this guideline, together with the revised ICH Q2(R2), aims to facilitate more efficient, science-based, and risk-based post-approval change management [15]. The core principle of ICH Q14 is the introduction of an Analytical Procedure Lifecycle approach, which encourages a structured path from initial development through continuous monitoring and improvement, ensuring methods remain fit-for-purpose over their entire use [16]. This foundational framework is critical for the effective validation of both traditional targeted methods and the increasingly prevalent non-targeted methods.
The following diagram illustrates the key stages and decision points in the analytical procedure lifecycle as guided by ICH Q14.
Core Principles of ICH Q14 and Their Impact on Method Validation
ICH Q14 emphasizes a systematic, knowledge-driven approach to analytical procedure development, which directly enhances the validation process. The guideline outlines two approaches for development: the traditional approach and the more enhanced approach. The enhanced approach is strongly recommended as it builds a deeper understanding of the procedure's performance, directly contributing to a more robust and reliable validation [14] [15]. A cornerstone of this enhanced approach is the establishment of an Analytical Target Profile (ATP), which is a predefined objective that articulates the required quality of the analytical data the procedure must produce [16]. The ATP fundamentally shapes validation by defining the specific performance criteria, such as accuracy and precision, that the method must demonstrate to be deemed suitable for its intended use.
Furthermore, ICH Q14 promotes the use of risk management and multivariate studies during development to understand the impact of various procedure parameters on the results [15]. This knowledge is critical for defining the method's robustness during validation—a key characteristic that ensures the method remains unaffected by small, deliberate variations in method parameters [17]. By integrating these principles, the transition from method development to validation becomes a seamless, predictable process where the performance characteristics are thoroughly understood and confirmed, rather than being investigated for the first time.
Comparative Analysis: Targeted vs. Non-Targeted Method Validation
The analytical landscape is broadly divided into targeted and non-targeted methods. Targeted methods are designed to accurately measure one or a few predefined analytes, while non-targeted methods aim to detect a wide range of unknown compounds or patterns in a sample, often for screening or discovery purposes [18] [7]. The validation of these two approaches differs significantly in its objectives and execution, a distinction that becomes clear when framed within the ICH Q14 lifecycle.
Table 1: Core Comparison of Targeted vs. Non-Targeted Method Validation
| Validation Characteristic | Targeted Methods (e.g., HPLC, LC-MS/MS) | Non-Targeted Methods (e.g., HRMS, NMR) |
|---|---|---|
| Primary Objective | Quantify or identify specific, known analytes [19] | Detect patterns or differences; identify unknown compounds [7] [20] |
| Specificity | High specificity for target analyte(s), free from interference [17] | Ability to discriminate between sample classes; not tied to a single analyte [20] |
| Accuracy & Precision | Formally demonstrated using reference standards [17] | Focus on model/prediction precision and stability; often lacks a true reference [18] [20] |
| Linearity & Range | Established for target analytes over a defined concentration range [17] | Not applicable in the same way; focus is on the "chemical coverage" of the method [18] |
| Sensitivity (LOD/LOQ) | Defined Limit of Detection (LOD) and Limit of Quantification (LOQ) [17] | System sensitivity is linked to signal-to-noise and ability to detect meaningful markers [7] |
| Robustness | Tested against variations in key method parameters (e.g., pH, temperature) [17] | Critical to ensure model performance is stable over time and across instrument platforms [7] |
| Key Challenge | Ensuring selectivity in complex matrices | Data handling, model validation, and proving fitness-for-purpose [7] [20] |
Experimental Protocols and Workflow
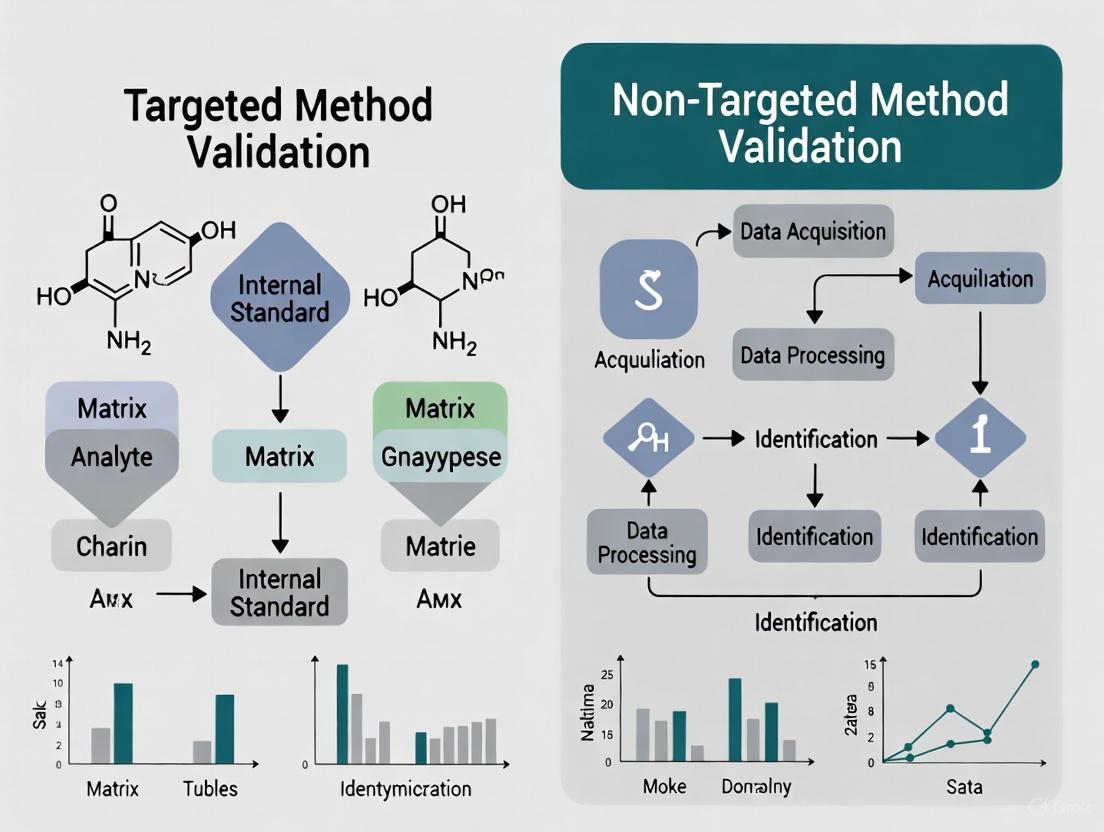
The experimental workflow for validating these methods highlights their fundamental differences. The targeted method workflow is a linear, confirmatory process, whereas the non-targeted workflow is iterative and exploratory, heavily reliant on multivariate statistics and model building.
The following diagram contrasts the generalized experimental workflows for the validation of targeted and non-targeted methods.
Detailed Protocol for Targeted Method Validation [19] [17]:
- Define Objectives and ATP: Specify the analyte, matrix, acceptance criteria (e.g., precision ≤15% RSD), and the intended use.
- Specificity Testing: Inject blank matrix, standard, and spiked matrix to demonstrate no interference at the retention time of the analyte.
- Linearity and Range: Prepare and analyze a minimum of 5 concentration levels across the expected range. Calculate the correlation coefficient (R²) and y-intercept.
- Accuracy and Precision: Prepare QC samples at Low, Mid, and High concentrations (n≥5 each). Analyze and report %Bias (accuracy) and %RSD (precision).
- Robustness Testing: Deliberately vary key parameters (e.g., column temperature ±2°C, mobile phase pH ±0.1) and evaluate impact on system suitability criteria.
Detailed Protocol for Non-Targeted Method Workflow [7] [20]:
- Experimental Design: Assemble a large and diverse set of authentic samples representing the different classes to be discriminated (e.g., authentic vs. adulterated food).
- Data Acquisition: Use high-resolution mass spectrometry (HRMS) or NMR with minimal sample prep to maximize chemical coverage. Include quality control (QC) pooled samples.
- Data Pre-processing: Use software for peak picking, alignment, and normalization to create a data matrix of features (m/z, retention time, intensity).
- Chemometric Modeling: Apply unsupervised (e.g., PCA) and supervised (e.g., PLS-DA, Random Forests) methods to build a classification model.
- Model Validation: Use strict validation techniques such as cross-validation, test-set validation, or external validation to confirm the model's predictive ability and avoid overfitting.
Essential Research Reagent Solutions and Materials
The execution of both targeted and non-targeted analyses relies on a suite of specialized reagents and materials. The table below details key items essential for experiments in this field.
Table 2: Key Research Reagent Solutions and Materials
| Item | Function & Application |
|---|---|
| Certified Reference Standards | Provides the "ground truth" for targeted method validation; used to establish accuracy, linearity, and range [19]. |
| Stable Isotope-Labeled Internal Standards | Corrects for matrix effects and analytical variability in quantitative targeted LC-MS/MS assays [19]. |
| High-Purity Solvents & Mobile Phase Additives | Essential for achieving high sensitivity and specificity; minimizes background noise in chromatographic systems [17]. |
| Characterized Column Chemistry | Provides reproducible selectivity; critical for both targeted separations and the consistent retention times required in non-targeted workflows [17]. |
| Quality Control (QC) Reference Materials | A characterized control sample run in sequence to monitor system stability and data quality over time, crucial for both method types [7]. |
| Well-Characterized Sample Sets | For non-targeted methods, a set of authentic samples with verified class labels is the primary reagent for building and validating models [20]. |
ICH Q14's Analytical Procedure Lifecycle provides a vital, modernized structure that strengthens the regulatory foundation for analytical science. By mandating a science- and risk-based approach from development through continuous monitoring, it ensures methods are robust and fit-for-purpose. The comparative analysis reveals that while targeted method validation is a mature, quantitative paradigm focused on predefined performance characteristics for known analytes, non-targeted validation is a evolving, qualitative paradigm centered on model reliability and predictive power for unknown chemical patterns. Understanding these distinctions is essential for researchers, scientists, and drug development professionals to effectively develop, validate, and maintain analytical procedures in a compliant and scientifically rigorous manner.
In analytical chemistry, particularly within pharmaceutical development and food authentication, the choice between targeted and non-targeted methods represents a fundamental strategic decision. A targeted method is designed to focus on predefined analytes, optimizing for the precise detection and quantification of specific "needles in a haystack" [21]. In contrast, a non-targeted method (NTM) aims to exploit a broader analytical signature, capturing a wide range of constituents without a predefined target, thus characterizing the entire "haystack" [22]. This guide provides an objective comparison of these approaches based on four key performance metrics: Precision, Coverage, Identification Confidence, and Throughput, framed within the context of analytical method validation research.
The following table summarizes the core performance characteristics of targeted versus non-targeted methods, highlighting their inherent trade-offs.
Table 1: Core Metric Comparison between Targeted and Non-Targeted Methods
| Metric | Targeted Methods | Non-Targeted Methods |
|---|---|---|
| Precision | High. Optimized for repeatability and reproducibility of specific analyte measurements [23]. | Moderate to Variable. Focuses on pattern recognition and relative comparison; absolute quantification can be less precise [22]. |
| Coverage | Narrow. Limited to a predefined set of analytes (e.g., known impurities, specific markers) [21]. | Broad. Capable of detecting a wide range of expected and unexpected components [22]. |
| Identification Confidence | High for target analytes, supported by reference standards [23]. Not designed for unknown identification. | Variable for unknowns. Highly dependent on database completeness and computational prediction accuracy [24]. |
| Throughput | Typically high for routine analysis once validated. Streamlined for specific targets [23]. | Often lower in data acquisition and significantly lower in data processing and interpretation due to complexity [22]. |
Detailed Metric Analysis and Experimental Data
Precision
Precision measures the closeness of agreement between a series of measurements obtained from multiple sampling of the same homogeneous sample under prescribed conditions [23].
Targeted Method Performance: In regulated pharmaceutical development, targeted assays for potency or impurities are rigorously validated to demonstrate high precision. For instance, a typical HPLC-UV assay for a drug substance may achieve a %RSD (Relative Standard Deviation) of less than 2.0% for peak areas in repeatability experiments, ensuring reliable quantification of the active pharmaceutical ingredient (API) [23]. This high precision is achievable because the method is optimized around the chemical properties of a specific analyte.
Non-Targeted Method Performance: The precision of NTMs is often assessed through the stability of the analytical fingerprint and the reproducibility of multivariate models. Performance is less about the precise quantification of a single compound and more about the consistent profile of a sample. Validation studies focus on the method's ability to consistently classify samples or detect deviations, which can be influenced by instrumental drift and sample preparation variability [22].
Coverage
Coverage defines the scope of analytes that a method can detect and is a primary differentiator between the two paradigms.
Targeted Analysis: Coverage is intrinsically limited to the list of analytes defined during method development. This is ideal for monitoring known compounds, such as in a stability-indicating method that tracks the API and its known degradation products [23]. Its strength is depth, not breadth.
Non-Targeted Analysis: NTMs are designed for breadth. Techniques like high-resolution mass spectrometry (HRMS) and NMR are used to capture data from thousands of features in a single run. This makes them powerful for discovery, such as identifying novel metabolites or detecting unknown food fraud [22]. A study on metabolomics noted that a key advantage of NTMs is their ability to move beyond the limitations imposed by the availability of authentic chemical standards, thereby expanding the "identifiable molecular universe" [24].
Identification Confidence
Confidence in identifying a compound is tied to the quality of the reference data used for comparison.
Targeted Analysis: Confidence is high because identification is based on direct comparison with authentic reference standards under validated conditions. For a chromatographic method, this involves matching the retention time and spectral data (e.g., UV, MS) of the sample to a certified standard [23]. This aligns with regulatory requirements for definitive identification [23].
Non-Targeted Analysis: Confidence is probabilistic and multi-layered. It relies on comparing analytical signatures (e.g., mass-to-charge ratio, fragmentation spectra, collision cross section) against reference databases [24]. A key challenge is that the number of potential annotations for an unknown feature is inversely related to the precision of the measurements. Research has shown that annotation confidence increases significantly when using multidimensional signatures (e.g., combining accurate mass, retention time, and CCS) as this reduces the search space and ambiguity [24]. The maturation of computational prediction tools is creating a "reference-free" paradigm, but gauging confidence in these predictions remains an active area of research [24].
Table 2: Impact of Multi-dimensional Data on Identification Confidence in Non-Targeted Analysis
| Properties Used for Identification | Effect on Search Space & Identification Confidence |
|---|---|
| Single Property (e.g., m/z only) | Large search space, low confidence, high risk of misidentification due to isomers. |
| Two Properties (e.g., m/z + RT) | Reduced search space, moderate confidence. |
| Three+ Properties (e.g., m/z + RT + MS/MS) | Significantly constrained search space, high confidence annotation [24]. |
Throughput
Throughput considers the speed of analysis from sample preparation to final report.
Targeted Analysis: Once developed and validated, targeted methods are typically high-throughput for routine analysis. Sample preparation and instrumentation (e.g., LC-MS/MS) are optimized for a specific workflow, enabling fast cycle times and automated data processing with clear pass/fail criteria [23].
Non-Targeted Analysis: Throughput is often lower. Data acquisition itself can be longer due to the need for high-resolution, full-scan data. The most significant bottleneck is data processing and interpretation. The complex datasets require sophisticated bioinformatics pipelines, statistical analysis, and often manual validation, which drastically reduces overall throughput compared to targeted assays [22].
Experimental Protocols for Method Comparison
To objectively compare these methodologies, the following experimental protocols can be employed.
Protocol for Assessing Precision and Throughput
This protocol is designed to generate quantitative data for the metrics of precision and throughput.
- Sample Preparation: Prepare a set of identical samples spiked with a panel of 10 known analytes at relevant concentrations.
- Targeted Analysis:
- Instrumentation: Use a triple quadrupole LC-MS/MS system in MRM mode.
- Execution: Analyze the sample set in triplicate over three different days.
- Data Analysis: For each analyte, calculate the %RSD for retention time and peak area to determine intra-day and inter-day precision. Record the average instrument cycle time per sample.
- Non-Targeted Analysis:
- Instrumentation: Use a high-resolution LC-Q-TOF (Time-of-Flight) mass spectrometer in data-dependent acquisition (DDA) mode.
- Execution: Analyze the same sample set with the same replication schedule.
- Data Analysis: For the same 10 analytes, perform peak picking and alignment using computational software. Calculate the %RSD for retention time and peak area. Record the total instrument cycle time and the additional time required for data processing.
- Comparison: Compare the precision (%RSD) and total analysis time (sample-to-result) between the two methods for the 10 target analytes.
Protocol for Assessing Coverage and Identification Confidence
This protocol evaluates the ability to identify both expected and unexpected components.
- Sample Preparation: Prepare a complex sample (e.g., plant extract, biological fluid) containing both known and unknown components. Spike it with a blinded compound not included in the initial targeted list.
- Targeted Analysis:
- Execution: Analyze the sample using the validated targeted LC-MS/MS method.
- Data Analysis: Report the detection and quantification of the pre-defined analytes. Note the failure to detect the spiked, unknown compound.
- Non-Targeted Analysis:
- Execution: Analyze the sample using the LC-Q-TOF method.
- Data Analysis: Process the data using untargeted workflows. Document the total number of detectable molecular features. Attempt to identify the spiked unknown compound by searching its accurate mass and MS/MS spectrum against public (e.g., HMDB, MassBank) and commercial databases.
- Comparison: Report the number of features detected by the NTM versus the number quantified by the targeted method. Report the confidence level of the identification for the spiked unknown (e.g., Level 1: Confirmed by standard, Level 2: Probable structure based on spectral library match) [24].
Workflow and Decision Pathways
The following diagram illustrates the logical decision process for selecting between targeted and non-targeted methods based on analytical goals.
The Scientist's Toolkit: Essential Research Reagents and Materials
The experimental protocols and applications described rely on a foundation of specific reagents, instruments, and computational tools.
Table 3: Essential Reagents, Instruments, and Software for Analytical Method Comparison
| Category | Item | Function in Research |
|---|---|---|
| Reference Standards | Authentic Chemical Standards | Provide definitive identification and calibration for targeted analysis; essential for validating non-targeted identifications [23]. |
| Chromatography | HPLC/UPLC System, C18 Columns, Buffers/Mobile Phases | Separates complex mixtures to reduce ion suppression and resolve isomers, critical for both analytical paradigms [23]. |
| Mass Spectrometry | Triple Quadrupole (QQQ) Mass Spectrometer | The workhorse for sensitive, quantitative targeted analysis (e.g., MRM) [23]. |
| Quadrupole-Time of Flight (Q-TOF) Mass Spectrometer | Provides high-resolution accurate mass (HRAM) measurements for untargeted discovery and confident molecular formula assignment [24]. | |
| Data Analysis | CDS (Chromatography Data System) Software | Controls instrumentation and processes data for targeted methods (e.g., calculates peak area, %RSD) [23]. |
| Bioinformatics Platforms (e.g., XCMS, MS-DIAL) | Processes complex HRMS data for non-targeted analysis, performing peak picking, alignment, and statistical analysis [24]. | |
| Reference Databases | HMDB, MassBank, METLIN, NIST MS/MS Library | Spectral libraries used to query and identify unknown features detected in non-targeted analysis [24]. |
Strategic Implementation: Choosing the Right Tool for Your Research Question
The fundamental divide between targeted and untargeted approaches represents a critical strategic decision in analytical science, influencing every subsequent stage of experimental workflow and data acquisition. While Next-Generation Sequencing (NGS) offers a powerful illustration of this dichotomy, the core principles directly inform method validation research across fields, including Nanoparticle Tracking Analysis (NTA). Targeted methods focus on predefined analytes with high sensitivity, whereas untargeted approaches provide a comprehensive, hypothesis-generating view of complex samples [25]. This guide objectively compares these paradigms through experimental data, detailed protocols, and analytical outcomes to inform researchers and drug development professionals in their methodological selections.
Methodological Foundations: Core Principles and Workflows
Defining Targeted and Untargeted Approaches
Targeted methods are characterized by their specificity for predetermined targets. These techniques employ probes, primers, or capture reagents designed to enrich specific analytes from a complex background. Examples include tiled-amplicon sequencing for specific viral genomes [25] and hybrid-capture enrichment using predefined probe panels [25]. The primary advantage lies in significantly enhanced sensitivity for low-abundance targets, making these methods indispensable for diagnostic applications and specific variant detection.
In contrast, untargeted (shotgun) methods undertake a comprehensive analysis of all components within a sample without prior selection. Shotgun metagenomic sequencing exemplifies this approach, theoretically enabling the detection of novel or unexpected analytes [25]. However, this breadth comes at the cost of sensitivity for specific targets, as sequencing depth is distributed across all sample constituents, potentially obscuring low-abundance targets amidst dominant background signals.
Generalized Workflow Architecture
The following diagram illustrates the core decision pathways and procedural steps in targeted versus untargeted methodologies:
Figure 1: Generalized workflow comparing targeted and untargeted methodological pathways.
Experimental Comparison: Performance Evaluation in Sequencing Applications
Study Design and Protocol Specifications
A 2023 study directly compared metagenomic (untargeted) and targeted methods for detecting viral pathogens in wastewater, providing robust experimental data on methodological performance [25]. The protocols were implemented as follows:
1. Untargeted Shotgun Metagenomic Sequencing Protocol [25]:
- Input Material: Total nucleic acid extracted from influent wastewater.
- Processing: Centrifugation to remove solids and bacterial cells, followed by ammonium sulfate precipitation to enrich viral particles.
- Library Preparation: Standard metagenomic library construction without target enrichment.
- Sequencing Parameters: Deep sequencing to a mean depth of 303 million (±9.6 million) 2×150 bp read pairs per library on Illumina platforms.
2. Targeted Hybrid-Capture Enrichment Protocol [25]:
- Input Material: Metagenomic libraries from the same wastewater extracts.
- Enrichment Method: Hybrid-capture using a Respiratory Virus Oligos Panel (RVOP).
- Processing: Library hybridization with target-specific probes, washing, and amplification of captured targets.
- Sequencing Parameters: Mean depth of 106 million (±3.4 million) 2×150 bp read pairs per library.
3. Targeted Tiled-PCR Sequencing Protocol [25]:
- Input Material: Same wastewater nucleic acid extracts.
- Primer Design: Novel primer schemes for tiled-PCR amplification of specific viral genomes (SARS-CoV-2, enterovirus D68, norovirus GII, human adenovirus F41).
- Amplification: Multiplex PCR amplification across entire target genomes.
- Sequencing: Standard Illumina library preparation from amplified products.
Quantitative Performance Metrics
The following table summarizes the key performance outcomes from the comparative study:
Table 1: Experimental performance comparison of sequencing methodologies for viral detection [25].
| Methodological Approach | Percentage of Viral Reads | Genome Coverage for Targets | Detection of Novel Variants | Sensitivity for Low-Abundance Targets |
|---|---|---|---|---|
| Untargeted Shotgun | <0.6% of total reads | Insufficient for robust genomics | Possible but limited by sensitivity | Poor (dominated by background bacteria) |
| Targeted Hybrid-Capture | Significantly increased vs. shotgun | 15/25 targets with significantly increased coverage | Enabled for panel targets | Good for enriched targets |
| Targeted Tiled-PCR | Highest among methods | Optimal for individual viruses | Limited to known target regions | Excellent (designed for low concentrations) |
Comparative Analysis of Methodological Biases
Beyond sensitivity, each method introduces distinct analytical biases that impact data interpretation:
GC Bias and Coverage Uniformity: Targeted methods employing PCR amplification can introduce GC bias, leading to uneven coverage across genomic regions with extreme GC content [26]. PCR-free protocols, such as Illumina's TruSeq DNA PCR-Free kit, demonstrate improved coverage uniformity for G-rich, high GC, and promoter regions compared to PCR-dependent methods [27].
Enrichment Efficiency and Cross-Reactivity: Hybrid-capture enrichment demonstrated notable cross-reactivity for genetically similar targets not explicitly included in the probe panel. For example, probes designed for HAdV-B and -C also enriched HAdV-A, -D, and -F, broadening detection capabilities beyond the intended targets [25].
The Scientist's Toolkit: Essential Research Reagent Solutions
Selecting appropriate reagent systems is critical for implementing either targeted or untargeted methodologies. The following table catalogs key commercial solutions referenced in the experimental literature:
Table 2: Key research reagent solutions for nucleic acid analysis workflows.
| Product Name | Supplier | Primary Function | Key Applications | Notable Features |
|---|---|---|---|---|
| TruSeq DNA PCR-Free Prep | Illumina | Library preparation for whole genome sequencing | De novo assembly, WGS | Eliminates PCR bias, input: 25 ng–300 ng [27] |
| TruSeq DNA Nano | Illumina | Library preparation from low-input samples | Genotyping, WGS | Requires only 100 ng input DNA [27] |
| xGen ssDNA & Low-Input DNA Library Prep Kit | Integrated DNA Technologies | Library preparation from challenging samples | Sequencing of low-quality degraded DNA/ssDNA | Compatible with 10 pg–250 ng input [27] |
| NEBNext Ultra DNA Kit | New England Biolabs | Library preparation for Illumina platforms | WGS, target enrichment | Slightly cheaper and faster workflow than comparable kits [26] |
| Respiratory Virus Oligos Panel (RVOP) | Illumina | Hybrid-capture enrichment | Targeted respiratory virus detection | Enables simultaneous genomic epidemiology of multiple pathogens [25] |
| AMPure XP Beads | Beckman-Coulter | Magnetic bead-based size selection | DNA library cleanup and size selection | Alternative to gel extraction [26] |
| Qubit Broad Range dsDNA Assay | Life Technologies | Accurate DNA quantification | Pre-library preparation quality control | Essential for accurate input normalization [26] |
Data Acquisition and Analytical Outcomes
Impact on Downstream Analytical Capabilities
The choice between targeted and untargeted approaches fundamentally shapes downstream analytical possibilities:
Genomic Epidemiology Resolution: In the wastewater surveillance study, only targeted methods (both hybrid-capture and tiled-PCR) generated sufficient genome coverage for robust phylogenetic analysis and variant calling [25]. The untargeted shotgun approach failed to provide the consistent >90% genome coverage required for confident variant identification.
Multiplexing Capability: Hybrid-capture enrichment uniquely enabled simultaneous genomic epidemiology of multiple viral pathogens from a single sample, providing a balanced approach between specificity and target breadth [25]. This multiplexing capability is particularly valuable for surveillance applications where multiple pathogens may be of interest.
Operational Considerations: The NEBNext Ultra DNA kit demonstrated advantages in workflow efficiency, being both "slightly cheaper and faster" than the comparable TruSeq Nano kit while producing equivalent or superior sequencing data [26]. Such operational factors significantly impact practical implementation in both research and diagnostic settings.
Decision Framework for Method Selection
The following diagram outlines a systematic approach for selecting between methodological strategies based on research objectives and sample characteristics:
Figure 2: Decision framework for selecting between targeted and untargeted methodological strategies.
The comparative data clearly demonstrates that methodological selection requires careful consideration of research priorities. Targeted approaches provide superior sensitivity and reliability for known targets, with tiled-PCR offering the highest sensitivity for individual targets and hybrid-capture providing an effective balance for multiple targets [25]. Untargeted methods maintain value for discovery-phase research but require high target abundance or extensive sequencing depth for meaningful detection [25].
For researchers designing validation studies, these findings emphasize that method selection must align with explicit analytical goals. Targeted methods prove indispensable for clinical validations requiring high sensitivity and reproducibility, while untargeted strategies offer broader exploratory potential at the cost of sensitivity. As technological advancements continue to improve the sensitivity and efficiency of both approaches, their complementary application will further enhance analytical capabilities across basic research and drug development contexts.
The Analytical Target Profile (ATP) as a Guide for Method Selection
The Analytical Target Profile (ATP) is a foundational concept in modern analytical science, first formally introduced in the ICH Q14 Guideline in 2022 [28]. It serves as a prospective summary of the quality characteristics an analytical procedure must possess to be fit for its intended purpose [28]. Fundamentally, the ATP defines what the method needs to achieve—the required specificity, accuracy, precision, and range—before deciding how to achieve it through specific technologies or methodologies [29]. This paradigm shift toward a goal-oriented approach provides a structured framework for selecting the most appropriate analytical method, whether targeted or non-targeted, based on predefined objective criteria rather than conventional practices alone.
Within the context of comparing targeted and non-targeted analytical methods, the ATP acts as a crucial neutral benchmark. It frames the method selection process within a systematic, science- and risk-based approach, ensuring the chosen technique—be it targeted for specific known analytes or non-targeted for broader chemical profiling—is appropriate for the decision-making need [28]. The ATP captures the measuring requirements for critical quality attributes (CQAs), establishing the performance characteristics necessary to ensure confidence in results that will guide development, quality control, or regulatory decisions [28].
ATP's Role in the Analytical Lifecycle and Regulatory Framework
The ATP is integral to the enhanced approach for analytical procedure development described in ICH Q14, which emphasizes science- and risk-based methodologies over traditional minimal approaches [28]. It forms the foundation for the entire analytical procedure lifecycle, from initial design and technology selection through procedure performance qualification and continued performance verification [29].
Regulatory Foundation and Lifecycle Management
The implementation of ATP is guided by key regulatory and standards documents:
- ICH Q14: Provides the framework for analytical procedure development and describes the ATP as a core component of the enhanced approach [28].
- ICH Q2(R2): Focuses on the validation of analytical procedures, with the ATP serving as the basis for defining validation parameters and acceptance criteria [28] [29].
- USP Chapter 1220: Embodies the analytical procedure lifecycle concept, aligning with ATP principles for ongoing method verification and management [29].
Throughout the analytical procedure lifecycle, methods inevitably undergo changes that require evaluation. The ATP provides the stable reference point against which the impact of any change is assessed, guiding whether revalidation is needed and which performance characteristics require reassessment [28]. This structured change management process, facilitated by the ATP, enhances regulatory interactions by clearly documenting the development rationale and control strategy [28].
Core Components of an Effective ATP
A well-constructed ATP contains several critical components that collectively define the analytical requirements. The table below outlines these essential elements and their functions in guiding method selection and development.
Table 1: Core Components of an Analytical Target Profile (ATP)
| ATP Component | Description | Role in Method Selection |
|---|---|---|
| Intended Purpose | Clear statement of what the procedure must measure (e.g., quantitation of active ingredient, impurity level, biological activity) [28]. | Defines the fundamental analytical need, guiding the choice between targeted quantification or non-targeted profiling. |
| Link to CQAs | Summary of how the procedure will provide reliable results about the specific Critical Quality Attributes being assessed [28]. | Ensures the selected method delivers data relevant to product quality and safety decisions. |
| Performance Characteristics | Key parameters including accuracy, precision, specificity, linearity, range, and robustness with defined acceptance criteria [28]. | Provides measurable benchmarks for evaluating candidate methods' capabilities. |
| Reportable Range | The range of concentrations or values over which the method must provide accurate and precise results [28]. | Determines whether a method's operational range suits the application's needs. |
| Technology Selection | Description and rationale for the selected analytical technology (e.g., HPLC, LC-MS, GC-MS) [28]. | Documents the justification for choosing a particular platform based on capability to meet ATP requirements. |
Targeted vs. Non-Targeted Analysis: An ATP-Driven Comparison
The choice between targeted and non-targeted analytical strategies is fundamentally guided by the ATP's defined "Intended Purpose." Each approach serves distinct needs, with the ATP providing the objective criteria for selection based on the specific analytical question.
Defining the Approaches
Targeted analysis is an analytical approach designed to identify and quantify a specific set of known compounds. It relies on available reference standards and mass information for confirmation, making it highly reliable and straightforward to implement for defined analytes [5]. In contrast, non-targeted analysis (NTA) is an analytical approach that aims to profile chemical mixtures by detecting and identifying both known and unknown compounds without prior knowledge of the sample's complete chemical composition [5]. NTA is particularly valuable for discovering previously unidentified substances in complex matrices.
Comparative Analysis Using ATP Criteria
The following diagram illustrates how the ATP guides the decision-making process between targeted and non-targeted approaches based on the analytical objectives and sample characteristics:
Table 2: Comparative Analysis: Targeted vs. Non-Targeted Methods Through the ATP Lens
| Evaluation Parameter | Targeted Analysis | Non-Targeted Analysis (NTA) |
|---|---|---|
| Primary Objective | Accurate identification and precise quantification of predefined analytes [5]. | Comprehensive profiling to detect and identify known and unknown compounds [5]. |
| Typical Applications | Routine quality control, stability testing, assay/potency determination, specified impurity testing [28]. | Extractables & Leachables (E&L) profiling, metabolomics, impurity discovery, environmental contaminant screening [5] [30]. |
| Reference Standards | Requires authentic standards for all target analytes [5]. | Uses a representative set of reference standards to estimate response factors for unknowns [30]. |
| Data Complexity | Lower complexity; focused data analysis [5]. | High complexity; requires advanced bioinformatics tools for data interpretation [5]. |
| Quantification Capability | Absolute quantification possible with appropriate standards [5]. | Typically limited to relative quantification; semi-quantitative without authentic standards [5]. |
| Throughput | Generally higher throughput for routine analysis. | Lower throughput due to extensive data acquisition and processing requirements [5]. |
| Key Strengths | High reliability, precision, and accuracy for known compounds; regulatory familiarity [5]. | Ability to discover unexpected compounds; comprehensive sample characterization [5]. |
| Main Limitations | Limited to predefined compounds; cannot detect unknown substances [5]. | Cannot guarantee complete identification of all components; complex data interpretation [5]. |
Case Study: ATP for IVRT Method Selection
A practical application of the ATP for method selection was demonstrated in a 2024 study comparing four different In Vitro Release Test (IVRT) apparatuses for diclofenac sodium topical formulations [29]. This case study exemplifies how the ATP provides objective criteria for selecting the most appropriate technology.
Experimental Design and Methodology
The study defined an ATP specifying the required performance characteristics for the IVRT method, including accuracy, precision, and robustness [29]. Researchers then evaluated four different technologies against these ATP criteria:
- USP Apparatus II with immersion cell
- USP Apparatus IV with semisolid adapter
- Static vertical diffusion cell (Franz cell)
- In-house-developed flow-through diffusion cell (FTDC) [29]
The experimental protocol involved testing diclofenac sodium hydrogel and cream formulations across all four apparatuses using standardized conditions: maintaining temperature at 32 ± 0.5°C, using pH 7.4 phosphate-buffered saline as receptor medium, and collecting samples at predetermined time points over 6 hours [29]. Samples were analyzed using validated UHPLC methods to determine drug release rates [29].
Comparative Performance Data
Table 3: Experimental Results Comparing IVRT Apparatus Performance Against ATP Criteria [29]
| IVRT Apparatus | Cumulative Release (6h) | Precision (%RSD) | Robustness | Overall ATP Conformance |
|---|---|---|---|---|
| USP II + Immersion Cell | 19.8% | <5% | High | Best - Selected for QC method development |
| USP IV + Semisolid Adapter | 15.2% | 5-10% | Moderate | Moderate - More variable performance |
| Static Vertical Diffusion Cell | 22.1% | <5% | Moderate | Good - Similar precision but more complex operation |
| Flow-Through Diffusion Cell | 18.5% | >10% | Low | Poor - Higher variability and operational challenges |
The comprehensive data generated through this ATP-driven comparison enabled the evidence-based selection of USP Apparatus II with immersion cell as the most appropriate technology for IVRT quality control testing of the evaluated formulations [29]. This outcome demonstrates how the ATP framework facilitates objective technology selection based on fitness for purpose rather than convention alone.
Special Considerations for Non-Targeted Analysis
Implementing non-targeted analysis presents unique challenges that require specific adaptations to the ATP framework. Unlike targeted methods, NTA must accommodate the inherent uncertainty of analyzing unknown compounds.
Reference Standard Selection for NTA
For NTA, establishing an appropriate set of reference standards is critical for semi-quantification. A 2025 study proposed a systematic approach for selecting reference standards for NTA of polymer additives in medical devices, establishing six key criteria [30]:
- Reference standard availability: Candidates should be widely commercially available [30].
- Chemical relevance: Standards should align with expected E&L profiles [30].
- Chemical stability: Standards must be stable and readily detectable under analysis conditions [30].
- Toxicological coverage: Inclusion of chemicals with diverse toxicological profiles [30].
- Frequency of use: Prioritization of chemicals with broader applications and higher detection likelihood [30].
- Analytical compatibility: Physicochemical properties must fall within detectable ranges of GC-MS and LC-MS techniques [30].
This approach led to a curated set of 106 reference standards encompassing diverse physicochemical properties and toxicological concerns, enabling more reliable semi-quantification in NTA [30].
Uncertainty Factors in NTA
In NTA, the Uncertainty Factor (UF) is a critical parameter that addresses analytical variability when estimating concentrations of unknown compounds. The UF is calculated using the formula:
$${UF} = \frac{1}{(1-{RSD})}$$
where RSD is the relative standard deviation of the response factors from the reference standard database [30]. Proper selection of reference standards directly impacts the RSD value, which in turn affects the Analytical Evaluation Threshold (AET) - the concentration above which E&L must be identified and quantified [30]. An inappropriate reference standard set can underestimate the UF, potentially leading to underreporting of toxicologically significant compounds [30].
Essential Research Reagents and Materials
Successful implementation of analytical methods, whether targeted or non-targeted, requires specific high-quality reagents and materials. The following table details essential items for conducting these analyses based on the cited experimental work.
Table 4: Essential Research Reagents and Materials for Analytical Method Development
| Reagent/Material | Specification/Function | Application Context |
|---|---|---|
| Reference Standards | High-purity chemical substances for instrument calibration and quantification [30]. | Required for both targeted method validation and establishing response factors in NTA. |
| Internal Standards | Stable isotopically labeled compounds for signal normalization and improved accuracy [30]. | Used in both targeted and non-targeted LC-MS/GC-MS methods to correct for variability. |
| HPLC/MS Grade Solvents | High-purity solvents (methanol, acetonitrile, water) with minimal interference [29]. | Mobile phase preparation for chromatographic separation in LC-MS methods. |
| Artificial Membranes | MCE filters (0.22 µm pore size) for release rate studies [29]. | IVRT apparatus assembly for topical formulation testing. |
| Buffer Components | Salts for phosphate-buffered saline (PBS) at physiological pH [29]. | Receptor medium preparation for release tests and bio-relevant extraction studies. |
| Protein Precipitation Reagents | Solvents or agents for removing proteins from biological matrices [5]. | Sample preparation for complex matrices in bioanalytical NTA. |
| Solid Phase Extraction (SPE) Sorbents | Stationary phases for extracting, concentrating, and cleaning up analytes from complex samples [5]. | Sample preparation to enhance sensitivity and reduce matrix effects. |
The Analytical Target Profile provides a systematic, science-based framework that guides the selection of analytical methods with objective criteria rather than convention. By clearly defining requirements before selecting technologies, the ATP ensures the chosen method—whether targeted for precise quantification of known entities or non-targeted for comprehensive profiling—is fit-for-purpose for its specific decision-making context.
The comparative analysis presented demonstrates that targeted and non-targeted approaches serve complementary roles in the analytical toolkit. The ATP serves as the crucial decision-making framework that aligns analytical capabilities with project goals, regulatory requirements, and ultimately, product quality and patient safety. As analytical science continues to evolve with increasingly complex challenges, the ATP provides the stable foundation for evaluating and selecting appropriate methodologies based on their ability to deliver reliable, meaningful data.
In modern analytical science, the choice between targeted and non-targeted methods represents a fundamental strategic decision for researchers. Targeted analysis focuses on the precise identification and quantification of a predefined set of analytes, delivering high precision for specific questions. In contrast, non-targeted approaches aim to comprehensively capture all measurable components in a sample without prior selection, enabling hypothesis-free discovery and the detection of unexpected patterns. This guide objectively compares these methodologies across three critical applications: biomarker discovery, exposomics, and food fraud detection, providing experimental data and protocols to inform methodological selection.
The core distinction lies in their analytical focus. Targeted methods validate known entities with high precision, answering "how much" of a specific substance is present. Non-targeted methods screen for unknown patterns or markers, answering "what is different" between sample groups. Each approach demands distinct validation strategies, with targeted methods requiring rigorous quantification standards and non-targeted methods needing robust model validation to ensure pattern recognition reliability.
Comparative Performance Data
Table 1: Performance Comparison of Targeted vs. Non-Targeted Methods Across Applications
| Performance Metric | Targeted Methods | Non-Targeted Methods |
|---|---|---|
| Analytical Focus | Predefined, specific analytes [31] | Comprehensive, hypothesis-free [32] [33] |
| Primary Application | Quantification, compliance testing [31] | Discovery, authenticity testing, fingerprinting [34] [32] |
| Typical Output | Concentration values [31] | Spectral patterns, statistical models [34] [32] |
| Sensitivity | Comprehensive LOD/LOQ determination [31] | Confirmatory of published sensitivity [31] |
| Quantification Accuracy | High precision [31] | Moderate assurance [31] |
| Implementation Speed | Slower (weeks/months) [31] | Rapid (days) [31] |
| Method Flexibility | Highly adaptable [31] | Limited to validated model scope [31] [34] |
| Data Complexity | Manageable, structured [31] | High-dimensional, requires specialized bioinformatics [35] [36] |
Table 2: Application-Specific Validation Criteria and Experimental Findings
| Application & Context | Validation Approach | Key Experimental Findings | Statistical Performance |
|---|---|---|---|
| Biomarker Discovery(Clinical Diagnostics) | Analytical validation per CLSI guidelines; Clinical validation for outcomes [37] | AI-powered discovery cuts timelines from 5+ years to 12-18 months [37] | Requires AUC ≥0.80, sensitivity/specificity typically ≥80% [37] |
| Exposomics(Dried Blood Spot Analysis) | Optimized LC-HRMS workflow evaluating extraction efficiency & matrix effects [38] | Acceptable recoveries (60–140%) and reproducibility (median RSD: 18%) for majority of >200 xenobiotics [38] | Matrix effects showed median value of 76% (median RSD: 14%) [38] |
| Food Fraud(NMR-based Food Authentication) | Validation of NMR-based non-targeted protocols for multi-lab reproducibility [32] | Technique allows comparison of spectra across different instruments and laboratories [32] | Collaborative datasets enable reliable classification models [32] |
Biomarker Discovery: From Analytical Validation to Clinical Utility
Experimental Protocols
Targeted Biomarker Validation Protocol:
- Precision Evaluation: Perform repeat measurements of biomarkers to achieve a coefficient of variation under 15% [37].
- Recovery Assessment: Spike samples with known biomarker quantities to demonstrate recovery rates between 80-120% [37].
- Correlation Analysis: Compare results against reference standards to attain correlation coefficients above 0.95 [37].
- Inter-laboratory Study: Validate assay performance across multiple sites with different equipment and technicians [37].
Non-Targeted Biomarker Discovery Protocol:
- Sample Preparation: Use minimally processed biological samples (e.g., plasma, urine) to preserve molecular integrity [36].
- LC-HRMS Analysis: Perform liquid chromatography-high resolution mass spectrometry with untargeted data acquisition [38].
- Data Preprocessing: Apply peak picking, alignment, and normalization to raw data [36].
- Multivariate Analysis: Utilize unsupervised (PCA, clustering) and supervised (ML algorithms) methods to identify discriminatory features [36].
- Biomarker Identification: Match significant features to chemical databases and validate identities with reference standards [36].
Workflow Visualization
Biomarker Discovery Pathway
Exposomics: Comprehensive Exposure Assessment
Experimental Protocols
Targeted Exposomics Protocol for Known Chemicals:
- Sample Extraction: Employ optimized extraction protocols for specific chemical classes (e.g., PFAS, pesticides, mycotoxins) [38].
- Internal Standard Addition: Spike samples with isotopically labeled standards before extraction to correct for matrix effects [38].
- LC-HRMS Analysis with Targeted MS/MS: Use scheduled multiple reaction monitoring for high sensitivity quantification [38].
- Matrix Effect Evaluation: Calculate matrix effects by comparing standards in solvent versus matrix extracts; acceptable range: 60-140% [38].
Non-Targeted Exposomics Protocol:
- Comprehensive Sample Preparation: Use minimal sample cleanup to retain diverse chemical features [33].
- High-Resolution Mass Spectrometry: Acquire data in full-scan mode with fragmentation to enable compound identification [33].
- Wide Mass Range Analysis: Scan broad mass range (e.g., 50-1000 m/z) to capture diverse exposures [33].
- Data Processing with Feature Detection: Use software (e.g., XCMS, MS-DIAL) to detect chromatographic peaks and align across samples [33].
- Compound Annotation: Search experimental spectra against mass spectral libraries (e.g., NIST, HMDB) and apply in-silico fragmentation tools [33].
Workflow Visualization
Exposomics Research Workflow
Food Fraud Detection: Authenticity and Traceability
Experimental Protocols
Targeted Food Authentication Protocol:
- Marker Selection: Identify specific chemical markers indicative of authenticity (e.g., isotopic ratios, specific compounds) [34].
- Reference Material Analysis: Establish expected ranges for authentic samples through analysis of verified reference materials [34].
- Method Validation: Determine accuracy, precision, LOD, LOQ, and linearity for each marker [31].
- Sample Classification: Compare sample results to established ranges to determine authenticity likelihood [34].
Non-Targeted Food Authentication Protocol:
- Authentic Reference Collection: Assemble a comprehensive set of authentic samples with verified provenance [34] [32].
- Spectroscopic Fingerprinting: Acquire NMR or MS spectral data from reference samples using standardized protocols [32].
- Data Preprocessing: Apply spectral alignment, normalization, and scaling to minimize technical variation [32].
- Predictive Model Building: Use machine learning (e.g., PCA-LDA, random forests) to build classification models from reference data [34].
- Model Validation: Test model performance with independent sample sets and monitor ongoing performance with quality control samples [34] [32].
Workflow Visualization
Food Authentication Decision Path
The Scientist's Toolkit: Essential Research Reagents and Materials
Table 3: Key Research Reagent Solutions for Targeted and Non-Targeted Applications
| Reagent/Material | Function | Application Examples |
|---|---|---|
| Stable Isotope-Labeled Standards | Internal standards for quantification; correct for matrix effects and recovery [38] | Targeted exposomics (quantification of xenobiotics); Targeted biomarker validation [38] [37] |
| Authentic Reference Materials | Certified samples for method validation and model training [34] [32] | Non-targeted food authentication (building spectral libraries); Targeted method calibration [34] [32] |
| Quality Control Pools | Long-term monitoring of analytical system stability; quality assurance [37] | All applications (inter-laboratory studies, longitudinal project monitoring) [37] |
| Sample Preparation Kits | Standardized protocols for specific matrices (e.g., DBS extraction, plasma deproteinization) [38] | Exposomics (DBS analysis); Biomarker discovery (serum/plasma processing) [38] |
| Chromatography Columns | Compound separation tailored to chemical properties of analytes [38] | All LC-MS applications (reverse-phase, HILIC, specific column chemistries) [38] |
| Mass Spectrometry Reagents | Calibration standards, tuning solutions, mobile phase additives [38] | All MS-based applications (instrument calibration and optimization) [38] |
Leveraging High-Resolution Mass Spectrometry (HRMS) and Advanced Chromatography
In the field of modern analytical science, particularly within drug development and environmental monitoring, the choice between targeted and non-targeted analysis represents a fundamental strategic decision. Targeted methods are designed for precise quantification of known analytes, while non-targeted approaches aim to comprehensively profile complex mixtures for both known and unknown components. The integration of High-Resolution Mass Spectrometry (HRMS) with advanced chromatography has significantly enhanced capabilities in both domains, offering researchers powerful tools to address diverse analytical challenges.
HRMS provides exceptional mass accuracy, typically within 5 ppm or better, and high resolution, enabling the discrimination of compounds with minute mass differences that are indistinguishable with unit-mass resolution instruments [39]. This technique, particularly when coupled with liquid chromatography (LC), has become indispensable for applications ranging from pharmaceutical impurity profiling to environmental contaminant discovery [40]. The selection between targeted and non-targeted approaches directly influences experimental design, validation requirements, and data interpretation strategies, with each offering distinct advantages for specific research objectives.
Technical Comparison: Targeted vs. Non-Targeted Analysis
The fundamental differences between targeted and non-targeted analytical approaches extend beyond their basic definitions to encompass distinct experimental designs, data acquisition strategies, and validation requirements.
Targeted analysis focuses on predetermined analytes with known identities, utilizing optimized methods for specific compounds. This approach employs selected reaction monitoring (SRM) or parallel reaction monitoring (PRM) on triple quadrupole or Orbitrap instruments for maximum sensitivity and reproducibility [39] [41]. It requires authentic reference standards for method development and validation, with data acquisition tailored to specific precursor-product ion transitions.
In contrast, non-targeted analysis (NTA) aims to comprehensively detect both known and unknown compounds in a sample without predetermined targets. This approach uses data-dependent acquisition (DDA) or data-independent acquisition (DIA) to capture full-scan HRMS data, enabling retrospective data mining and hypothesis generation [5]. NTA leverages high-resolution full-scan data to facilitate compound identification through accurate mass measurement, isotope pattern matching, and fragmentation spectrum interpretation.
Table 1: Fundamental Characteristics of Targeted vs. Non-Targeted Approaches
| Characteristic | Targeted Analysis | Non-Targeted Analysis |
|---|---|---|
| Analytical Focus | Known, predefined analytes | Known and unknown compounds |
| Acquisition Mode | SRM, PRM, SIM | Full-scan, DDA, DIA |
| Standard Requirements | Authentic reference standards | May use suspect lists or library spectra |
| Identification Confidence | High (with standards) | Variable (library matching, prediction) |
| Primary Output | Quantitative results | Semi-quantitative or relative quantification |
| Data Complexity | Low to moderate | High |
| Key Applications | Regulatory compliance, pharmacokinetics, quality control | Biomarker discovery, impurity profiling, environmental screening |
Performance Metrics and Experimental Data
Quantitative Performance in Targeted Applications
Targeted HRMS methods demonstrate exceptional performance for quantitative applications, with rigorous validation following established guidelines. In pharmaceutical impurity testing, a validated LC-HRMS method for quantifying peptide-related impurities in teriparatide achieved accuracy of 95 ± 1% recovery with excellent precision [41]. The method exhibited linear response across relevant concentration ranges and achieved remarkable sensitivity with lower limits of quantification (LLOQ) of 0.02-0.03% of the main active ingredient, well below the regulatory reporting threshold of 0.10%.
In environmental monitoring, a recently developed SPE-LC-HRMS method for Persistent Mobile Organic Compounds (PMOCs) simultaneously analyzed 66 target compounds with recoveries of 70-120% and excellent linearity (r² > 0.997) for all analytes [42]. This method was validated according to European directives (2002/657/EC and SANTE 11,813/2017), demonstrating the reliability of modern HRMS for multi-analyte determination in complex matrices.
Identification Capabilities in Non-Targeted Workflows
Non-targeted HRMS approaches face different challenges, particularly in compound identification where retention time (RT) prediction plays a crucial role. Recent evaluations of RT projection and prediction models across 37 chromatographic systems revealed that accuracy is directly linked to the similarity of chromatographic systems, with pH of the mobile phase and column chemistry being most impactful [43]. For structurally similar compounds, high-resolution MS/MS spectra provide the most discriminating power, but RT remains valuable for prioritization when spectral libraries yield multiple candidate structures.
Table 2: Performance Metrics of HRMS in Different Application Scenarios
| Application | Key Performance Metrics | Experimental Results | Validation Guidelines |
|---|---|---|---|
| Pharmaceutical Impurity Testing | Accuracy, Precision, LLOQ | 95% accuracy, 0.02% LLOQ | ICH guidelines [41] |
| Environmental PMOC Monitoring | Recovery, Linearity, Multi-analyte | 70-120% recovery, r² > 0.997 for 66 compounds | European directives (2002/657/EC) [42] |
| Retention Time Prediction | RMSE, Generalizability | Performance dependent on CS similarity [43] | NORMAN interlaboratory comparison |
| Stability Assessment | Selectivity, Sensitivity | Enabled identification of esterification in sample prep [39] | Regulated bioanalytical validation |
Method Validation Frameworks
The validation requirements for targeted and non-targeted methods differ significantly, reflecting their distinct purposes and data quality objectives.
Targeted Method Validation
For targeted methods, validation follows established regulatory guidelines requiring demonstration of specificity, accuracy, precision, linearity, range, and robustness [44] [41]. Acceptance criteria should be established relative to the product specification tolerance rather than traditional measures like % CV or % recovery alone [44]. Recommended acceptance criteria include:
- Repeatability: ≤25% of tolerance for analytical methods, ≤50% for bioassays
- Bias/Accuracy: ≤10% of tolerance
- LOD/LOQ: LOD ≤10% of tolerance, LOQ ≤20% of tolerance [44]
Non-Targeted Method Qualification
Non-targeted methods require alternative validation approaches, often described as "qualification" rather than validation. Key parameters include specificity, sensitivity, reproducibility, and identification confidence [5]. As noted in recent literature, "Determining the frequency of false negative results is a challenge in NTA because, in the absence of analytical standards, it is hard to establish at the outset whether a compound has been sufficiently recovered during the analytical process or is not ionized as expected" [5]. This highlights the fundamental methodological challenge in properly validating methods for unknown compounds.
Experimental Workflows and Protocols
Targeted Workflow for Peptide Impurity Quantification
A representative targeted method for quantifying peptide-related impurities in teriparatide demonstrates a rigorous pharmaceutical application [41]:
Sample Preparation: Minimal processing of drug product solution; use of isotope-labeled teriparatide as internal standard.
LC Conditions: Reversed-phase chromatography with C18 column (2.1 × 150 mm, 3.6 μm); gradient elution with water-acetonitrile containing 0.1% formic acid; flow rate 0.3 mL/min.
HRMS Analysis: Q-Exactive Orbitrap mass spectrometer; full scan MS at resolution 70,000; data-dependent MS/MS at resolution 17,500; electrospray ionization in positive mode.
Data Processing: External calibration curves constructed from impurity-to-teriparatide peak area ratio versus known impurity abundance; quantification using one isotopic peak per peptide.
Validation Assessment: Specificity, linearity, accuracy, precision, LOD, LOQ determined for each impurity, meeting ICH requirements [41].
Non-Targeted Workflow for Suspect Screening
Non-targeted screening of environmental samples illustrates the comprehensive approach needed for unknown identification [43] [5]:
Sample Preparation: Solid-phase extraction (SPE) using optimized cartridges to capture broad chemical space; careful consideration of pH and solvent composition to maximize compound recovery.
LC-HRMS Analysis: Reversed-phase or HILIC chromatography depending on analyte polarity; full-scan HRMS data acquisition at resolution >25,000; data-dependent MS/MS for detected features.
Feature Detection: Automated peak picking, alignment, and componentization using software tools; blank subtraction to remove background interference.
Compound Identification: Database searching using accurate mass (±5 ppm) and isotope patterns; MS/MS spectrum matching against experimental or in silico libraries; retention time prediction models to rank candidate structures.
Confidence Assessment: Application of confidence levels (e.g., confirmed, probable, tentative) based on available evidence; manual verification of key identifications.
Essential Research Reagents and Materials
Successful implementation of HRMS methods requires specific reagents and materials optimized for different applications.
Table 3: Essential Research Reagent Solutions for HRMS Applications
| Reagent/Material | Function | Application Examples |
|---|---|---|
| Isotope-Labeled Internal Standards | Correct for variability in sample preparation and ionization | Teriparatide quantification (Leu-7, 13C615N, Val-21, 13C515N) [41] |
| Specialized SPE Cartridges | Extract and concentrate analytes from complex matrices | PMOC analysis from aqueous samples [42] |
| HILIC and Reversed-Phase Columns | Separate compounds based on polarity | Complementary retention mechanisms for different compound classes [42] [43] |
| Reference Standards | Method calibration, identification confirmation | Peptide impurity standards for teriparatide method validation [41] |
| Mobile Phase Additives | Modify chromatography, enhance ionization | Formic acid, ammonium formate, ammonium acetate [45] [41] |
| Stabilizing Reagents | Prevent analyte degradation during sample preparation | Isopropyl alcohol to prevent esterification [39] |
The strategic selection between targeted and non-targeted analytical approaches depends fundamentally on the research objectives, with each offering distinct advantages. Targeted HRMS methods provide exceptional quantitative performance, regulatory compliance, and sensitivity for known compounds, making them indispensable for pharmaceutical quality control and regulatory monitoring. Non-targeted HRMS approaches offer comprehensive compound discovery capabilities, making them valuable for biomarker identification, impurity profiling, and environmental suspect screening.
The continuing advancement of HRMS instrumentation, coupled with improved chromatographic separations and data processing tools, is further blurring the boundaries between these approaches. Modern HRMS systems can simultaneously acquire both qualitative full-scan data for non-targeted screening and highly quantitative data for targeted analysis, providing researchers with increasingly comprehensive analytical capabilities. As these technologies continue to evolve, the integration of targeted and non-targeted approaches will likely provide the most powerful framework for addressing complex analytical challenges in drug development and environmental research.
Navigating Challenges: Pitfalls and Solutions in Both Arenas
Managing Matrix Effects and Achieving Broad Metabolomic Coverage in NTA
Non-targeted analysis (NTA) represents a paradigm shift in analytical chemistry, enabling the comprehensive profiling of chemical mixtures without prior knowledge of their composition. Unlike targeted approaches that quantify specific predefined analytes, NTA aims to detect and identify a broad range of unknown compounds present in complex samples [5]. This capability makes NTA particularly valuable for discovering unknown impurities, metabolites, and environmental pollutants across pharmaceutical, biological, and environmental samples [5]. However, the transition from targeted to non-targeted workflows introduces significant methodological challenges, primarily centered on managing matrix effects and achieving comprehensive metabolome coverage.
The fundamental challenge in NTA stems from its ambitious scope: to characterize as much of the chemical space as possible within a given sample. This "detectable space" is influenced by multiple analytical considerations, including sample matrix type, extraction methodologies, instrumentation platforms, and ionization parameters [46]. Matrix effects—where co-eluting compounds interfere with ionization efficiency—pose particular problems in NTA because without a priori knowledge of all sample components, it becomes impossible to fully anticipate or control for these interferences [5]. Simultaneously, achieving broad metabolomic coverage requires careful balancing of extraction selectivity with comprehensiveness, as no single extraction method or analytical platform can capture the entire chemical diversity present in complex biological matrices [5] [46].
This comparison guide examines the performance of NTA in managing these core challenges relative to targeted approaches, providing researchers with experimental data and methodologies to inform their analytical strategies.
Analytical Foundations: Targeted vs. Non-Targeted Approaches
The distinction between targeted and non-targeted analysis begins with their fundamental objectives. Targeted analysis employs selective measurement of predefined analytes using optimized conditions for specific compounds, while NTA attempts to comprehensively characterize sample composition without prior knowledge of chemical content [47]. This philosophical difference creates divergent technical requirements and performance characteristics.
Table 1: Fundamental Differences Between Targeted and Non-Targeted Approaches
| Analytical Aspect | Targeted Analysis | Non-Targeted Analysis |
|---|---|---|
| Primary Objective | Quantification of known analytes | Discovery and identification of unknowns |
| Method Development | Optimized for specific compounds | Generalized for broad chemical classes |
| Sample Preparation | Selective clean-up for target analytes | Comprehensive extraction with minimal selectivity |
| Data Acquisition | Focused monitoring of predefined ions | Full-scan data collection without filtering |
| Calibration | Absolute quantification with external standards | Relative quantification or semi-quantitation |
| Coverage Scope | Limited to predefined targets | Potentially expansive but incomplete |
| Matrix Effects | Can be corrected with internal standards | Difficult to predict or correct comprehensively |
In practice, NTA employs high-resolution mass spectrometry (HR-MS) with liquid or gas chromatography (LC or GC) to separate and detect thousands of chemical features in a single analysis [5] [46]. The resulting data provides a "metabolomic fingerprint" characteristic of a particular biochemical phenotype [48]. This approach is particularly valuable for functional genomics and discovering novel biomarkers, as it can reveal previously unknown metabolic alterations in response to disease, toxins, or genetic variations [48].
Experimental Comparison: Performance Metrics and Data
Diagnostic Sensitivity and Metabolite Detection
Clinical validation studies directly comparing targeted and untargeted approaches provide critical performance metrics. One comprehensive study examining 51 diagnostically-relevant metabolites across 87 patients with confirmed inborn errors of metabolism (IEMs) found that global untargeted metabolomics (GUM) demonstrated 86% sensitivity (95% CI: 78-91) compared to traditional targeted metabolomics (TM) for detection of established biomarkers [48].
Table 2: Performance Comparison in Clinical Diagnostic Settings
| Performance Metric | Targeted Metabolomics | Untargeted Metabolomics |
|---|---|---|
| Sensitivity for Known IEMs | Reference method (100%) | 86% (78-91% CI) |
| Concordance for Specific Metabolites | Reference method | 50% (range: 0-100%) |
| Additional Biomarker Discovery | Limited to predefined targets | Capable of novel biomarker detection |
| Sample Throughput | Higher due to focused analysis | Lower due to complex data processing |
| Diagnostic Yield in Undiagnosed Cases | Low for non-specific phenotypes | 0.7% in patients without established diagnosis |
| Functional Genomics Utility | Limited | Valuable for VUS validation |
The same study revealed important pattern differences in detection capabilities across metabolic disorder categories. For organic acid disorders, GUM successfully detected all key metabolites in propionic and methylmalonic acidemias, though it occasionally failed to detect specific biomarkers like isovalerylglycine in isovaleric acidemia and homogentisic acid in alkaptonuria [48]. For amino acid disorders, both approaches successfully identified relevant metabolites in conditions including phenylketonuria, tyrosinemia type I, and non-ketotic hyperglycinemia [48].
Platform Considerations and Chemical Space Coverage
The analytical platform significantly influences the "detectable space" in NTA. A review of 76 NTA studies revealed that 51% used only LC-HRMS, 32% used only GC-HRMS, while just 16% utilized both platforms complementary [46]. This platform selection directly determines which chemical classes will be detectable.
Table 3: Analytical Platform Influence on Chemical Space Coverage
| Platform Configuration | Percentage of Studies | Primary Chemical Classes Detected |
|---|---|---|
| LC-HRMS Only | 51% | PFAS, pharmaceuticals, polar metabolites |
| GC-HRMS Only | 32% | Pesticides, PAHs, volatile and semi-volatile compounds |
| Both LC/GC-HRMS | 16% | Expanded coverage across chemical spaces |
| Direct Injection | 1% | High-throughput but no chromatographic separation |
For LC-HRMS methods, ionization mode selection further impacts coverage. Among the reviewed studies, 43% used both positive and negative electrospray ionization (ESI+ and ESI-), while 18% used only ESI+ and 22% used only ESI- [46]. This methodological variation highlights how platform selection and configuration inherently limit the detectable chemical space in any NTA study.
Methodological Protocols: Experimental Workflows
Sample Preparation Strategies
Effective NTA requires sample preparation that balances comprehensive metabolite extraction with minimal matrix interference. Conventional techniques like protein precipitation, liquid-liquid extraction, and solid-phase extraction remain widely used, but advanced approaches offer improved performance for NTA [5].
Advanced techniques like solid-phase microextraction (SPME) and stir bar-sorptive extraction (SBSE) provide benefits including reduced analytical times, higher sensitivity, and lower solvent consumption compared to conventional methods [5]. For cellular metabolomics, careful optimization of extraction solvents is crucial, with methanolic extraction frequently providing comprehensive coverage of both polar and semi-polar metabolites [49]. The key challenge lies in minimizing analyte degradation during preparation while maintaining sufficient selectivity to prevent co-extraction of interfering matrix components [5].
Standardization in Cell Culture Metabolomics
For in vitro NTA studies using cultured cells, standardization of protocols is essential for meaningful biological interpretation. Key considerations include:
- Cell Culture Conditions: Consistent cell handling, passage numbers, and growth conditions minimize technical variability [49]
- Quenching and Extraction: Rapid quenching of metabolism followed by comprehensive extraction preserves metabolic profiles [49]
- Normalization Strategies: Data normalization to cell count, protein content, or DNA content enables cross-study comparisons [49]
Recent evidence indicates that inconsistencies in experimental procedures and reporting standards remain significant challenges in the field, highlighting the need for community-wide standardization efforts [49].
Informatics and Data Analysis Challenges
The computational workflow represents a critical component of NTA, with data processing and interpretation presenting significant challenges. Modern HR-MS instruments generate enormous datasets requiring sophisticated bioinformatics tools for feature detection, compound identification, and statistical analysis [5].
Approximately 57% of NTA studies utilize vendor software (e.g., Thermo Compound Discoverer, Agilent MassHunter), while only 7% employ open-source alternatives like MzMine, MS-DIAL, or XCMS [46]. This reliance on commercial platforms creates challenges for method standardization and reproducibility across laboratories. The Benchmarking and Publications for Non-Targeted Analysis (BP4NTA) Working Group has developed consensus definitions and reporting standards to address these challenges and improve transparency in NTA studies [50].
Confidence in compound identification remains a significant hurdle, with false positive and false negative rates difficult to quantify in the absence of analytical standards for all potential compounds [5]. The problem is particularly acute for true unknown analysis, where compounds may not be present in existing databases or spectral libraries.
The Scientist's Toolkit: Essential Research Reagents and Materials
Table 4: Essential Research Reagents and Materials for NTA
| Reagent/Material | Function in NTA | Application Notes |
|---|---|---|
| High-Purity Solvents | Sample extraction and mobile phase preparation | LC-MS grade minimizes background interference |
| Solid Phase Extraction Cartridges | Sample clean-up and concentration | Mixed-mode sorbents increase metabolite coverage |
| Derivatization Reagents | Volatilization for GC-HRMS analysis | MSTFA, BSTFA common for metabolomics |
| Stable Isotope Standards | Quality control and semi-quantitation | Not available for unknown compounds |
| Quality Control Pools | Monitoring instrumental performance | Pooled sample aliquots across study |
| Retention Index Markers | Retention time alignment | Essential for inter-sample comparison |
| Matrix-Matched Calibrants | Assessing matrix effects | Limited to known compounds |
Non-targeted analysis represents a powerful approach for comprehensive chemical characterization, but successfully managing matrix effects and achieving broad metabolomic coverage requires careful methodological consideration. The experimental data presented demonstrates that NTA can achieve high sensitivity (86%) for known metabolic disorders while maintaining discovery potential for novel biomarkers [48]. However, this comes with significant challenges in standardization, data interpretation, and platform selection that must be addressed through community-wide efforts [49] [50].
For researchers implementing NTA, strategic platform selection utilizing both LC-HRMS and GC-HRMS provides the most comprehensive chemical space coverage, though this approach is employed in only 16% of current studies [46]. Effective management of matrix effects requires advanced sample preparation techniques and careful quality control, while the computational workflow demands sophisticated bioinformatics tools and standardized reporting practices [5] [50]. As the field continues to evolve, harmonized guidelines and proficiency testing will be essential for advancing NTA from a research tool to a validated clinical and regulatory methodology [50].
Addressing Spectral Library Gaps and Confidence in Compound Identification
Confident compound identification through mass spectrometry hinges on the availability of high-quality reference spectra in spectral libraries. However, despite steady improvements in measurement methods and enhanced mass spectral libraries, the identification process remains laborious, subjective, and often successful for only a small fraction of the spectra in complex mixtures [51]. In nontargeted analysis, multiple factors including chromatographic resolution, spectral contamination, and similarity within compound classes make direct matching to reference spectra unreliable [51]. This article provides a comparative analysis of strategies and technologies designed to address critical gaps in spectral libraries and enhance confidence in compound identification, contextualized within the framework of targeted versus non-targeted method validation.
The fundamental challenge lies in the vast diversity of chemical space, particularly in fields like plant metabolomics where a single plant may produce up to 15,000 metabolites [52]. While spectral library searching has emerged as a complementary approach to conventional database searching, its success depends entirely on library coverage [53]. Without representative spectra, compounds remain unidentified regardless of spectral quality. The following sections evaluate experimental approaches to expanding library content, improving search algorithms, and validating identifications, with supporting quantitative data and methodological details.
Expanding Library Content: Comparative Approaches
Library Expansion Strategies and Their Outcomes
Diverse strategies have been employed to address spectral library gaps, each with distinct advantages and limitations. The table below summarizes quantitative data from several major initiatives:
Table 1: Comparison of Spectral Library Expansion Initiatives
| Library/Initiative | Size (Unique Compounds) | Key Features | Identification Improvements | Limitations |
|---|---|---|---|---|
| WEIZMASS [52] | 3,540 plant metabolites | Structurally diverse plant secondary metabolites; 40% novel to databases | Enabled identification of metabolites previously unreported in plants | Limited to plant metabolites; requires pure standards |
| Spectral Archives [54] | ~299 million clusters from 1.18B spectra | Groups similar spectra into consensus spectra; includes unidentified spectra | 5% more unique peptide IDs vs. database search | Computational intensity; requires clustering billions of spectra |
| GNPS Libraries [55] | Multiple specialized libraries | Community-contributed; natural products focus | Publicly accessible diverse compound coverage | Variable curation standards; uneven coverage |
| NIST 2023 EI Library [51] | 347,000 compounds with AIRI | AI-predicted retention indices for all compounds | Improved retention index correction for compounds without experimental RI | Limited novel compound coverage |
Experimental Protocols for Library Expansion
WEIZMASS Library Construction Protocol [52]:
- Standard Collection: 3,540 highly pure plant metabolites isolated from >1,400 plant species
- Pooling Strategy: Compounds pooled into 177 groups of 20 based on expected retention time to minimize co-elution
- LC-MS Analysis: High-resolution QTOF-MS with positive and negative electrospray ionization
- Data Processing: Automated spectral extraction and library entry creation with quality control
- Validation: Manual verification of automated entries achieving sensitivity of 0.94-0.97
Spectral Archives Construction via MS-Cluster [54]:
- Data Collection: ~1.18 billion spectra from diverse organisms and experimental conditions
- Similarity Computation: ~3.1×10^13 similarity calculations requiring ~9,200 CPU hours
- Clustering: Grouping of similar spectra into consensus representations
- Identification Propagation: New identifications applied to entire clusters
- Quality Assessment: Maintenance of 2% FDR across the expanding archive
Advanced Search Algorithms and Identification Confidence
Comparative Performance of Spectral Search Tools
As spectral libraries grow, efficient search algorithms become increasingly critical. The following table compares the performance of recently developed search tools:
Table 2: Performance Comparison of Spectral Library Search Algorithms
| Search Tool | Algorithmic Approach | Speed Improvement | Identification Gain | Optimal Use Case |
|---|---|---|---|---|
| msSLASH [53] | Locality-Sensitive Hashing (LSH) | 2-9X faster than SpectraST | 5% more peptides than SpectraST | Large library searches |
| Calibr [56] | Multiple similarity measures + machine learning validation | Not specified | 17.6-37.3% more peptide IDs vs. other tools | Spectrum-centric DIA data |
| NIST MS Search [51] | Identity Search with RI penalty | Baseline | Not specified | GC-EI-MS with retention index |
| Hybrid Similarity Search [51] | Combines spectral and compositional similarity | Not specified | Identifies compounds absent from libraries | Novel compound identification |
Experimental Methodologies for Search Algorithm Validation
Calibr Experimental Protocol for DIA Data [56]:
- Pseudo-MS2 Generation: DIA-Umpire 2.0 used to reconstruct pseudo-MS2 spectra from DIA data
- Spectral Preprocessing: Optimization of intensity exponent and unannotated peak down-scaling
- Multi-faceted Similarity Scoring:
- Spectral similarity (Xcorr, Kendall-Tau, library-centric cosine)
- Precursor properties (mass difference, charge state)
- Descriptive statistics (mean and standard deviation of dot products)
- Machine Learning Validation: Percolator using 19 compiled features for FDR control at 1%
- Performance Assessment: Comparison against SpectraST and Pepitome on multiple datasets
NIST Method for Complex Mixture Analysis [51]:
- Data Acquisition: GC-EI-MS of particulate organic compounds from wildland fuel combustion
- Library Searching: NIST MS PepSearch with retention-index corrected scoring
- Reverse Search Scoring: Implementation to reject contaminant peaks in query spectra
- Compound Filtering: Application of chemical knowledge (e.g., derivatization efficiency)
- Identification Assessment: Evaluation of median relative abundance as identification likelihood indicator
Enhanced Confidence Metrics and Validation Approaches
Confidence Metrics Beyond Spectral Matching
Improving confidence in compound identification requires moving beyond spectral matching alone. Recent research has developed supplementary metrics:
Table 3: Advanced Confidence Metrics for Compound Identification
| Confidence Metric | Measurement Method | Interpretation | Experimental Support |
|---|---|---|---|
| Median Relative Abundance [51] | Median of all peak abundances relative to base peak | Lower values (higher dynamic range) favor identifiable spectra | Developed from FIREX dataset; correlates with identifiability |
| Spectral Uniqueness [51] | Difference in match factors between top hits | Higher uniqueness increases probability of correct identification | Parametrized from identified spectra in complex mixtures |
| Retention Index Consistency [51] | Absolute difference between experimental and reference RI | dRI < 15 units with penalty of 50 × (dRI – 15)/15 score units | Median absolute RI deviation of 9 units for high-scoring compounds |
| Compound Ubiquity [51] | Frequency of compound appearance across samples | Context-dependent; may indicate common compounds or contaminants | Used alongside spectral uniqueness for identification confidence |
Visualization of Experimental Workflows
The following diagram illustrates a integrated workflow for addressing library gaps and enhancing identification confidence:
Experimental Workflow for Compound Identification
Conceptual Framework for Identification Confidence
The relationship between various confidence metrics and identification outcomes can be visualized as:
Factors Influencing Identification Confidence
Table 4: Essential Research Reagents and Computational Tools for Spectral Analysis
| Resource Category | Specific Examples | Function/Purpose | Implementation Considerations |
|---|---|---|---|
| Reference Libraries | WEIZMASS, GNPS Libraries, NIST EI Library | Reference spectra for compound identification | Coverage of relevant chemical space; quality of annotations |
| Spectral Search Tools | msSLASH, Calibr, SpectraST, NIST MS Search | Matching experimental to reference spectra | Algorithm efficiency; scoring sophistication |
| Data Processing Tools | MS-Cluster, DIA-Umpire 2.0 | Spectral clustering and data preprocessing | Computational requirements; parameter optimization |
| Validation Approaches | Reverse Search Scoring, Machine Learning (Percolator) | False discovery rate control and confidence estimation | Statistical rigor; feature selection for machine learning |
| Reference Standards | AnalytiCon Discovery natural products, Commercial metabolite libraries | Method development and validation | Availability; purity; structural diversity |
Based on our comparative analysis, addressing spectral library gaps and enhancing identification confidence requires a multi-faceted approach. For targeted analyses, where specific compounds are of interest, investment in relevant chemical standards for library expansion remains crucial. The WEIZMASS approach demonstrates how carefully curated, structurally diverse libraries can significantly advance identification capabilities in specialized domains [52].
For non-targeted analyses, where the chemical space is largely unknown, computational strategies like spectral archives and advanced search algorithms offer the most promise. The demonstrated improvements of 5-37% in peptide identification through these approaches [54] [56] highlight their potential to extract more information from existing data. Furthermore, the integration of multiple confidence metrics—including retention indices, spectral uniqueness, and quality measures like median relative abundance—provides a robust framework for validation across both targeted and non-targeted applications [51].
The evolving landscape of spectral analysis suggests that future advancements will come from integrated approaches that combine experimental library expansion with computational innovation, all validated through sophisticated statistical frameworks that transcend traditional spectral matching alone.
This guide compares the performance of targeted and non-targeted analytical methods in clinical and research settings, focusing on their susceptibility to false results and signal drift. The analysis is framed within a broader thesis on method validation, highlighting how the choice of approach impacts data reliability, with supporting experimental data presented for direct comparison.
In analytical science, the fundamental distinction between targeted and non-targeted approaches defines the investigation's scope and methodology.
- Targeted Analysis is a hypothesis-driven approach designed to detect, identify, and quantify a specific, predefined set of analytes. It relies on methods optimized with reference standards and is typically validated for a narrow scope of compounds [21].
- Non-Targeted Analysis (NTA) is a hypothesis-generating approach used for comprehensive fingerprinting and the discovery of unknown or unexpected compounds. It employs broad-spectrum instrumentation like high-resolution mass spectrometry (HRMS) to capture a wide array of signals without prior knowledge of their identity [21] [57].
The following table contrasts their core characteristics:
Table 1: Core Characteristics of Targeted and Non-Targeted Methods
| Feature | Targeted Analysis | Non-Targeted Analysis |
|---|---|---|
| Objective | Quantification of predefined analytes | Discovery and identification of unknowns |
| Scope | Narrow, focused | Broad, comprehensive |
| Method Development | Relies on reference standards | Often lacks reference standards |
| Data Output | Quantitative data for specific compounds | Semi-quantitative or qualitative fingerprint |
| Primary Challenge | False positives/negatives for target list | Signal drift, data complexity, and annotation |
Quantitative Data Comparison: Analytical Performance
Recent studies provide quantitative evidence of the performance gaps between standard targeted methods and more comprehensive approaches.
False Negatives in Pediatric Drug Screening
A 2025 clinical study compared standard immunoassay (a targeted screen) with mass spectrometry (MS) for pediatric urine drug testing. The findings reveal significant limitations in the standard targeted approach [58].
Table 2: Comparative False-Negative Rates in Pediatric Drug Screening
| Study Approach | Sample Size | Key Finding | Implication |
|---|---|---|---|
| Forward Approach (MS-positive samples rechecked with immunoassay) | 125 | 112 samples (~90%) contained compounds not detected by immunoassay | Standard screening misses many substances, most commonly methamphetamine and benzoylecgonine. |
| Reverse Approach (Immunoassay-negative samples rechecked with MS) | 115 | 38 samples (33%) tested positive for at least one substance via MS; 6 samples (5%) contained targeted substances missed by immunoassay. | Immunoassay yields false negatives for targeted drugs in about 1 in 20 pediatric samples. |
The study concluded that a "direct-to-mass-spectrometry" approach minimizes these risks, though it requires more labor and highly trained personnel [58].
Algorithm Performance for Correcting Signal Drift
Signal drift is a critical challenge in MS-based analyses, especially in long-term studies. Research using GC-MS over 155 days evaluated three algorithms for correcting drift in quality control (QC) samples [59].
Table 3: Performance Comparison of Signal Drift Correction Algorithms
| Algorithm | Underlying Principle | Performance & Stability | Suitability |
|---|---|---|---|
| Spline Interpolation (SC) | Segmented polynomial interpolation between data points. | Least stable performance; fluctuated heavily with sparse QC data. | Not recommended for long-term, highly variable data. |
| Support Vector Regression (SVR) | Regression to find an optimal hyperplane for prediction. | Prone to over-fitting and over-correction with large data variations. | Less stable for highly variable data. |
| Random Forest (RF) | Ensemble learning method using multiple decision trees. | Most stable and reliable correction model for long-term, highly variable data. | Optimal for long-term studies with significant instrumental drift. |
Experimental Protocols for Key Studies
Protocol: Direct-to-MS for Pediatric Drug Screening
This protocol aims to eliminate false negatives by bypassing initial immunoassay screening [58].
- Sample Collection: Collect urine samples from pediatric patients.
- Sample Preparation: Prepare urine samples for mass spectrometry analysis, which may include dilution, filtration, or derivatization.
- Mass Spectrometry Analysis: Analyze samples directly using a mass spectrometry platform (e.g., LC-MS/MS or GC-MS) capable of targeted quantification.
- Data Processing & Quantification: Use the MS data to identify and quantify a predefined panel of drugs and their metabolites. Results are compared to established cutoff concentrations.
- Result Reporting: Report definitive identified substances based on MS confirmation.
Direct-to-MS Workflow
Protocol: Correcting GC-MS Signal Drift with Quality Control
This methodology details a robust approach for normalizing long-term signal drift in GC-MS data [59].
- Establish QC Sample: Create a pooled quality control (QC) sample representative of the test samples.
- Long-Term Data Acquisition: Analyze test samples and the QC sample repeatedly over an extended period (e.g., 155 days). Record batch numbers (for instrument on/off cycles) and injection order for all runs.
- Create Virtual QC Reference: Generate a "virtual QC sample" by taking the median peak area for each component across all QC runs.
- Calculate Correction Factors: For each component in the QC runs, calculate a correction factor:
yi,k = (Peak Area in QC i) / (Median Peak Area in Virtual QC). - Model Drift Function: Use the calculated correction factors, batch numbers, and injection orders as inputs to a machine learning algorithm (e.g., Random Forest) to model the drift function for each component.
- Apply Correction: For each peak in a test sample, apply the correction factor predicted by the model based on its batch and injection order to obtain the normalized peak area.
Signal Drift Correction Workflow
Protocol: The RIM Calibration for LC-MS Signal Drift
The Retention, Intensity, and Mass (RIM) method uses a set of calibrants to correct signal drift in LC-MS analysis [60].
- Prepare Calibrants: A mixture of d4-DMED-labeled normal fatty acids (C5–C23) is used as the calibrant. These compounds provide evenly distributed retention times and a stable internal reference.
- Sample Spiking: The calibrant mixture is added to all experimental samples and standards.
- LC-MS Analysis: Run the samples using the standard LC-HRMS method.
- Calibration Model Construction: The known behavior of the calibrants is used to model and correct variations in retention time, signal intensity, and mass accuracy across the entire run.
- Data Normalization: Apply the constructed model to all analyte peaks in the dataset to generate corrected, reliable quantitative data.
The Scientist's Toolkit: Essential Research Reagents & Materials
The following reagents and materials are critical for implementing the optimized protocols discussed above.
Table 4: Key Research Reagents and Materials
| Item | Function / Description | Application Context |
|---|---|---|
| Pooled Quality Control (QC) Sample | A composite sample made by mixing aliquots of all test samples, used to monitor and correct instrumental drift. | Signal drift correction in GC-MS and LC-MS [59]. |
| d4-DMED-Labeled Fatty Acid Calibrants | A set of isotope-labeled internal standards with evenly spaced retention times, used for RIM calibration. | Correcting signal drift, mass accuracy, and retention time in LC-MS [60]. |
| Certified Reference Materials (CRMs) | Matrix-matched materials with certified concentrations of specific analytes, used for method validation. | Validating quantitative methods in targeted and non-targeted analysis [61]. |
| Virtual QC Sample | A computational reference created from the median of multiple QC runs, serving as a meta-reference for normalization. | Providing a stable reference for long-term drift correction algorithms [59]. |
| High-Resolution Mass Spectrometer (HRMS) | Instrumentation such as GC-Orbitrap or LC-QTOF that provides accurate mass data for compound identification. | Enabling non-targeted analysis and discovery of unknown compounds [57] [61]. |
The comparative data and protocols presented demonstrate a clear trade-off. Targeted methods, while quantitative and validated, are susceptible to false negatives when analytes fall below predefined cutoffs or are not on the screening panel, as evidenced by pediatric drug testing [58]. Non-targeted methods offer comprehensive discovery power but grapple with data reliability issues like signal drift, which can be mitigated with robust QC and machine learning correction models [59].
The optimal approach depends on the analytical question. For definitive quantification of a known substance list, a targeted method with a "direct-to-MS" protocol is superior. For discovery and hazard identification, non-targeted analysis is indispensable, provided it is supported by advanced data processing to ensure data integrity over time. The evolving landscape of analytical science points toward a future where these approaches are increasingly integrated, leveraging the strengths of each to provide a more complete and accurate chemical picture.
Implementing Robust Quality Assurance and Quality Control (QA/QC) Measures
This guide compares the validation of two fundamental analytical approaches in pharmaceutical development and bioanalysis: targeted methods, which quantify specific known analytes, and non-targeted analysis (NTA), which aims to detect and identify a broad range of unknown components. The comparison is grounded in experimental data and current regulatory guidelines to provide an objective framework for scientists and drug development professionals.
Targeted method validation is a well-established process for proving that an analytical procedure is suitable for its intended purpose in quantifying specific known analytes. It provides documented evidence that a method consistently produces accurate, precise, and reliable results for a defined analyte across a specified range [62]. This approach is governed by robust regulatory guidelines such as ICH Q2(R2) and is essential for quantifying active pharmaceutical ingredients (APIs), known impurities, and biomarkers in pharmacokinetic studies [62] [63].
In contrast, non-targeted analysis (NTA) represents a paradigm shift. Instead of focusing on predefined "needles in a haystack," NTA exploits all constituents of the "haystack" to profile chemical mixtures by detecting both known and unknown compounds [5] [64]. This approach is increasingly critical for discovering unknown impurities, metabolites, degradation products, and biomarkers without prior knowledge of their chemical structure [5] [57]. NTA is particularly valuable for complex challenges such as characterizing non-intentionally added substances (NIAS) in plastic food contact materials [57] and comprehensive metabolomics studies [5].
Comparative Performance Data
The core performance characteristics for targeted and non-targeted methods differ significantly in their application and validation requirements, as summarized in Table 1.
Table 1: Comparison of Key Validation Characteristics for Targeted and Non-Targeted Methods
| Performance Characteristic | Targeted Methods | Non-Targeted Methods |
|---|---|---|
| Primary Goal | Quantify known analytes [62] | Detect and identify unknown compounds [5] [64] |
| Specificity/Selectivity | Demonstrated for known analytes [62] | Broad, untargeted detection capability [5] |
| Linearity & Range | Established with calibration standards [62] | Relative quantification; absolute quantification not possible without standards [5] |
| Accuracy/Precision | Fundamental requirements [62] [63] | Focus on consistency and reproducibility of detection [64] |
| Sensitivity | Limit of detection/quantification for target analytes [62] | Method sensitivity to detect a wide range of unknowns [5] |
| Key Challenge | Method robustness and transfer [62] | Data complexity, unknown identification, false positives/negatives [5] |
Experimental Protocols and Workflows
Targeted Method Validation Protocol
The validation of a targeted method follows a structured protocol to establish key performance parameters, often guided by the Analytical Quality by Design (AQbD) approach as outlined in ICH Q14 [65].
1. Analytical Target Profile (ATP) Definition: The process begins by defining the ATP, which outlines what is being measured and the required performance criteria derived from Critical Quality Attributes (CQAs) [65].
2. Risk Assessment and DoE: A risk assessment using tools like Ishikawa diagrams or Failure Mode and Effects Analysis (FMEA) identifies factors potentially impacting method performance. Critical Method Parameters (CMPs) are then studied using Design of Experiments (DoE) to understand their effect on outputs like peak area, retention time, and tailing factor [65] [66].
3. Establishment of Method Operable Design Region (MODR): Experimental data defines the MODR, which is the multidimensional combination of method parameters that guarantee method performance. A robust set point within the MODR is selected for the final method [66].
4. Performance Validation: The method is systematically validated according to ICH Q2(R2) guidelines, assessing characteristics such as accuracy, precision, specificity, linearity, and range [62] [65]. System suitability testing (SST) is established as part of the analytical control strategy [62].
5. Comparative Testing (for Method Transfer): A "comparison of methods experiment" is performed to estimate systematic error when transferring a method. This involves analyzing a minimum of 40 patient specimens by both the test and comparative method, covering the entire working range. Data is analyzed through difference plots and statistical calculations like linear regression to estimate bias at critical decision concentrations [3].
Non-Targeted Analysis Workflow
The NTA workflow is fundamentally different, focusing on comprehensive detection and identification rather than targeted quantification [5] [57].
1. Sample Preparation and Extraction: Sample preparation is crucial and must be optimized to trap a wide range of unknown analytes. Techniques like solid-phase microextraction (SPME) or stir bar sorptive extraction (SBSE) are employed to maximize the coverage of compounds with diverse chemical properties [5].
2. Instrumental Analysis with High-Resolution Mass Spectrometry (HR-MS): Analysis typically employs techniques such as ultra-high-performance liquid chromatography (UHPLC) coupled with high-resolution mass spectrometry (HR-MS) like quadrupole time-of-flight (QTOF) or Orbitrap instruments. These platforms provide the sensitivity, selectivity, and mass accuracy needed for untargeted detection [5] [57]. Both data-dependent acquisition (DDA) and data-independent acquisition (DIA) modes are used to collect comprehensive spectral data [57].
3. Data Processing and Compound Identification: Advanced bioinformatics tools process the complex data generated. This involves using small molecule databases and computational tools to interpret HR-MS data and tentatively identify compounds, often without reference standards [5]. Suspect screening can be performed by matching data against spectral or spectra-less databases [5].
4. Validation of Non-Targeted Methods: The validation of NTMs is an emerging field. It focuses on different performance characteristics, such as the method's ability to consistently detect a wide range of compounds and correctly classify samples. This process must account for the risk of false positives and false negatives, which are challenging to quantify in the absence of analytical standards for all potential compounds [5] [64].
Workflow Visualization
The fundamental difference between the two approaches is visualized in the following workflows.
Targeted vs. Non-Targeted Analytical Workflows
Essential Research Reagent Solutions
The implementation of robust QA/QC measures relies on specific reagents, materials, and instrumentation, as detailed in Table 2.
Table 2: Key Research Reagent Solutions for Analytical Methodologies
| Category / Item | Function / Description | Primary Application |
|---|---|---|
| Chromatography | ||
| Inertsil ODS-3 C18 Column | Stationary phase for compound separation in RP-HPLC [66] | Targeted Analysis |
| UPLC BEH C18 Column | Stationary phase for high-resolution separation in UHPLC [57] | Non-Targeted Analysis |
| Mass Spectrometry | ||
| Quadrupole Time-of-Flight (QTOF) | High-resolution mass spectrometer for accurate mass measurement [5] [57] | Non-Targeted Analysis |
| Orbitrap Mass Spectrometer | High-resolution mass spectrometer for sensitive untargeted detection [5] [57] | Non-Targeted Analysis |
| Sample Preparation | ||
| Solid-Phase Microextraction (SPME) | Solvent-free extraction to concentrate diverse analytes [5] | Non-Targeted Analysis |
| Food Simulants (e.g., EtOH 95%) | Simulate migration of substances from materials like FCMs [57] | Non-Targeted Analysis |
| Data Analysis | ||
| Bioinformatics Tools | Process complex HR-MS data for compound identification [5] | Non-Targeted Analysis |
| Chemometric Software | Apply multivariate statistics (e.g., PCA) to interpret complex datasets [57] | Non-Targeted Analysis |
Targeted and non-targeted methods serve distinct but complementary roles in modern pharmaceutical analysis and drug development. Targeted methods provide the precision, accuracy, and regulatory compliance required for quantifying specific known analytes, supported by a mature validation framework. Non-targeted methods offer a powerful discovery tool for identifying unknown impurities, metabolites, and biomarkers, though their validation is more complex and focuses on detection capability and data reliability.
The choice between these approaches depends entirely on the analytical question. For routine quality control of known entities, targeted methods are irreplaceable. For investigating unknown compounds in complex matrices, NTA is indispensable. A thorough understanding of both frameworks, along with robust QA/QC measures tailored to each, is essential for generating reliable data across the drug development lifecycle.
Ensuring Reliability: Validation Pathways and Performance Benchmarking
The introduction of the ICH Q14 guideline in 2024 marks a fundamental transformation in pharmaceutical analytics, shifting the paradigm from static, one-time method validation to a dynamic, continuous lifecycle approach [67]. This revolutionary framework, integrated with the updated ICH Q2(R2), establishes a structured, risk-based model for analytical procedure development that aligns with the Quality by Design (QbD) principles already established for pharmaceutical processes [67] [68]. Unlike traditional validation, which treated method validation as a discrete event, the lifecycle approach recognizes that analytical methods must remain suitable for their intended use throughout their entire lifespan, adapting to changes in equipment, reagents, operators, and product attributes [68].
This shift is particularly significant within the context of comparing targeted versus non-targeted analytical methods. Targeted methods are designed to quantify specific predefined analytes, while non-targeted fingerprinting approaches aim to detect patterns or differences without prior focus on specific compounds [21]. The ICH Q14 framework provides the necessary structure to manage the enhanced validation complexities of both approaches through a science-based, risk-managed lifecycle model. For researchers and drug development professionals, this represents both a challenge and an opportunity: it requires new ways of thinking and working while offering greater flexibility, robustness, and regulatory alignment [67] [68].
Traditional vs. Lifecycle Approach: A Comparative Analysis
The transition from traditional validation to a lifecycle model represents more than incremental improvement; it constitutes a fundamental reimagining of how analytical methods are developed, managed, and maintained. The traditional approach treated validation as a one-time milestone conducted during regulatory submission, after which methods remained largely static [68]. This created significant limitations, including resistance to necessary improvements, difficulty in troubleshooting drifting method performance, and substantial regulatory burden for even minor modifications.
In contrast, the lifecycle approach embedded in ICH Q14 introduces a proactive, continuous framework where methods are designed for robustness from the outset and monitored throughout their operational life [67] [68]. This paradigm shift brings several strategic advantages, summarized in the table below.
Table 1: Comparative Analysis of Traditional versus Lifecycle Validation Approaches
| Aspect | Traditional Approach (Pre-ICH Q14) | Lifecycle Approach (ICH Q14) |
|---|---|---|
| Core Philosophy | One-time validation event; static documentation | Continuous verification; dynamic, knowledge-driven system [68] |
| Regulatory Flexibility | Changes often require prior approval and revalidation | Defined Method Operable Design Region (MODR) allows changes without re-approval [67] |
| Development Focus | Empirical, sequential parameter optimization | Systematic, risk-based using Design of Experiments (DoE) [67] |
| Performance Monitoring | Reactive (e.g., when failures occur) | Proactive with continuous data trending (e.g., system suitability, control charts) [68] |
| Change Management | Cumbersome, often requiring full revalidation | Streamlined, risk-based, enabled by established MODR [67] |
| Knowledge Management | Documentation focused on compliance | Data-driven control strategies with ongoing knowledge building [67] |
The fundamental difference lies in treating analytical methods as dynamic systems rather than fixed procedures. The traditional model created a "set-it-and-forget-it" mentality that failed to account for natural variations and evolving requirements over time. The ICH Q14 lifecycle model acknowledges this reality and builds a structured framework to manage it effectively, transforming validation from a regulatory hurdle into a strategic asset [68].
Targeted vs. Non-Targeted Analysis Within the Validation Lifecycle
The implementation of a lifecycle approach must account for the fundamental differences between targeted and non-targeted analytical methods. Targeted analysis investigates specific, predefined analytes using validated methods optimized for those particular compounds [21]. In contrast, non-targeted analysis aims to provide a comprehensive fingerprint or profile without prior focus on specific analytes, often used for discovery or comparative purposes [21]. The validation requirements, performance characteristics, and lifecycle management strategies differ significantly between these approaches.
Table 2: Comparison of Targeted and Non-Targeted Analytical Methods in a Lifecycle Context
| Characteristic | Targeted Analysis | Non-Targeted Analysis |
|---|---|---|
| Analytical Focus | Quantification of specific, predefined analytes [21] | Detection of patterns or differences without targeting specific compounds [21] |
| Primary Validation Parameters | Accuracy, precision, specificity, linearity, range [62] | Method robustness, discrimination power, fingerprint stability |
| Lifecycle Foundation | Analytical Target Profile (ATP) defining required performance for specific analytes [67] | Method capability profile defining required discrimination power and reproducibility |
| Critical Method Parameters | Well-defined based on chemical properties of target analytes | Often complex and interrelated, requiring multivariate assessment |
| Model Maintenance | Performance verification through system suitability testing | Ongoing assessment of fingerprint quality and model drift detection |
| Change Management | Changes within MODR do not require regulatory re-approval [67] | Model updates may require re-establishment of performance characteristics |
The concept of "fit-for-purpose" validation becomes particularly important when implementing the lifecycle approach for different method types [69]. For targeted methods, the ATP clearly defines the performance requirements for specific analytes, providing a benchmark for the entire lifecycle [67]. For non-targeted methods, the intended purpose must be translated into different performance criteria, focusing on method robustness, discrimination power, and fingerprint stability [21]. The ICH Q14 framework accommodates both approaches through its emphasis on science-based, risk-managed development and monitoring.
Relationship Between Validation Approaches
The following diagram illustrates the conceptual relationship between different analytical approaches and their validation requirements within the ICH Q14 lifecycle framework:
Implementing the Lifecycle Approach: ATP, MODR, and Control Strategy
Successful implementation of the ICH Q14 lifecycle approach requires three fundamental components: the Analytical Target Profile (ATP), Method Operable Design Region (MODR), and a continuous Analytical Procedure Control Strategy. Together, these elements create a structured yet flexible system that maintains method fitness-for-purpose throughout its operational life.
The Analytical Target Profile (ATP) serves as the cornerstone of the lifecycle approach. The ATP is a "prospective description of the required performance characteristics of an analytical procedure" [67]. In practical terms, it defines what the method needs to achieve—in terms of accuracy, precision, specificity, and other relevant criteria—without constraining the specific methodological approach. This output-oriented definition allows scientists to select the most appropriate technologies and modify methods as needed, provided they continue to meet ATP criteria [67] [68].
The Method Operable Design Region (MODR) represents "the combination of analytical procedure parameter ranges within which the analytical procedure performance criteria are fulfilled" [67]. Unlike fixed parameters in traditional methods, the MODR establishes a multidimensional space within which parameters can be adjusted without requiring regulatory re-approval. This provides laboratories with unprecedented operational flexibility to optimize methods, address supply chain issues, or implement improvements while maintaining validation status [67].
A continuous Analytical Procedure Control Strategy ensures ongoing method performance through systematic monitoring using tools such as control charts, system suitability trending, and out-of-specification/out-of-trend (OOS/OOT) result tracking [68]. This proactive monitoring provides objective evidence that methods continue to meet ATP expectations throughout their lifecycle and enables early detection of potential performance issues before they impact product quality.
The Analytical Procedure Lifecycle
The following workflow diagram illustrates the continuous nature of the analytical procedure lifecycle under ICH Q14:
Essential Tools and Reagents for Lifecycle Implementation
Implementing the ICH Q14 lifecycle approach requires both specialized tools and reagents, along with a shift in scientific mindset. The following table outlines key solutions and their functions in enabling robust lifecycle management.
Table 3: Essential Research Reagent Solutions for Analytical Lifecycle Implementation
| Tool/Reagent Category | Specific Examples | Function in Lifecycle Approach |
|---|---|---|
| Statistical Software | JMP, MODDE, Design-Expert | Enables Design of Experiments (DoE) for systematic method development and MODR establishment [67] |
| Reference Standards | Certified reference materials, pharmacopoeial standards | Provides traceable benchmarks for method validation and continuous verification [69] |
| System Suitability Reagents | Chromatographic test mixtures, resolution mixtures | Verifies system performance before and during analysis as part of continuous monitoring [62] |
| Data Management Systems | LIMS, CDS, eQMS | Maintains ALCOA+ compliant data for knowledge management and trend analysis [68] |
| Quality Control Materials | Stable, well-characterized quality control samples | Serves as ongoing performance verification tool for trend analysis and control charts [68] |
The implementation heavily relies on statistical and digital tools [67]. Design of Experiments (DoE) serves as a central methodology to systematically assess multiple parameter effects and interactions, creating robust mathematical models that define the MODR [67]. This represents a significant departure from traditional one-factor-at-a-time optimization, providing comprehensive understanding of method robustness early in development.
For bioanalytical methods, particularly those measuring biomarkers, a fit-for-purpose approach is essential [69]. Unlike pharmacokinetic assays that use fully characterized reference standards identical to the analyte, biomarker assays often face challenges with reference materials that may differ from the endogenous analyte in critical characteristics [69]. This necessitates different validation approaches focused on parallelism assessment and endogenous quality controls rather than spike-recovery studies [69].
Regulatory Implications and Future Outlook
The adoption of ICH Q14 carries significant regulatory implications that fundamentally change the sponsor-agency relationship regarding analytical procedures. Regulatory authorities now expect methods to be validated and continuously monitored in alignment with ICH Q2(R2) and Q14 principles [68]. Companies embracing this mindset benefit from enhanced inspection readiness and reduced findings related to outdated validation practices.
A major regulatory advantage of the lifecycle approach is the flexibility for post-approval changes [67]. Changes made within the established MODR do not require regulatory re-approval, significantly reducing the burden of method improvements and adaptations [67]. This facilitates continuous improvement and more agile responses to supply chain disruptions or technological advancements without compromising regulatory compliance.
Despite its significant advantages, ICH Q14 implementation presents challenges, particularly regarding the need for statistical expertise and higher initial development investment [67]. Organizations must develop or acquire specialized knowledge in Quality by Design, Design of Experiments, and multivariate statistics to fully leverage the lifecycle approach. Additionally, the initial development phase requires more comprehensive studies than traditional approaches, though this investment yields significant long-term benefits through reduced investigations, fewer failures, and streamlined changes [67] [68].
Looking forward, the ICH Q14 strategy is expected to prevail as digitalization increases and model-informed regulatory submissions become more common [67]. The guideline represents not merely a regulatory requirement but a strategic blueprint for modern, robust, and future-proof analytical procedures that can adapt to evolving scientific and regulatory landscapes [67].
ICH Q14 represents far more than a regulatory update; it constitutes a fundamental paradigm shift that redefines analytical validation as a continuous, knowledge-driven lifecycle rather than a one-time event. This enhanced approach provides a structured framework for managing both targeted and non-targeted methods through science-based, risk-managed principles that align with modern pharmaceutical quality systems.
The transition from traditional validation to a lifecycle model offers substantial benefits, including increased operational flexibility through the Method Operable Design Region, enhanced scientific robustness via systematic development using Design of Experiments, and improved regulatory alignment with contemporary expectations [67] [68]. For researchers and drug development professionals, adopting this approach represents an essential step toward building more reliable, adaptable, and future-proof analytical procedures that can maintain fitness-for-purpose throughout their entire operational life.
As the pharmaceutical industry continues to evolve toward more complex therapeutics and accelerated development timelines, the ICH Q14 lifecycle approach provides the necessary framework to ensure analytical methods remain valid, verified, and valuable assets in bringing quality medicines to patients.
In analytical sciences, particularly within pharmaceutical development and clinical toxicology, the principles of precision and accuracy form the foundation of reliable method validation. The evolving landscape of analytical techniques, especially the comparison between targeted and non-targeted methods, demands a systematic benchmarking approach. Targeted analyses provide precise quantification of predefined analytes, while non-targeted strategies aim for comprehensive detection of unknowns, creating a fundamental tension between precision and scope [70] [71].
Modern validation paradigms are shifting from theoretical performance metrics to contextual suitability, assessing whether methods perform sufficiently within their intended use environment [72]. This comparison guide systematically evaluates precision and accuracy across methodological approaches, providing experimental data and frameworks to inform analytical decision-making for researchers, scientists, and drug development professionals.
Theoretical Foundations: Defining Precision and Accuracy in Modern Contexts
Evolving Validation Frameworks
Traditional validation methodologies have primarily focused on intrinsic method performance parameters—accuracy, precision, and total analytical error (TAE). However, these approaches largely disregard the actual use environment. A 2025 perspective introduces a novel validation methodology that evaluates whether an analytical procedure performs sufficiently well when integrated into its actual context of use, aligning with USP <1033> guidelines where the Analytical Target Profile (ATP) is stated in terms of product and process requirements rather than abstract analytical procedure requirements [72].
This paradigm shift emphasizes practical applicability over theoretical performance, ensuring analytical procedures meet quality requirements in practice, not just in principle. For both targeted and non-targeted methods, this means validation must consider the specific analytical question, sample matrix, and required confidence levels.
Accuracy and Precision: Fundamental Definitions
Accuracy: The closeness of agreement between a measured value and a true reference value. In practical terms, accuracy reflects correctness and freedom from systematic error (bias).
Precision: The closeness of agreement between independent measurements obtained under specified conditions. Precision reflects reproducibility and freedom from random error.
In non-targeted analysis, these traditional concepts require adaptation. Accuracy extends beyond quantitative correctness to include confident identification of unknown compounds, while precision must account for consistent detection across diverse chemical classes [57].
Methodological Approaches: Targeted vs. Non-Targeted Analysis
Targeted Method Workflows
Targeted analyses focus on predefined analytes with known identities, optimizing conditions for specific compounds of interest. These methods employ calibration standards and internal standards for precise quantification, typically using triple quadrupole mass spectrometers operating in selected reaction monitoring (SRM) mode for maximum sensitivity [71].
The fundamental strength of targeted approaches lies in their quantitative rigor, with well-established validation protocols covering linearity, accuracy, precision, sensitivity, and specificity. This makes them indispensable for regulatory applications requiring exact concentration data.
Non-Targeted Method Workflows
Non-targeted analyses aim to comprehensively detect both known and unexpected compounds without predefined targets. These methods employ high-resolution mass spectrometry (HRMS) with full-scan data acquisition, enabling retrospective data mining and discovery of novel compounds [57] [70].
Non-targeted workflows present distinct validation challenges, as they must balance comprehensive detection with confident identification across diverse chemical space. Performance metrics must address identification confidence, detection frequency, and reproducibility in the absence of reference standards for all detectable compounds.
Comparative Workflow Visualization
The diagram below illustrates the fundamental differences in methodology and data output between targeted and non-targeted approaches:
Experimental Benchmarking: Performance Data Comparison
Quantitative Performance Metrics
Recent studies provide direct comparison data for analytical performance across methodological approaches. The following table summarizes key metrics from validation studies of targeted quantification versus non-targeted identification:
Table 1: Performance Benchmarking of Targeted vs. Non-Targeted Methods
| Performance Metric | Targeted Analysis | Non-Targeted Analysis | Experimental Context |
|---|---|---|---|
| Quantitative Accuracy | 85-115% recovery for most compounds [71] | 60-140% recovery for majority of compounds [38] | Dried blood spots, 200+ xenobiotics |
| Precision (Repeatability) | Intra-day CV <15% for all compounds [71] | Median RSD: 18% for diverse chemical classes [38] | Plasma analysis, 29 targeted compounds |
| Sensitivity | LLOQ: 0.5-5 ng/mL for cannabinoids [71] | Mean LOD: 0.25 ng/mL (min=0.05, max=5) [71] | Toxicological screening in plasma |
| Identification Capability | Predefined targets only | 132 compounds in validation [71]; expanded chemical space [38] | General unknown screening |
| Matrix Effects | Not specified | Median: 76% (median RSD: 14%) [38] | Dried blood spots, multi-class compounds |
| Throughput Considerations | Rapid analysis for limited targets | Extended data processing for identification | Full-scan HRMS with DDA/DIA |
Method Validation Protocols
Targeted Method Validation
A validated targeted approach for toxicologically relevant compounds in plasma demonstrates comprehensive validation parameters [71]:
- Sample Preparation: 200 μL human plasma with QuEChERS salts extraction and acetonitrile after internal standard addition
- Instrumentation: Orbitrap HRMS with HESI probe, nominal resolving power 60,000 FWHM
- Quantitative Validation: Linear range 5-500 ng/mL (0.5-50 ng/mL for cannabinoids) with correlation coefficients >0.99
- Precision and Accuracy: Intra- and inter-day accuracy and precision <15% for all compounds
- Specificity: No interference from matrix components in 10 different drug-free plasma samples
Non-Targeted Method Validation
For non-targeted analysis, validation approaches differ significantly. A 2025 study on dried blood spots analysis established performance parameters for exposomics [38]:
- Extraction Optimization: Four extraction protocols systematically compared for >200 structurally diverse xenobiotics
- Identification Validation: Acceptable recoveries (60-140%) and reproducibility (median RSD: 18%) for majority of compounds
- Matrix Effects Assessment: Comprehensive evaluation with median matrix effect 76% (median RSD: 14%)
- Real-life Application: Eleven exposure compounds with diverse physicochemical properties identified, several reported for the first time in DBS human biomonitoring
Analytical Workflows: Technical Implementation
Instrumentation and Data Acquisition Strategies
The core differentiation between targeted and non-targeted approaches manifests in instrumental configuration and data acquisition:
Table 2: Instrumental Configuration for Targeted vs. Non-Targeted Analysis
| Parameter | Targeted Analysis | Non-Targeted Analysis |
|---|---|---|
| Mass Analyzer | Triple quadrupole (QqQ) | Orbitrap or Q-TOF |
| Acquisition Mode | Selected Reaction Monitoring (SRM) | Full scan with DDA or DIA |
| Resolution | Unit resolution (typically) | High resolution (>60,000 FWHM) [71] |
| Mass Accuracy | Not primary concern | <5 ppm for confident identification |
| Fragmentation | Targeted CID for predefined transitions | Data-dependent or data-independent MS/MS |
| Dynamic Range | Optimized for target concentrations | Must accommodate wide concentration range |
Data Analysis Workflows
The data processing pipelines differ substantially between approaches, particularly in identification and confirmation steps:
Essential Research Reagents and Materials
Successful implementation of either analytical approach requires specific research solutions. The following table details key reagents and their functions:
Table 3: Essential Research Reagent Solutions for Analytical Method Development
| Reagent/Material | Function | Application in Targeted Analysis | Application in Non-Targeted Analysis |
|---|---|---|---|
| Stable Isotope-Labeled Internal Standards | Correction for extraction efficiency and matrix effects | Essential for precise quantification of each target | Limited to available labeled compounds for semi-quantitation |
| QuEChERS Salts | Efficient extraction and clean-up | Selective extraction of target compounds | Comprehensive extraction of diverse chemical classes [71] |
| HRMS Quality Control Standards | Mass accuracy and sensitivity monitoring | Limited use; system suitability tests | Essential for continuous mass calibration |
| Chemical Reference Standards | Compound identification and quantification | Required for all target analytes | Available for verification but not required for all detections |
| Matrix-Matched Calibrators | Compensation for matrix effects | Prepared in same matrix as samples | Challenging due to unknown identity of many features |
| Quality Control Materials | Method performance verification | Commercial QC materials for targets | In-house pooled samples for system monitoring |
| Liquid Chromatography Columns | Compound separation | Optimized for target compound resolution | Balanced separation for broad chemical space [57] |
| Mobile Phase Additives | Chromatographic performance | Tailored for target compounds | Compatible with positive/negative ESI switching |
Application Case Studies
Clinical Toxicology Implementation
A validated approach combining both targeted quantification and non-targeted screening demonstrates the hybrid potential in clinical toxicology. This method successfully identified and quantified 29 target compounds while performing untargeted screening of 132 compounds in human plasma, with a mean limit of identification at 8.8 ng/mL [71]. The application to 31 routine samples demonstrated practical utility in poisoning cases, detecting compounds beyond the original target list.
Exposomics and Metabolomics Applications
In dried blood spots analysis, an optimized LC-HRMS workflow demonstrated acceptable recoveries (60-140%) and reproducibility (median RSD: 18%) for a majority of over 200 structurally diverse xenobiotics [38]. This approach enabled identification of eleven exposure compounds in real-life samples, with several reported for the first time in DBS human biomonitoring. The complementary non-targeted analysis expanded the detectable chemical space, enabling reliable annotation of additional exposures while simultaneously identifying endogenous metabolites.
Food Contact Material Safety
Non-targeted analysis approaches have revealed significant challenges in identifying non-intentionally added substances (NIAS) in plastic food contact materials [57]. The chemical diversity of these compounds—including oligomers, degradation products, and contaminants—requires sophisticated analytical workflows. Advanced techniques like UHPLC and two-dimensional GC coupled with HRMS have enabled non-targeted approaches, though the field remains constrained by spectral library gaps and limited reference standards.
The systematic comparison of precision and accuracy across targeted and non-targeted methods reveals a fundamental trade-off: targeted methods provide superior quantitative performance for predefined analytes, while non-targeted approaches offer expanded compound coverage at the expense of quantitative rigor.
Modern analytical challenges increasingly require hybrid approaches that leverage the strengths of both methodologies. The evolving validation paradigm, emphasizing fitness-for-purpose over theoretical performance, supports this integrated approach. As articulated in current research, "shifting the focus from theoretical performance to practical applicability ensures that analytical procedures meet quality requirements in practice - not just in principle" [72].
For researchers and method developers, the selection between targeted and non-targeted approaches should be guided by the specific analytical question, required data quality objectives, and available resources. In many applications, sequential or parallel implementation of both strategies provides the most comprehensive analytical solution, combining confident quantification with expansive compound discovery.
Non-targeted analysis (NTA) represents a paradigm shift in analytical chemistry, moving from the predetermined analysis of specific chemicals to the comprehensive characterization of complex samples without prior knowledge of their chemical content [50]. In fields ranging from environmental science to food authentication and drug development, NTA has become a powerful tool for discovering unknown contaminants, characterizing data-poor compounds, and supporting regulatory decision-making [73] [50]. While qualitative NTA has seen widespread adoption for identifying previously unknown compounds, the translation of NTA data into quantitative estimates remains challenging due to significant uncertainties in quantitative interpretation [73].
The critical importance of quantification in NTA lies in its ability to bridge the gap between contaminant discovery and risk characterization [73]. Without quantitative data, NTA results cannot fully support the chemical risk assessment paradigm, which integrates hazard, dose-response, and exposure information for quantitative risk characterization [73]. Significant efforts have been made in recent years to address this quantitative gap, with various strategies emerging that range from relative quantification to advanced standard-free estimation techniques. This article systematically compares these quantification approaches, providing researchers with a clear framework for selecting appropriate methods based on their specific analytical requirements and applications.
Comparative Analysis of NTA Quantification Methods
Key Quantification Approaches and Their Characteristics
Table 1: Comparison of Primary Quantification Strategies in Non-Targeted Analysis
| Quantification Method | Quantitative Rigor | Throughput | Uncertainty Considerations | Ideal Use Cases |
|---|---|---|---|---|
| Relative Quantification | Low to Moderate | High | Limited uncertainty estimation; semi-quantitative confidence | Sample classification; priority ranking; screening studies [50] |
| Surrogate Standard-Based | Moderate to High | Moderate | Partial uncertainty estimation via surrogate recovery | Environmental monitoring; exposure assessment where some reference standards are available [73] |
| Fully Quantitative NTA (QNTA) | High | Low to Moderate | Comprehensive uncertainty estimation; accounts for experimental recovery | Chemical risk characterization; regulatory decision support [73] |
| Standard-Free Estimation | Variable | High | High uncertainty; model-dependent | Discovery-phase research; data-poor compound assessment [73] |
Performance Metrics Across Quantification Strategies
Table 2: Performance Characteristics of NTA Quantification Methods Based on Experimental Data
| Performance Metric | Relative Quantification | Surrogate Standard-Based | Fully Quantitative NTA | Standard-Free Estimation |
|---|---|---|---|---|
| Accuracy Range | ~40-200% | ~60-150% | ~80-120% | ~20-500% |
| Precision (RSD%) | 20-50% | 15-35% | 5-20% | 30-100% |
| Identification Confidence | Low to Medium (Level 3-4) | Medium to High (Level 2-3) | High (Level 1-2) | Low (Level 4-5) |
| Dynamic Range | 1-2 orders | 2-3 orders | 3-5 orders | 1-3 orders |
| Hazard Characterization Support | Limited | Provisional | Direct support | Minimal |
Experimental Protocols for NTA Quantification
Workflow for Quantitative Non-Targeted Analysis
The following workflow diagram illustrates the core experimental protocol for implementing quantification strategies in non-targeted analysis:
Detailed Methodologies for Key Quantification Approaches
3.2.1 Surrogate Standard-Based Quantification Protocol
Surrogate standard-based quantification represents a balanced approach between analytical rigor and practical implementation. The methodology involves spiking samples with chemically analogous standards that were not originally present in the sample [73]. The experimental protocol includes: (1) Selection of appropriate surrogate standards covering a range of physicochemical properties relevant to the analytes of interest; (2) Sample preparation with addition of surrogate standards prior to extraction to account for procedural losses; (3) Instrumental analysis using liquid or gas chromatography coupled to high-resolution mass spectrometry (LC/GC-HRMS); (4) Response factor calculation based on surrogate standard performance; and (5) Extrapolation of response factors to structurally similar compounds identified through NTA [73].
Critical to this approach is the careful selection of surrogate standards that match the physicochemical properties of likely identified compounds. The uncertainty estimation must account for variations in response factor extrapolation, with recent studies suggesting that uncertainty can be reduced by using multiple surrogate standards with diverse properties [73]. This method directly supports provisional risk assessments when authentic standards are unavailable for all detected compounds.
3.2.2 Standard-Free Estimation Using Computational Approaches
Standard-free estimation methodologies leverage computational models to predict analyte responses without reference standards. The experimental workflow encompasses: (1) Comprehensive compound identification using spectral library matching and in silico fragmentation; (2) Prediction of physicochemical parameters using quantitative structure-property relationship (QSPR) models; (3) Estimation of ionization efficiency based on structural features and experimental conditions; (4) Application of machine learning algorithms trained on existing chemical datasets to predict response factors; and (5) Incorporation of uncertainty estimates through probabilistic modeling [73].
The performance of standard-free approaches varies significantly based on the chemical space being investigated and the quality of the predictive models. These methods are particularly valuable in discovery-phase research where the identification of previously uncharacterized compounds precludes the use of traditional quantification approaches [73]. However, the substantial uncertainties associated with these methods limit their application in definitive risk characterization.
The Scientist's Toolkit: Essential Research Reagents and Materials
Table 3: Key Research Reagent Solutions for NTA Quantification Experiments
| Reagent/Material | Function in NTA Quantification | Application Context |
|---|---|---|
| Surrogate Standard Mixtures | Account for extraction efficiency and matrix effects in quantitative estimation | Environmental monitoring; food authentication; biological sample analysis [73] |
| Quality Control Materials | Monitor instrument performance and data quality throughout analysis | All NTA applications; essential for inter-laboratory comparisons [50] |
| Reference Spectral Libraries | Enable compound identification with confidence scoring | Unknown compound identification; suspect screening [50] |
| Retention Time Index Markers | Normalize retention times across analytical batches | LC/GC-HRMS-based NTA studies [50] |
| Blank Matrix Materials | Assess background contamination and method detection limits | All quantitative NTA applications [73] |
| Internal Standard Kits | Correct for instrument response variation | High-precision quantitative NTA studies [73] |
Analytical Framework for Method Selection
Decision Pathway for Quantification Strategy Implementation
The selection of an appropriate quantification strategy depends on multiple factors, including the study objectives, required data quality, and available resources. The following decision pathway provides a systematic approach to method selection:
Integration with Targeted Method Validation Paradigms
The evolution of NTA quantification strategies necessitates their integration with established targeted method validation frameworks. This integration requires mapping NTA performance characteristics to traditional validation parameters including accuracy, precision, specificity, and robustness [50]. The BP4NTA (Benchmarking and Publications for Non-Targeted Analysis) working group has made significant progress in establishing consensus definitions and reporting standards to facilitate this integration [50].
For quantitative NTA to gain broader acceptance in regulatory contexts, method validation must demonstrate reliability comparable to targeted approaches for specific applications. This includes establishing method detection limits, quantifying uncertainty, and demonstrating reproducibility across laboratories [73] [50]. The harmonization of NTA guidance is imperative to promote high-quality data and allow inter-study comparisons, ultimately supporting the implementation of NTA beyond the research community [50].
The landscape of quantification strategies in non-targeted analysis has evolved significantly, offering researchers multiple pathways from relative quantification to standard-free estimation. The selection of an appropriate quantification approach must be guided by the specific research objectives, required data quality, and intended application of the results. Fully quantitative NTA methods provide the highest level of analytical rigor suitable for risk characterization, while surrogate standard-based approaches offer a practical balance for many applications. Relative quantification and standard-free estimation serve important roles in screening and discovery contexts.
As the field continues to mature, ongoing harmonization efforts led by groups such as BP4NTA are critical for establishing community-wide standards and best practices [50]. The integration of NTA quantification estimates with available hazard metrics and exposure modeling represents a promising pathway for advancing chemical safety evaluation in the 21st century [73]. Through the continued refinement of quantification strategies and their validation against established targeted methods, non-targeted analysis is poised to play an increasingly important role in chemical risk assessment and regulatory decision-making.
Developing a Risk-Based Analytical Control Strategy for Method Reliability
In the pharmaceutical industry and food authenticity testing, the reliability of analytical methods is paramount. A Risk-Based Analytical Control Strategy provides a systematic framework for ensuring that analytical procedures consistently produce reportable values of the required quality. This approach is fundamentally anchored in Quality Risk Management principles, as outlined in ICH Q9, which are applied to the entire lifecycle of an analytical procedure [74]. The primary goal is to eliminate or reduce the risk to the quality of the reportable value—the product of the analytical procedure—to an acceptable level [74].
This guide objectively compares two foundational methodological paradigms—targeted and non-targeted analysis—within this risk-based control framework. Targeted methods are designed to detect and quantify one or a few pre-defined analytes, whereas non-targeted methods aim to screen for a broad range of unknown or unexpected components, providing a comprehensive fingerprint [75] [7]. The selection between these approaches has significant implications for a control strategy's scope, detection capabilities, and ultimately, its ability to control risk.
Foundational Principles of a Risk-Based Control Strategy
The development of an effective Analytical Control Strategy is a systematic process for the assessment, control, communication, and review of risks to the quality of the reportable value [74]. The following workflow illustrates the core lifecycle of Quality Risk Management as applied to analytical procedures.
FIGURE 1: Quality Risk Management Lifecycle. This diagram outlines the systematic process for managing risks to the quality of analytical reportable values, from initiation and assessment to control and review [74].
Key Stages of the QRM Process
- Risk Assessment: This initial stage involves a systematic process of risk identification, analysis, and evaluation. It aims to answer: "What might go wrong?", "What is the likelihood it will go wrong?", and "What are the consequences?" [74]. For analytical procedures, this involves understanding which variables (e.g., materials, procedure parameters, environmental conditions) affect the quality attributes of the reportable value.
- Risk Control: This includes decision-making to reduce and/or accept risks. Risk reduction focuses on processes for mitigating or avoiding risk when it exceeds an acceptable level, often by controlling critical variables identified during risk assessment. Risk acceptance is a formal or informal decision to accept residual risk [74]. It is recognized that risk cannot be completely eliminated.
- Risk Communication & Review: The sharing of information about risk and risk management between decision-makers is crucial. Furthermore, risk review should be an ongoing part of quality management, with procedure performance reviewed regularly [74].
Comparative Analysis: Targeted vs. Non-Targeted Methods
The choice between targeted and non-targeted methods is a critical strategic decision in developing an analytical control strategy. Each approach offers distinct advantages and faces specific challenges, making them suited for different applications within a risk framework.
Core Characteristics and Applications
Targeted methods are focused on the detection and quantification of one or a few pre-defined classes of known compounds. They are the traditional mainstay of quality control testing [7]. In contrast, non-targeted methods do not rely on the analysis of selected individual analytes. Instead, they aim to study a global fingerprint to detect unexpected changes or adulterations, which is particularly valuable when no information about possible adulterants is known [75].
Experimental Workflows
The fundamental difference in the application of these two approaches is illustrated in their respective experimental workflows.
FIGURE 2: Targeted vs. Non-Targeted Analytical Workflows. Targeted methods focus on specific analytes with optimized preparation, while non-targeted methods use minimal preparation to capture a broad chemical profile for pattern recognition [75] [7].
Quantitative Performance Comparison
The following table summarizes the key characteristics of both approaches, highlighting their respective strengths and limitations in the context of a risk-based control strategy.
TABLE 1: Objective Comparison of Targeted vs. Non-Targeted Analytical Methods
| Parameter | Targeted Methods | Non-Targeted Methods |
|---|---|---|
| Analytical Scope | Focused on pre-defined analytes [7] | Broad, untargeted screening of many chemical species [75] |
| Sample Preparation | Often complex and optimized for specific analytes [75] | Generally simple, aiming to preserve a wide chemical profile [75] |
| Primary Data Output | Quantitative concentration of known compounds [7] | Multivariate fingerprint or pattern for classification [75] [7] |
| Key Applications | Routine quality control, release testing, known adulterants [7] | Food fraud detection, origin verification, unknown adulterant screening [75] |
| Inherent Risk | Fails against unanticipated adulterants [75] | Can detect unanticipated deviations but requires complex data handling [7] |
| Method Validation | Well-established protocols (e.g., ICH Q2) [76] | Evolving and harmonizing validation workflows [7] |
Experimental Protocols for Method Comparison and Validation
A cornerstone of a robust control strategy is the empirical verification of method performance. This involves direct comparison studies and rigorous statistical analysis to estimate systematic error (bias) and ensure method reliability.
Protocol for Method Comparison Studies
The comparison of methods experiment is critical for assessing the systematic errors that occur with real patient specimens [3]. The following protocol ensures reliable results:
- Sample Selection and Size: A minimum of 40 different patient specimens should be tested, carefully selected to cover the entire working range of the method. The quality of the experiment depends more on a wide range of test results than a very large number of results. If possible, 100-200 specimens are recommended to assess method specificity [3] [77].
- Experimental Timeline: Analysis should be performed over a minimum of 5 days and multiple analytical runs to mimic real-world conditions and minimize systematic errors from a single run [3] [77].
- Sample Handling: Specimens should be analyzed within two hours of each other by the test and comparative methods to avoid stability-related differences. Specimen handling must be carefully defined and systematized [3].
- Measurement Procedure: Duplicate measurements are recommended to provide a check on the validity of the measurements and help identify problems from sample mix-ups or transposition errors [3].
Data Analysis and Statistical Evaluation
Appropriate statistical analysis is vital for interpreting comparison data and estimating bias accurately [77].
- Graphical Analysis: The first step in data analysis is to graph the data. Difference plots (Bland-Altman plots) or scatter diagrams should be visually inspected to identify discrepant results, outliers, and the general relationship between methods [3] [77].
- Statistical Calculations: For data covering a wide analytical range, linear regression statistics (slope, y-intercept, standard error of the estimate - s~y/x~) are preferred. They allow for the estimation of systematic error at critical medical decision concentrations and reveal the constant or proportional nature of the error [3]. The systematic error (SE) at a decision concentration (X~c~) is calculated as: SE = Y~c~ - X~c~, where Y~c~ = a + bX~c~ [3].
- Inappropriate Statistics: Correlation coefficient (r) is mainly useful for assessing whether the data range is wide enough to provide good estimates of the slope and intercept, not for judging method acceptability. t-tests are also inadequate for assessing comparability, as they may not detect clinically meaningful differences or may detect statistically significant but clinically irrelevant differences [77].
The Scientist's Toolkit: Essential Reagents and Materials
The successful implementation of a risk-based analytical strategy relies on a suite of specific reagents, software tools, and methodological approaches.
TABLE 2: Key Research Reagent Solutions and Essential Materials
| Tool Category | Specific Examples | Primary Function |
|---|---|---|
| Risk Assessment Tools | FMEA, FMECA, Cause and Effect Diagrams [74] | Systematic identification and prioritization of potential failure modes and risks in the analytical procedure. |
| Experimental Design Software | Design of Experiments (DoE) Software [74] | Enables efficient, systematic evaluation of multiple variables and their interactions to understand their impact on the reportable value. |
| Reference Materials | Certified Reference Standards [74] | Provide a traceable basis for ensuring the accuracy (trueness) and validity of quantitative measurements. |
| Chromatography Systems | GC-MS, HPLC-UV/VIS [75] | Separate complex mixtures for targeted quantification of specific analytes. |
| Spectrometry Systems | DART-HRMS, ICP-OES [75] | Enable non-targeted fingerprinting and elemental analysis for authenticity testing and impurity detection. |
| Multivariate Analysis Software | PLS-DA, OPLS-DA, PCA [75] | Process and model complex, non-targeted data to identify patterns and classify samples based on chemical fingerprints. |
| Statistical Analysis Tools | R, SPSS [78] | Perform detailed statistical analysis on both targeted and non-targeted data, from basic descriptive stats to complex modeling. |
A modern, risk-based analytical control strategy is not about choosing between targeted and non-targeted methods, but about understanding their complementary roles. Targeted analysis remains the gold standard for quantifying known critical quality attributes and impurities, providing precise, validated data for routine control [7]. Meanwhile, non-targeted methods offer a powerful safety net for detecting unknown adulterants and subtle, unanticipated variations, thereby addressing a blind spot of traditional targeted control strategies [75] [7].
The most robust strategy integrates both approaches within the Quality Risk Management lifecycle. This begins with a thorough risk assessment to identify known hazards controlled by targeted methods and acknowledges the residual risk of unknown hazards, which can be mitigated by non-targeted screening. This hybrid model, supported by rigorous method comparison protocols and a comprehensive toolkit of reagents and software, provides the highest level of assurance in method reliability and product quality.
Conclusion
The choice between targeted and non-targeted methods is not a matter of superiority but of strategic alignment with the project's core intent. Targeted methods deliver unparalleled precision and regulatory compliance for quantifying predefined analytes, while non-targeted approaches offer a powerful, open-ended discovery platform for novel biomarkers and unknown substances. The future of analytical science lies in their integrated application, guided by the ICH Q14 lifecycle approach and powered by advancements in HRMS and bioinformatics. Embracing this complementary paradigm, supported by harmonized guidelines and expanding spectral libraries, will be crucial for driving innovation in drug development, clinical diagnostics, and public health protection.
References
- 1. Recent developments in mass-spectrometry-based targeted ... [https://pmc.ncbi.nlm.nih.gov/articles/PMC10826105/]
- 2. Development, characterization and comparisons of targeted and... [https://journals.plos.org/plosone/article?id=10.1371/journal.pone.0207082]
- 3. The Comparison of Methods Experiment [https://www.westgard.com/lessons/basic-method-validation/lesson23.html]
- 4. Analytical quality control in targeted lipidomics [https://www.sciencedirect.com/science/article/pii/S0003267025006191]
- 5. Advances and challenges in non-targeted analysis [https://www.sciencedirect.com/science/article/abs/pii/S0021967324008331]
- 6. Establishing performance metrics for quantitative non-targeted ... [https://pmc.ncbi.nlm.nih.gov/articles/PMC10850229/]
- 7. The scientific challenges in moving from targeted to non ... [https://www.sciencedirect.com/science/article/pii/S0924224418302449]
- 8. Analytical Method Validation for Quality Assurance and ... [https://www.americanpharmaceuticalreview.com/Featured-Articles/569734-Analytical-Method-Validation-for-Quality-Assurance-and-Process-Validation-Professionals/]
- 9. Integrating non-target analysis and machine learning [https://www.nature.com/articles/s41545-025-00504-z]
- 10. Advancing non-target analysis of emerging environmental ... [https://www.sciencedirect.com/science/article/pii/S0160412025001552]
- 11. Development and Validation of a Non-Targeted Screening ... [https://www.mdpi.com/1424-8247/16/1/76]
- 12. Recent Trends and Challenges on the Non-Targeted ... [https://www.mdpi.com/2305-6304/13/7/543]
- 13. Development and multi-center validation of machine learning ... [https://pmc.ncbi.nlm.nih.gov/articles/PMC12604152/]
- 14. ICH Q14 Analytical procedure development - Scientific guideline [https://www.ema.europa.eu/en/ich-q14-analytical-procedure-development-scientific-guideline]
- 15. Q14 Analytical Procedure Development March 2024 [https://www.fda.gov/regulatory-information/search-fda-guidance-documents/q14-analytical-procedure-development]
- 16. An Introduction to Analytical Method Development and ... [https://www.sofpromed.com/an-introduction-to-analytical-method-development-and-validation-in-early-phase-clinical-trials]
- 17. The 6 Key Aspects of Analytical Method Validation [https://www.elementlabsolutions.com/uk/chromatography-blog/post/6-key-aspects-of-analytical-method-validation]
- 18. Validation of targeted and non-targeted methods of analysis [https://www.eurachem.org/index.php/events/completed/257-wks-ntrg2019]
- 19. A Step-by-Step Guide to Analytical Method Development ... [https://emerypharma.com/blog/a-step-by-step-guide-to-analytical-method-development-and-validation/]
- 20. Essential terminology and considerations for validation of ... [https://pubmed.ncbi.nlm.nih.gov/36845497/]
- 21. To target or not to target? Definitions and nomenclature for ... [https://www.sciencedirect.com/science/article/pii/S0924224418303741]
- 22. Essential terminology and considerations for validation of ... [https://www.sciencedirect.com/science/article/pii/S2590157522003364]
- 23. Analytical Method Development and Validation in ... [https://resolvemass.ca/analytical-method-development-and-validation-in-pharmaceuticals/]
- 24. Assessing the Impact of Measurement Precision on Metabolite ... [https://pmc.ncbi.nlm.nih.gov/articles/PMC12242904/]
- 25. Comparison of metagenomic and targeted methods for ... [https://pmc.ncbi.nlm.nih.gov/articles/PMC10746264/]
- 26. Illuminating Choices for Library Prep: A Comparison ... [https://pmc.ncbi.nlm.nih.gov/articles/PMC4237435/]
- 27. Which NGS DNA Library Prep Kit should you choose? [https://frontlinegenomics.com/which-ngs-dna-library-prep-kit-should-you-choose/]
- 28. Applying ICH Q14 in Pharmaceuticals Part 1 [https://premier-research.com/perspectives/applying-ich-q14-in-pharmaceuticals-part-1-the-application-of-analytical-target-profile-in-analytical-method-development/]
- 29. An Analytical Target Profile for the Development of an In ... [https://pmc.ncbi.nlm.nih.gov/articles/PMC10975506/]
- 30. Designing a set of reference standards for non-targeted ... [https://www.nature.com/articles/s41370-025-00788-w]
- 31. Method Validation vs Method Verification: Which is Better ... [https://www.labmanager.com/method-validation-vs-method-verification-which-is-better-for-use-in-laboratories-33982]
- 32. Validating NMR-based non-targeted methods and fostering ... [https://www.sciencedirect.com/science/article/abs/pii/S0079656525000068]
- 33. Uncovering the Exposome: An Emerging Field Casts a ... [https://undark.org/2025/06/16/uncovering-the-exposome/]
- 34. Food Fraud Testing in 2025 and Beyond With John Points of ... [https://therottenapple.substack.com/p/food-fraud-testing-in-2025-and-beyond]
- 35. Advancements in foodomics: Transformative applications ... [https://www.sciencedirect.com/science/article/pii/S2772753X25002497]
- 36. A 2025 perspective on the role of machine learning for ... [https://pubmed.ncbi.nlm.nih.gov/40772544/]
- 37. Biomarker Validation Guide 2025: Discovery to FDA Approval [https://www.motif.bio/blog/biomarker-discovery-validation-guide-2025]
- 38. Dried blood spots analysis for targeted and non- ... [https://www.sciencedirect.com/science/article/pii/S0160412025005653]
- 39. HRMS in Drug Development: An Interview with Nicholas ... [https://www.chromatographyonline.com/view/hrms-in-drug-development-an-interview-with-nicholas-ingram-of-iqvia-laboratories]
- 40. Recent Advances in Liquid Chromatography–Mass ... [https://pmc.ncbi.nlm.nih.gov/articles/PMC12204688/]
- 41. Validation of a liquid chromatography-high-resolution mass ... [https://www.sciencedirect.com/science/article/abs/pii/S0731708524006964]
- 42. Liquid chromatography-high resolution mass spectrometry ... [https://www.sciencedirect.com/science/article/pii/S2772577425000114]
- 43. Do experimental projection methods outcompete retention ... [https://pubs.rsc.org/en/content/articlehtml/2025/an/d5an00323g]
- 44. Establishing Acceptance Criteria for Analytical Methods [https://www.biopharminternational.com/view/establishing-acceptance-criteria-analytical-methods]
- 45. Development and validation of LC-HRMS and GC-NICI-MS ... [https://pmc.ncbi.nlm.nih.gov/articles/PMC3874414/]
- 46. Non-targeted analysis (NTA) and suspect screening ... [https://www.nature.com/articles/s41370-023-00574-6]
- 47. Designing a metabolomics study [https://www.ebi.ac.uk/training/online/courses/metabolomics-introduction/designing-a-metabolomics-study/]
- 48. Clinical Validation of Targeted and Untargeted ... [https://pmc.ncbi.nlm.nih.gov/articles/PMC7287104/]
- 49. Experimental design and reporting standards for ... [https://pmc.ncbi.nlm.nih.gov/articles/PMC11107723/]
- 50. An Introduction to the Benchmarking and Publications for Non ... [https://pmc.ncbi.nlm.nih.gov/articles/PMC8848292/]
- 51. New Library-Based Methods for Nontargeted Compound ... [https://pmc.ncbi.nlm.nih.gov/articles/PMC11844893/]
- 52. The WEIZMASS spectral library for high-confidence ... [https://www.nature.com/articles/ncomms12423]
- 53. A fast and memory-efficient spectral library search ... [https://pmc.ncbi.nlm.nih.gov/articles/PMC7669687/]
- 54. Extending Spectral Libraries to Analyze both Identified and ... [https://pmc.ncbi.nlm.nih.gov/articles/PMC3128193/]
- 55. GNPS Public Spectral Libraries [https://gnps.ucsd.edu/ProteoSAFe/libraries.jsp]
- 56. Calibr improves spectral library search for spectrum-centric ... [https://www.nature.com/articles/s41598-022-06026-9]
- 57. Recent Trends and Challenges on the Non-Targeted ... [https://pmc.ncbi.nlm.nih.gov/articles/PMC12299502/]
- 58. Standard drug screening fails to identify some children who ... [https://myadlm.org/media/press-release-archive/2025/07-july/standard-drug-screening-fails-to-identify-some-children-exposed-to-substances]
- 59. Correction of gas chromatography–mass spectrometry long ... [https://www.nature.com/articles/s41598-025-24794-y]
- 60. A mathematical method for calibrating the signal drift in ... [https://www.sciencedirect.com/science/article/abs/pii/S003991402100432X]
- 61. GC-Orbitrap-HRMS with ROIMCR and MSident targeted ... [https://www.sciencedirect.com/science/article/abs/pii/S0003267025012863]
- 62. Difference Between Validation And Verification Of Analytical Methods [https://gmpinsiders.com/method-validation-vs-verification/]
- 63. Precision-Driven Biomarker Validation: A Biotech ... [https://www.criver.com/eureka/precision-driven-biomarker-validation-biotech-perspective-part-i]
- 64. Essential Terminology and Considerations for Validation of... [https://www.preprints.org/manuscript/202112.0420/v3]
- 65. Challenges in Developing Analytical Procedures with the ... [https://www.pharmoutsourcing.com/Featured-Articles/621016-Challenges-in-Developing-Analytical-Procedures-with-the-New-ICH-Q14-Guideline/]
- 66. Development and validation of a novel isocratic RP-HPLC ... [https://www.sciencedirect.com/science/article/pii/S092809872500274X]
- 67. ICH Q14 and the Paradigm Shift in Pharmaceutical Analytics [https://www.gmp-journal.com/current-articles/details/ich-q14-and-the-paradigm-shift-in-pharmaceutical-analytics.html]
- 68. Analytical Method Validation Beyond the Event [https://www.qbdgroup.com/en/blog/analytical-method-validation-lifecycle-approach]
- 69. Why is Biomarker Assay Validation Different from that of ... [https://link.springer.com/article/10.1208/s12248-025-01135-5]
- 70. Editorial: Current trends in targeted and non- ... [https://www.frontiersin.org/journals/molecular-biosciences/articles/10.3389/fmolb.2025.1614399/full]
- 71. Validation of a non-targeted method devoted to ... [https://www.sciencedirect.com/science/article/abs/pii/S1570023223001496]
- 72. Beyond Accuracy, Precision and TAE: Direct assay ... [https://pubmed.ncbi.nlm.nih.gov/40830303/]
- 73. Quantitative non-targeted analysis: Bridging the gap ... [https://www.sciencedirect.com/science/article/pii/S016041202100636X]
- 74. 2 | PPTX Analytical control strategy [https://www.slideshare.net/slideshow/analytical-control-strategy-2-248334413/248334413]
- 75. Target and Non-Target Approaches for Food Authenticity and ... [https://pmc.ncbi.nlm.nih.gov/articles/PMC7830973/]
- 76. - Risk approach for based development in pharmaceutical... method [https://pubmed.ncbi.nlm.nih.gov/30145448/]
- 77. Statistical analysis in method comparison studies part one [https://acutecaretesting.org/en/articles/statistical-analysis-in-method-comparison-studies-part-one]
- 78. Qualitative vs. quantitative data analysis: How do they differ? [https://learningsciences.smu.edu/blog/qualitative-vs-quantitative-data-analysis]