Rheometer vs. Texture Analyzer: A Strategic Guide for Food Analysis in Research and Development
This article provides a comprehensive comparison of rheometers and texture analyzers for professionals in food science and research.
Rheometer vs. Texture Analyzer: A Strategic Guide for Food Analysis in Research and Development
Abstract
This article provides a comprehensive comparison of rheometers and texture analyzers for professionals in food science and research. It establishes the fundamental principles of each technique, exploring how rheology measures the flow and deformation of materials under force, while texture analysis quantifies sensory-perceptible mechanical properties. The scope includes detailed methodological insights for application-specific testing, practical guidance for troubleshooting common measurement challenges, and a framework for validating and correlating instrumental data with sensory outcomes. The synthesis of this information aims to empower scientists in selecting the optimal tool or combination of tools to enhance product development, quality control, and predictive performance in complex food systems.
Core Principles: Demystifying Rheology and Texture in Food Science
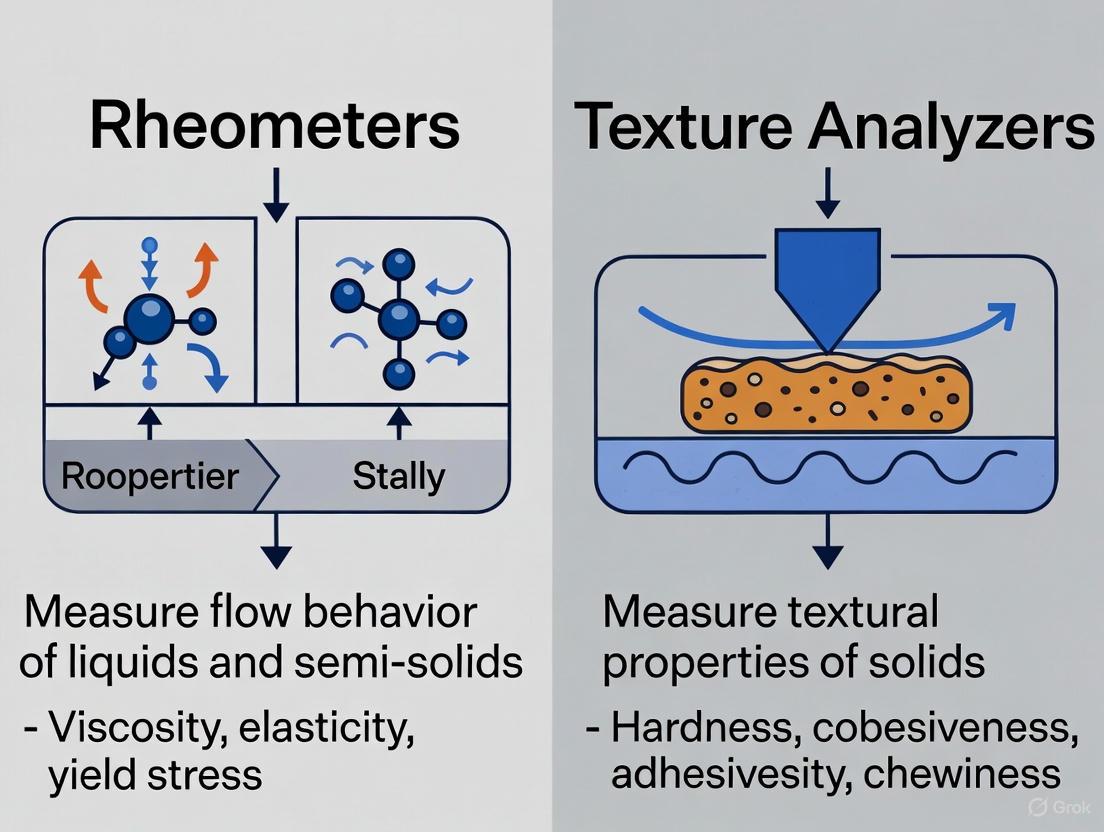
Rheology is the scientific discipline dedicated to studying the flow and deformation of matter. It quantitatively describes how materials respond to applied forces, encompassing the behavior of substances that exhibit both liquid-like and solid-like characteristics. This field is foundational for understanding fundamental material properties such as viscosity (resistance to flow), elasticity (ability to return to original shape after deformation), and yield stress (the minimum stress required to initiate flow) [1].
In the context of food analysis research, another critical concept is texture, which refers to the physical properties of a material perceived by touch, including mouthfeel. While sometimes used interchangeably with rheology, texture encompasses a distinct set of attributes, such as hardness, chewiness, crispiness, and smoothness, which are often evaluated through sensory perception or mechanical testing that simulates real-world handling and consumption [1] [2].
The choice between a rheometer and a texture analyzer is not a matter of which instrument is superior, but rather which is appropriate for the specific research question. This guide provides an objective comparison of their performance, supported by experimental data and methodologies, to aid researchers in selecting the optimal tool for their food analysis applications.
Fundamental Principles and Measured Properties
Rheometers and texture analyzers are designed based on different principles and measure distinct, though sometimes related, material properties. The table below summarizes their core characteristics.
Table 1: Fundamental Comparison of Rheometers and Texture Analyzers
| Aspect | Rheometer | Texture Analyzer |
|---|---|---|
| Core Principle | Applies controlled stress or strain to measure flow and deformation [1]. | Measures force as a function of time or distance while deforming a sample via compression or tension [3]. |
| Primary Outputs | Viscosity, shear modulus (G'), loss modulus (G"), yield stress, creep recovery [1]. | Hardness, fracturability, chewiness, springiness, cohesiveness, adhesiveness [3] [4]. |
| Sample Suitability | Ideal for homogeneous, liquid, paste-like, or gel-like samples [1]. | Handles homogeneous, heterogeneous, semi-solid, and solid samples (e.g., with chunks, beads, or layers) [1]. |
| Data Interpretation | Provides fundamental insights into material structure and molecular interactions. | Simulates consumer or mechanical interactions (e.g., biting, spreading, cutting) [1]. |
Key Property Definitions from Rheology
Rheological measurements provide deep insights into a material's internal structure:
- Viscosity: The resistance of a fluid to flow. A high-viscosity material like honey flows slowly, while a low-viscosity material like water flows easily.
- Storage Modulus (G'): Quantifies the energy stored and recovered per cycle of deformation, representing the solid-like, elastic character of a material.
- Loss Modulus (G"): Quantifies the energy dissipated or lost as heat per cycle of deformation, representing the liquid-like, viscous character of a material.
- Yield Stress: The critical stress that must be exceeded for flow to begin. This is crucial for products like toothpaste, which should not flow until squeezed from the tube.
Key Property Definitions from Texture Analysis
Texture Profile Analysis (TPA), a common test performed with a texture analyzer, quantifies several sensory attributes through a double compression test that mimics chewing [3] [4]:
- Hardness: The peak force during the first compression cycle, indicating resistance to deformation [3].
- Springiness: The degree to which a sample returns to its original height after deformation [4].
- Cohesiveness: How well the sample withstands a second deformation relative to the first, indicating its internal strength [3] [4].
- Chewiness: The energy required to masticate a solid sample to a state ready for swallowing (calculated as Hardness × Cohesiveness × Springiness) [3].
Experimental Protocols and Workflows
To illustrate the application of these instruments, this section outlines standard experimental methodologies for both rheological and texture analysis.
Rheological Characterization of a Hydrocolloid Gel
Objective: To determine the viscoelastic properties and gel strength of a carrageenan gel.
Materials & Reagents:
- Carrageenan Powder: The gelling agent whose properties are under investigation [5].
- Solvent (e.g., water or buffer): The dispersion medium.
- Rheometer: Equipped with a parallel plate or concentric cylinder geometry.
Methodology:
- Sample Preparation: Disperse a known concentration of carrageenan powder in the solvent. Heat the mixture under controlled conditions to ensure complete hydration and dissolution, then carefully load the solution onto the rheometer plate to avoid air bubbles.
- Temperature Control: Utilize the rheometer's Peltier system to cool the sample at a controlled rate to form a gel, mimicking real-world processing conditions.
- Oscillatory Amplitude Sweep: Apply an oscillatory strain of increasing amplitude at a constant frequency to determine the linear viscoelastic region (LVR) and identify the yield point where the gel structure breaks.
- Oscillatory Frequency Sweep: Within the LVR, apply a range of oscillatory frequencies to measure the storage (G') and loss (G") moduli as a function of frequency, characterizing the gel's mechanical spectrum.
- Data Analysis: Compare the values of G' and G" to determine gel dominance (G' > G" for a solid gel). The modulus values quantify gel strength, and the yield stress indicates gel stability under deformation [5].
The workflow for this rheological characterization is as follows:
Texture Profile Analysis (TPA) of a Cultured Meat Sample
Objective: To characterize the mechanical texture properties of a cultured meat product and compare it to traditional commercial meat products [4].
Materials & Reagents:
- Cultured Meat Sample: Processed into a cylindrical probe (e.g., 8mm diameter) [4].
- Control Meat Samples: Traditional products (e.g., sausage, chicken breast) prepared identically [4].
- Texture Analyzer: Fitted with a cylindrical probe and a 50 N load cell [4].
Methodology:
- Sample Preparation: Precisely cut the samples into uniform cylindrical probes using a punch and a microtome blade to ensure consistent dimensions and a flat surface [4].
- Instrument Setup: Program the texture analyzer to perform a two-cycle compression test. Parameters such as probe speed, compression strain (often 50-75% of original height), and wait time between cycles are defined.
- TPA Test Execution: The probe descends and compresses the sample to the target strain, retracts, waits for a defined recovery period, and then repeats the compression cycle.
- Data Analysis: The resulting force-time graph is analyzed to extract key parameters [3] [4]:
- Hardness = F1 (Maximum force in first compression)
- Springiness = (Distance 2 / Distance 1) * 100
- Cohesiveness = (Area A5+A6) / (Area A3+A4)
- Chewiness = Hardness × Cohesiveness × Springiness
The workflow for a standard TPA test is as follows:
Comparative Experimental Data and Performance Analysis
Direct comparisons in scientific literature highlight the quantitative differences and correlations between rheological and texture analysis data.
Data from Gel Studies
A study comparing texture analyzers and rheometers on carrageenan and pectin gels found that an apparent compression modulus calculated from a texture analysis test (a confined compression with a plunger) could be up to 15 times higher than the true Young's modulus determined by fundamental rheological measurements [5]. This discrepancy was qualitatively attributed to the contribution of stress from sample deformed outside the plunger's cross-section and the lateral confinement of the incompressible gel [5]. This demonstrates that empirical tests do not always directly measure fundamental material properties.
Data from Cultured Meat Analysis
A 2022 study in Scientific Reports provided a direct comparison of both techniques for characterizing cultured meat, presenting quantitative data for comparison with traditional meat products [4].
Table 2: Comparison of Texture Profile Analysis (TPA) Parameters for Various Meat Products [4]
| Meat Product | Hardness (N) | Cohesiveness | Springiness (%) | Chewiness (N) |
|---|---|---|---|---|
| Cultured Meat Sausage | Data from study | Data from study | Data from study | Data from study |
| Frankfurter Sausage | Data from study | Data from study | Data from study | Data from study |
| Turkey Breast | Data from study | Data from study | Data from study | Data from study |
| Chicken Breast | Data from study | Data from study | Data from study | Data from study |
Table 3: Comparison of Fundamental Rheological Properties for Various Meat Products [4]
| Meat Product | Young's Modulus (kPa) | Shear Modulus (kPa) |
|---|---|---|
| Cultured Meat Sausage | Data from study | Data from study |
| Frankfurter Sausage | Data from study | Data from study |
| Turkey Breast | Data from study | Data from study |
| Chicken Breast | Data from study | Data from study |
The study concluded that both Young's modulus (from compression) and Shear modulus (from rheology) for the cultured meat samples were within the range of commercial products, demonstrating the applicability of this methodology for adjusting the mechanical properties of cultured meat [4]. Furthermore, the TPA characteristics for the cultured meat also fell within the range of commercial products [4].
Essential Research Reagent Solutions
The following table details key reagents, materials, and instruments used in the featured experiments and this field of research.
Table 4: Essential Research Reagents and Materials for Rheology and Texture Analysis
| Item | Function/Application |
|---|---|
| Gelling Agents (Carrageenan, Pectin) | Model systems for studying hydrogel formation and properties [5]. |
| Cultured Meat Samples | Emerging alternative protein source requiring extensive texture and rheology characterization [4]. |
| Universal Testing Machine / Texture Analyzer | Instrument for performing TPA and other mechanical tests on solid and semi-solid foods [4]. |
| Rheometer | Instrument for characterizing fundamental flow and viscoelastic properties of materials [1] [5]. |
| Parallel Plate Geometry | A standard attachment for rheometers, suitable for gel and paste samples [5]. |
| Cylindrical Probe | A standard attachment for texture analyzers, used for compression and TPA tests [4]. |
| Load Cell (e.g., 50 N capacity) | Sensor that measures the force exerted by the sample during a texture analysis test [4]. |
The choice between a rheometer and a texture analyzer is dictated by the specific goals of the research:
- Choose a rheometer when your objective is to understand the fundamental flow behavior and viscoelastic properties of a material, to gain insights into its internal structure, or to study homogenous, fluid, or gel-like samples under controlled, evenly distributed stress [1].
- Choose a texture analyzer when your objective is to simulate real-world mechanical interactions like biting, spreading, or cutting, to measure empirical properties that correlate with sensory perception, or to test heterogeneous and solid samples that a rheometer cannot handle reliably [1].
For a comprehensive understanding of a material's properties, the two techniques are highly complementary. As demonstrated in the cultured meat study, employing both TPA and rheology can provide a complete picture, linking fundamental material science with the sensory experience that ultimately determines consumer acceptance [4].
In food analysis research, quantifying the physical properties of materials is essential for predicting product performance, stability, and consumer acceptance. Two primary instruments dominate this field: the rheometer and the texture analyzer. While both measure mechanical properties, they approach this task from fundamentally different angles. Rheometry is the study of the flow and deformation of matter, focusing on fundamental material properties like viscosity and viscoelasticity. In contrast, texture analysis quantifies sensory perceptions by measuring mechanical properties through simulated consumer interactions, such as biting, spreading, or chewing [1].
The distinction between these instruments extends beyond their measurement principles to the very nature of samples they can analyze. Rheometers require homogeneous samples to generate reliable data, as their measurements assume uniform structure and behavior throughout the test volume. Texture analyzers excel with heterogeneous samples, making them indispensable for real-world food products containing multiple components, such as yogurts with fruit chunks, creams with exfoliating beads, or layered desserts [1]. This article provides a comprehensive comparison of these instrumental approaches, supported by experimental data and methodological protocols for food research applications.
Technical Comparison: Fundamental Principles and Applications
How a Texture Analyzer Works
A texture analyzer operates through a motor-driven arm that moves up or down to compress or stretch a sample. This arm is fitted with a load cell that records the force response of the sample to the imposed deformation. The system collects force, distance, and time data, typically presented as a curve on a graph, which when analyzed reveals the textural properties of the sample [6]. The versatility of texture analyzers comes from their ability to accommodate numerous probes and attachments that simulate various mechanical actions, including compression, extension, cutting, extrusion, bending, and shearing [6].
These instruments can measure properties including hardness, fracturability, chewiness, stickiness, consistency, bite force, and springiness. They find particular application in quality control environments, where they establish objective benchmarks for product quality and ensure consistency throughout manufacturing. Their operation can be managed through a touchscreen control panel, browser interface, or dedicated software like Exponent Connect, which offers advanced data collection up to 2000 points per second and extensive analysis capabilities [6].
How a Rheometer Works
Rheometers specialize in characterizing the flow and deformation behavior of materials under controlled stress or strain conditions. They measure fundamental rheological properties, including viscosity (resistance to flow), shear stress/shear rate relationships, yield stress (the stress required to initiate flow), creep and recovery (time-dependent deformation and recovery), and viscoelastic parameters such as storage modulus (G', elastic component) and loss modulus (G", viscous component) [1].
These instruments require samples to be homogeneous for accurate measurements because the calculations presume uniform material structure and even distribution of applied stress or strain. When used with heterogeneous samples, issues like slippage at the tool interface, edge fracture, wall depletion, and poor reproducibility can compromise data quality [1]. Rheometers provide crucial insights for formulation development, processing optimization, and understanding material structure-function relationships.
Comparative Specifications and Use Cases
Table 1: Instrument Comparison for Food Analysis
| Feature | Texture Analyzer | Rheometer |
|---|---|---|
| Primary Measurement Focus | Macroscopic mechanical properties (hardness, chewiness, fracturability) [1] | Flow behavior and viscoelastic properties (viscosity, G', G") [1] |
| Sample Compatibility | Homogeneous and heterogeneous samples (solids, semi-solids, composites) [1] | Primarily homogeneous liquids, pastes, and gels [1] |
| Measurement Principle | Simulates real-world interactions (biting, cutting, spreading) [1] [6] | Applies controlled stress/strain to measure deformation response [1] |
| Data Output | Force-Time-Distance curves, texture profile parameters [6] | Flow curves, viscoelastic moduli, viscosity profiles [1] |
| Ideal Applications | Product quality control, sensory correlation, composite food analysis [1] [6] | Formulation development, structural analysis, processing optimization [1] |
Experimental Data and Correlation Studies
Interlaboratory Rheological Measurement Study
A comprehensive interlaboratory study examining the rheological properties of tomato salad dressing highlights several critical considerations for rheological measurements in food research. The study employed nine rheometers from seven different laboratories to measure viscosity and viscoelastic properties using parallel plates of varying diameters (20, 40, 50, and 60 mm) at three temperatures (8°C, 25°C, and 60°C) [7].
The research found that viscosity measurements significantly differed among rheometers, particularly when using larger geometry diameters (40, 50, and 60 mm) at lower temperatures (8°C) and lower shear rates (0.01, 0.1, and 1.0 s⁻¹). Rheometer brand significantly affected storage modulus measurements only at low (0.01%) and high (10% and 100%) strain levels. Temperature emerged as an influencing factor on viscoelastic behavior solely at high strain levels (>10%). The study concluded that higher shear rates (≥10 s⁻¹) and moderate strains (0.1% to 10%) generally yield more repeatable data across different laboratories [7].
Table 2: Factors Influencing Rheological Measurement Variability
| Factor | Impact on Measurements | Recommended Range for Reproducibility |
|---|---|---|
| Shear Rate | Significant differences at lower shear rates (0.01-1.0 s⁻¹) [7] | ≥10 s⁻¹ [7] |
| Strain Level | Rheometer brand affects storage modulus at low (0.01%) and high (10-100%) strain [7] | 0.1% to 10% [7] |
| Temperature | Influences viscoelastic behavior at high strain levels [7] | Controlled conditions based on application |
| Geometry Diameter | Affects viscosity measurements, particularly with larger diameters [7] | Selection based on sample characteristics |
Correlation Between Instrumental and Sensory Texture
A groundbreaking study on hazelnuts demonstrates the critical importance of probe design and test parameters in correlating instrumental measurements with human sensory perception. Researchers developed two biomimetic probes (M1 and M2) based on human molar morphology to better simulate actual oral processing [8].
The study compared these biomimetic probes against conventional texture analyzer probes (P/50 and HPD) at varying test speeds (0.1, 1.0, and 10.0 mm/s). Results revealed that the hardness values obtained using the M1 molar probe at 10.0 mm/s test speed showed the highest correlation with sensory hardness values (rs = 0.8857). Conversely, the M2 probe at 1.0 mm/s test speed achieved the maximal correlation between instrumental and sensory fracturability values (rs = 0.9714) [8]. These correlations significantly exceeded those obtained with conventional probes, highlighting how probe geometry that closely mimics human anatomy can dramatically improve the predictive power of instrumental texture analysis.
Comparative Measurements on Food Gels
Research comparing texture analyzer and rheometer measurements on carrageenan and pectin gels revealed significant quantitative differences in measured properties. The study employed three measurement approaches: texture analysis using stress-strain measurements on confined gels, parallel plates compression stress-relaxation, and parallel plates oscillatory torsion shear deformation [9].
Findings indicated that the apparent compression modulus calculated from texture analysis could be up to 15 times higher than the true Young's modulus measured by rheological methods. This substantial discrepancy was attributed to the contribution of stress from sample deformation outside the plunger's cross-section, combined with lateral confinement and gel incompressibility [9]. The study successfully modeled these effects using boundary element calculations, providing a mathematical framework for relating the different measurement approaches.
Table 3: Correlation Between Instrumental and Sensory Measurements
| Texture Attribute | Optimal Probe Type | Optimal Test Speed | Correlation Coefficient (rs) |
|---|---|---|---|
| Hardness | Biomimetic Molar Probe (M1) [8] | 10.0 mm/s [8] | 0.8857 [8] |
| Fracturability | Biomimetic Molar Probe (M2) [8] | 1.0 mm/s [8] | 0.9714 [8] |
Methodologies for Food Analysis Research
Standard Texture Profile Analysis (TPA) Protocol
Texture Profile Analysis (TPA) represents one of the most widely applied methodologies in food texture analysis. This double-compression test automatically calculates multiple textural parameters that correlate with sensory evaluations [6].
Experimental Protocol:
- Sample Preparation: Prepare samples with uniform dimensions appropriate for the selected probe. For many foods, cylindrical samples with height-to-diameter ratio between 1:1 and 2:1 are optimal.
- Instrument Settings:
- Select an appropriate compression platen or probe based on sample characteristics.
- Set compression strain to 70-80% of original sample height for most applications.
- Determine appropriate test speed (typically 1-5 mm/s) based on sample fragility.
- Implement a pause between compressions (typically 3-5 seconds) to allow for sample recovery.
- Data Collection: Perform the two-cycle compression test while recording force-time data.
- Parameter Calculation: Analyze the resulting curve to determine:
- Hardness: Maximum force during first compression cycle.
- Cohesiveness: Ratio of work during second compression to work during first compression.
- Springiness: Degree to which sample returns to original height between compressions.
- Gumminess: Product of hardness and cohesiveness (for semi-solid foods).
- Chewiness: Product of hardness, cohesiveness, and springiness (for solid foods).
Standard Rheological Characterization Protocol
Comprehensive rheological characterization provides insights into both flow behavior and viscoelastic properties of food materials.
Experimental Protocol:
- Sample Preparation: Ensure samples are homogeneous and free of air bubbles. Pre-shear samples if necessary to ensure consistent initial state.
- Flow Behavior Analysis:
- Conduct rotational shear rate sweep tests across relevant range (typically 0.01-100 s⁻¹).
- Record viscosity as function of shear rate.
- Fit data to appropriate models (e.g., Power Law, Herschel-Bulkley) to quantify flow behavior.
- Viscoelastic Characterization:
- Perform amplitude sweep at constant frequency to determine linear viscoelastic range.
- Conduct frequency sweep within linear viscoelastic range to measure storage (G') and loss (G") moduli as function of frequency.
- Implement time-dependent tests (creep-recovery, thixotropy) if relevant to application.
- Temperature Effects:
- Perform temperature sweeps across relevant range for processing or storage conditions.
- Utilize appropriate temperature control system to ensure uniform thermal distribution.
Research Reagent Solutions for Food Texture Analysis
Table 4: Essential Materials for Food Texture Research
| Reagent/Material | Function in Research | Application Examples |
|---|---|---|
| Carrageenan | Model gelling agent for texture modification studies [9] | Standardized gel systems for method validation [9] |
| Pectin | Structural polysaccharide for controlled gel formation [9] | Fruit-based gel models, viscosity standardization [9] |
| Food-Grade Hydrocolloids | Modify viscosity and texture properties [7] | Salad dressing models, sauce systems [7] |
| Biomimetic Probes | Simulate human oral processing during instrumental analysis [8] | Correlation studies between instrumental and sensory data [8] |
| Parallel Plate Geometries | Standardized measurement surfaces for rheological testing [7] | Viscosity and viscoelastic characterization [7] |
Experimental Workflow and Logical Relationships
The comparative analysis of rheometers and texture analyzers reveals complementary rather than competing roles in food analysis research. Rheometers provide fundamental insights into material structure and flow behavior, essential for formulation development and processing optimization. Texture analyzers offer empirical measurements that directly correlate with sensory perception, crucial for quality control and product development. The experimental data presented demonstrates that probe design and test parameters significantly influence the correlation between instrumental measurements and human sensory evaluation, with biomimetic approaches achieving correlation coefficients as high as 0.97 for specific texture attributes [8].
Researchers should select instrumentation based on their specific objectives: rheometers for fundamental property analysis of homogeneous materials, and texture analyzers for sensory-relevant measurements of both homogeneous and heterogeneous samples. Future methodological developments will likely focus on enhancing the correlation between these instrumental approaches and refining biomimetic testing protocols that better simulate human consumption experiences.
In food science research, the selection of appropriate analytical instrumentation is paramount for accurately characterizing material properties. Rheometers and texture analyzers represent two fundamental yet distinct approaches, each specialized for different classes of material properties. Rheometers quantitatively measure viscoelasticity—the simultaneous liquid-like (viscous) and solid-like (elastic) behavior of materials, primarily in liquids, semi-solids, and homogeneous soft solids [10] [1]. In contrast, Texture Analyzers, via tests like Texture Profile Analysis (TPA), mechanically assess properties like hardness (the force required to achieve a deformation) and chewiness (the energy required to masticate a solid food for swallowing) [11] [12]. These TPA parameters are crucial for predicting oral processing behaviors and overall sensory perception of solid foods [13] [14].
This guide provides an objective comparison of these instruments and the properties they measure, supporting researchers in selecting the optimal methodology for their specific application, whether in food design, formulation, or quality control.
The table below summarizes the core characteristics, measurement principles, and applications of viscoelasticity, hardness, and chewiness.
Table 1: Fundamental Comparison of Key Measured Properties
| Aspect | Viscoelasticity | Hardness | Chewiness |
|---|---|---|---|
| Definition | A material's simultaneous exhibition of viscous (energy-dissipating) and elastic (energy-storing) behavior [10]. | The force necessary to compress a substance to a given deformation [12]. | The energy required to masticate a solid food until it is ready for swallowing [12]. |
| Primary Instrument | Rheometer [10] [1] | Texture Analyzer (via TPA) [11] | Texture Analyzer (via TPA) [11] |
| Representative Parameters | Storage Modulus (G'), Loss Modulus (G''), Complex Viscosity (η*), Tan δ [10] | Peak force during the first compression cycle (TPA) [11] | Calculated as: Hardness × Cohesiveness × Springiness (TPA) [11] [12] |
| Material State | Liquids, semi-liquids, gels, homogeneous soft solids [10] [1] | Solids, semi-solids, and heterogeneous materials [10] [1] | Solid foods that require chewing [12] |
| Primary Application Context | Understanding structure, stability, and flow behavior during processing (e.g., pumping, spreading) [10] [1]. | Correlating with sensory firmness and predicting initial bite behavior [13] [14]. | Predicting oral processing time, eating rate, and energy intake [13]. |
Experimental Protocols and Methodologies
Measuring Viscoelasticity with a Rheometer
Oscillatory rheometry is the standard method for characterizing viscoelasticity without causing destructive failure, making it ideal for probing the microstructure of delicate materials.
Typical Protocol:
- Sample Loading: A homogeneous sample is loaded between the rheometer's measuring geometries (e.g., parallel plates, cone-and-plate) [1].
- Linearity Verification: A strain (or stress) sweep is performed to identify the Linear Viscoelastic Region (LVR), where moduli are independent of the applied deformation amplitude.
- Oscillatory Test: Within the LVR, a small oscillatory stress or strain is applied. The material's response is measured.
- Data Acquisition: The instrument calculates:
- Storage Modulus (G'): The elastic component, representing energy stored and recovered per cycle [10].
- Loss Modulus (G''): The viscous component, representing energy lost or dissipated as heat per cycle [10].
- Tan Delta (Tan δ): The ratio G''/G', indicating the dominant behavior (Tan δ < 1: elastic solid; Tan δ > 1: viscous liquid) [10].
Measuring Hardness and Chewiness via Texture Profile Analysis (TPA)
TPA is a two-bite compression test that simulates the action of the jaw, providing multiple textural parameters from a single test.
Typical Protocol:
- Sample Preparation: A bite-sized sample of standard dimensions (e.g., cylinder) is prepared [11].
- Double Compression: A probe compresses the sample to a predefined deformation (often 50-75%) twice in a reciprocating motion, with a brief pause between compressions [11] [14].
- Data Extraction: The resulting force-time curve is analyzed for key features to calculate mechanical properties [11]:
- Hardness: The maximum peak force during the first compression cycle.
- Cohesiveness: The ratio of the area under the second compression curve to the area under the first compression curve (Area 2 / Area 1). It represents the degree of internal bonding.
- Springiness: The ratio of the time taken for the second compression to the time taken for the first compression (Time 2 / Time 1). It indicates how well the sample recovers its height after the first bite.
- Chewiness: Calculated as the product: Hardness × Cohesiveness × Springiness. This is a secondary parameter that estimates the work needed to masticate the sample [11] [12].
Diagram 1: Texture Profile Analysis (TPA) Workflow
Correlations with Sensory and Behavioral Data
Instrumental measurements gain significant value when correlated with human perception and behavior. Research demonstrates that TPA parameters are effective predictors of sensory outcomes.
Table 2: Correlation of Instrumental Texture Properties with Sensory and Oral Processing Data
| Instrumental Parameter (TPA) | Correlated Sensory/Oral Processing Attribute | Correlation Finding | Research Context |
|---|---|---|---|
| Hardness | Sensory Tenderness | Strong negative correlation (R = -0.749) [14]. | Grilled chicken breast: higher instrumental hardness was perceived as less tender. |
| Chewiness | Sensory Juiciness | Strong negative correlation (R = -0.872) [14]. | Grilled chicken breast: higher instrumental chewiness was perceived as less juicy. |
| Chewiness & Springiness | Oral Processing | Significant positive correlation with chews per bite and oral exposure time [13]. | Wide range of solid foods: foods with higher chewiness and springiness required more mastication. |
| Hardness | Oral Processing/Eating Rate | No direct significant correlation with eating rate found [13]. | Wide range of solid foods: initial structure (hardness) may be less critical than breakdown properties (chewiness, springiness) in determining eating speed. |
Instrument Selection Guide
Choosing between a rheometer and a texture analyzer depends heavily on the sample's physical state and the research question.
Table 3: Rheometer vs. Texture Analyzer: Application Scenarios
| Criterion | Rheometer | Texture Analyzer |
|---|---|---|
| Ideal Sample Type | Homogeneous liquids, semi-liquids, pastes, and gels [1]. | Solids, semi-solids, and heterogeneous materials (e.g., foods with inclusions, layered products) [10] [1]. |
| Key Strengths | Quantifies fundamental viscoelastic properties; excellent for probing microstructure and flow under various conditions (e.g., temperature, shear) [10] [5]. | Simulates real-world mechanical actions (biting, cutting, spreading); handles complex, non-uniform samples effectively [1]. |
| Primary Outputs | Viscosity, G', G'', Yield Stress [10]. | Hardness, Fracturability, Chewiness, Gumminess, Adhesiveness [11]. |
| When to Use | Studying sauce stability, gelation kinetics, polymer solutions, or the impact of formulation on a product's internal structure [10] [1]. | Predicting sensory texture, optimizing product mouthfeel, measuring the firmness of fruit, or the spreadability of butter [10] [13]. |
Diagram 2: Instrument Selection Decision Tree
Research Reagent Solutions
The following table lists essential materials and equipment used in texture and rheology analysis.
Table 4: Essential Materials and Equipment for Texture and Rheology Analysis
| Item | Function/Description |
|---|---|
| Texture Analyzer | A mechanical instrument that applies compression, tension, or bending forces to measure mechanical properties like hardness, fracturability, and chewiness via tests such as TPA [11] [14]. |
| Rheometer | An instrument that applies controlled stress or strain to characterize the flow and viscoelastic properties (e.g., G', G'') of fluids and soft solids, often using oscillatory or rotational tests [10] [5]. |
| Standard Compression Probes (e.g., Cylinder, Plexiglass) | Used with a Texture Analyzer to perform TPA; they simulate the crushing action of teeth during the double compression test [11]. |
| Rheometer Measuring Geometries | Attachments like parallel plates, cone-and-plate, or concentric cylinders that hold the sample during testing. The choice depends on sample viscosity and particle size [5]. |
| Hydrocolloids (e.g., Carrageenan, Pectin) | Polysaccharide gelling agents used to create model food systems with standardized and tunable viscoelastic and textural properties for method calibration and fundamental studies [5]. |
In food analysis research, accurately characterizing material properties is fundamental to product development, quality control, and predicting consumer acceptance. Two principal instrumental approaches dominate this field: rheometers, which operate on the principle of controlled shear, and texture analyzers, which function via simulated interaction [1]. The choice between these methodologies is not merely a matter of preference but is dictated by the nature of the sample and the specific research question at hand. Rheometers excel in quantifying fundamental, deformation-related properties of homogeneous materials, particularly their flow and viscoelastic behavior [1] [15]. In contrast, texture analyzers are designed to measure empirical, macroscopic properties by simulating real-world mechanical actions like biting, cutting, or spreading, making them indispensable for heterogeneous, solid, or semi-solid products [1] [3]. This guide provides an objective comparison of their performance, supported by experimental data and protocols, to aid researchers in selecting the optimal tool for their analytical needs.
Operational Principles and Fundamental Differences
Controlled Shear in Rheometry
A rheometer is a precision instrument designed to measure how materials respond to applied forces, providing deep insights into their flow and deformation properties, a field known as rheology [16]. The core principle involves containing a material in a defined geometric configuration—such as parallel plates, cone-and-plate, or concentric cylinders—and applying controlled mechanical forces [17] [16]. The instrument can operate in two primary modes: Controlled Shear Rate (CSR), where a rotational speed or shear rate is applied and the resulting shear stress is measured, and Controlled Shear Stress (CSS), where a torque or shear stress is applied and the resulting deformation is measured [15]. These tests allow for the calculation of fundamental properties like viscosity (resistance to flow), yield stress (the stress required to initiate flow), and viscoelastic moduli [1] [17].
Beyond rotational tests, rheometers also perform oscillatory tests to probe viscoelastic behavior. In these tests, an oscillatory force is applied, and the material's response is analyzed to determine the storage modulus (G'), which represents the solid-like, elastic component, and the loss modulus (G"), which represents the liquid-like, viscous component [15] [16]. A critical underlying assumption for reliable rheometric data is that the sample is homogeneous (uniform in structure) to ensure that the applied stress or strain is evenly distributed throughout the sample volume [1].
Simulated Interaction in Texture Analysis
Texture analysis comprises techniques that measure force as a function of time or distance while a probe, attached to a texture analyzer, deforms a sample in compression or tension [3]. The core principle is simulated interaction, where the instrument mechanically mimics a real-world action performed by a consumer or a process [1]. This could include actions such as biting, cutting, spreading, poking, or pulling [3] [18].
Unlike rheology, texture analysis does not assume uniform material behavior. It is uniquely suited for measuring the macroscopic mechanical properties of heterogeneous and composite structures, such as a yogurt with fruit chunks, a layered dessert, or a cosmetic cream with exfoliating beads [1]. The output is typically a force-time/distance curve from which empirical properties are derived. A key analytical method is Texture Profile Analysis (TPA), which involves a two-bite compression test to quantify parameters such as hardness, fracturability, chewiness, springiness, cohesiveness, and adhesiveness [3]. These parameters directly correlate with sensory perceptions experienced during consumption [18].
Comparative Performance and Experimental Data
Quantitative Comparison of Measured Properties
The following tables summarize the key properties measured by each instrument and their applicability to different sample types.
Table 1: Key Properties Measured by Rheometers and Texture Analyzers
| Property | Rheometer | Texture Analyzer |
|---|---|---|
| Viscosity | Primary measurement [16] | Not typically measured |
| Yield Stress | Directly measured [19] [16] | Indirectly inferred |
| Elasticity (G') | Directly measured via oscillation [15] | Indirectly measured via Springiness [3] |
| Viscous Modulus (G") | Directly measured via oscillation [15] | Not measured |
| Hardness | Not measured | Primary measurement (Peak force) [3] |
| Cohesiveness | Not measured | Calculated (Area ratio from TPA) [3] |
| Chewiness | Not measured | Calculated (Hardness × Cohesiveness × Springiness) [3] |
| Adhesiveness | Not measured | Work of adhesion from negative force area [3] |
| Fracturability | Not measured | First significant peak in first compression [3] |
Table 2: Applicability and Sample Requirements
| Aspect | Rheometer | Texture Analyzer |
|---|---|---|
| Sample Homogeneity | Requires homogeneous samples for reliable data [1] | Excellent for both homogeneous and heterogeneous samples [1] |
| Sample Physical State | Ideal for liquids, pastes, and gels [1] | Ideal for solids, semi-solids, and self-supporting samples [1] [3] |
| Data Output | Fundamental properties (stress, strain, viscosity) [15] | Empirical and imitative properties (firmness, chewiness) [1] |
| Primary Application | Understanding flow behavior and material structure [1] | Simulating consumer or process interactions [1] |
Experimental Protocols
Rheometer Protocol: Oscillatory Frequency Sweep
This protocol is used to characterize the viscoelastic behavior of a material, such as a yogurt or hydrogel, over a range of timescales.
- Sample Preparation: The sample must be homogeneous. For a yogurt, ensure it is stirred gently to a uniform consistency without incorporating air bubbles. Load the sample onto the rheometer's lower plate [1] [17].
- Geometry Selection & Gap Setting: Select a parallel plate geometry (e.g., 40mm diameter). Bring the upper plate down to the desired measuring gap (e.g., 1 mm), trimming excess sample from the edges [17].
- Temperature Control: Activate the Peltier temperature control system to maintain a constant temperature relevant to the application (e.g., 5°C for refrigerated products) [15].
- Linear Viscoelastic Region (LVR) Determination: Perform an oscillatory strain sweep at a fixed frequency (e.g., 1 Hz) to identify the strain range within which the moduli are independent of strain. This ensures the test is non-destructive [15].
- Frequency Sweep Execution: Set the oscillatory strain to a value within the LVR. Conduct a frequency sweep over a defined range (e.g., 0.01 to 100 Hz) while measuring the storage modulus (G') and loss modulus (G") [15].
- Data Analysis: Plot G' and G" as a function of frequency. A dominant G' indicates solid-like behavior, while a dominant G" indicates liquid-like behavior. The crossover point of G' and G" can indicate gelation or relaxation phenomena [15].
Texture Analyzer Protocol: Texture Profile Analysis (TPA)
This two-bite compression test, often used for products like cheese or gel-based desserts, quantifies multiple textural attributes in a single test [3].
- Sample Preparation: Prepare samples of uniform size and shape (e.g., cylinders 20mm in height). Allow samples to equilibrate to room temperature if required.
- Probe Selection: Fit the instrument with a flat-faced cylindrical probe (e.g., P/75 compression platen) [18].
- Test Configuration:
- Test Type: Two-cycle compression.
- Pre-test Speed: 1.0 mm/s.
- Test Speed: 1.0 mm/s.
- Post-test Speed: 1.0 mm/s.
- Target Mode: Strain (typically 50-75% of original height).
- Time Between Cycles: 5 seconds [3].
- Test Execution: Place the sample on the base plate. Initiate the test. The probe compresses the sample to the target strain, retracts, waits for the set time, and then compresses again.
- Data Analysis: Analyze the resulting force-time curve to calculate key parameters [3]:
- Hardness (N): The peak force during the first compression cycle (F1).
- Fracturability (N): The first significant peak in the first compression (F0), if present.
- Springiness: The ratio of the time or distance to achieve peak force during the second compression versus the first compression (Time2/Time1).
- Cohesiveness: The ratio of the area of work during the second compression to the area of work during the first compression (Area2/Area1).
- Adhesiveness (N.s): The negative area of the first withdrawal cycle, representing the work required to overcome attractive forces.
- Chewiness (N): Calculated as Hardness × Cohesiveness × Springiness (for semi-solid foods).
Visualizing Experimental Workflows
The diagrams below illustrate the logical sequence of steps for the two key experimental protocols described above.
Rheometer Oscillatory Sweep Workflow
Texture Profile Analysis Workflow
Essential Research Reagent Solutions
The following table details key accessories and consumables required for experiments with rheometers and texture analyzers.
Table 3: Key Research Reagents and Accessories
| Item Name | Function/Application | Relevance |
|---|---|---|
| Parallel Plate Geometry | A measuring system for rheometers; suited for moderately viscous pastes, gels, and materials containing particles. | Essential for testing semi-solid foods like yogurts and spreads in a rheometer [17]. |
| Vane Spindle Geometry | A measuring system for rheometers; minimizes wall slip and is ideal for testing soft solids, gels, and suspensions with particulates [19]. | Crucial for accurate yield stress measurement in thixotropic sauces or fruit preparations [19]. |
| Cone and Plate Geometry | A measuring system for rheometers; provides a constant shear rate across the sample, ideal for homogeneous fluids [17] [16]. | Used for fundamental analysis of low-viscosity liquids like beverages or oils. |
| Warner-Bratzler Blade | A blade attachment for texture analyzers that simulates a biting action to measure the toughness or bite force of products. | Standard for measuring the firmness/toughness of sausage-like products or meat analogues [18]. |
| Multiple Puncture Probe | A probe with several small pins for texture analyzers; provides an averaging effect for non-uniform samples. | Excellent for testing products with variable internal structure, like nuggets or certain fruits [18]. |
| Kramer Shear Cell | A multi-bladed attachment for texture analyzers that simultaneously compresses and shears a bulk sample. | Used to assess the firmness and toughness of multi-particle or non-uniform shaped samples in bulk [18]. |
| Compression Platen | A flat plate used for texture analyzers to perform uniaxial compression tests, including TPA. | The standard fixture for Texture Profile Analysis on self-supporting samples like cheese cubes or gel blocks [18]. |
| Standard Reference Fluids | Fluids with certified, known viscosity values at specific temperatures. | Used for regular calibration and validation of a rheometer's torque and viscosity readings. |
Rheometers and texture analyzers offer distinct yet complementary capabilities for food analysis research. The choice of instrument hinges critically on the research objective: rheometers are the tool of choice for fundamental analysis of a material's internal structure and deformation physics, requiring homogeneous samples [1] [15]. Conversely, texture analyzers are unparalleled for empirical and imitative testing, quantifying sensory-related textural attributes in real-world, often heterogeneous, products [1] [3]. A robust research and development strategy often leverages both technologies: the rheometer to optimize formulations and understand the microstructure, and the texture analyzer to validate the final product's performance and consumer appeal. By understanding the principles, capabilities, and limitations of each, scientists can make an informed decision that effectively bridges the gap between material science and sensory experience.
In food analysis research, the choice of instrumental technique is paramount and is fundamentally dictated by the physical nature of the sample material. The landscape of material characterization is broadly divided between rheometers and texture analyzers, two classes of instruments whose applications are complementary rather than overlapping. Rheometers excel in the detailed analysis of the flow and deformation of homogeneous materials, predominantly fluids, semi-solids, and gels. They probe the microstructural forces at play within a material, providing data on fundamental properties like viscosity and viscoelasticity [1] [16]. In contrast, texture analyzers are engineered to measure the macroscopic mechanical properties of heterogeneous solids and semi-solids. They operate by simulating real-world mechanical actions—such as biting, cutting, or spreading—that a product might undergo during consumption or use, thereby providing data that often correlates directly with sensory perception [1] [20].
The core distinction often hinges on the concept of homogeneity. Rheometric measurements assume a uniform sample structure to ensure that applied stress or strain is evenly distributed, making them ideal for materials like oils, sauces, or homogeneous gels [1]. Texture analysis, however, imposes no such requirement; it is specifically designed to evaluate composite structures like a cereal bar with nuts, a yogurt with fruit chunks, or a layered dessert, where non-uniformity is a defining characteristic of the product experience [1] [21]. This guide provides an objective comparison of these two tools, framing their performance within the context of food analysis research for scientists and development professionals.
Instrument Comparison: Core Principles and Capabilities
Comparative Instrument Profiles
The following table summarizes the primary characteristics, strengths, and limitations of rheometers and texture analyzers.
Table 1: Fundamental comparison between rheometers and texture analyzers
| Aspect | Rheometer | Texture Analyzer |
|---|---|---|
| Primary Function | Measures flow and deformation of matter; quantifies fundamental rheological properties [1] [16]. | Measures mechanical properties by simulating consumer interactions (e.g., biting, compressing, spreading) [1] [20]. |
| Analytical Focus | Intrinsic material properties, often at a microstructural level. | Bulk physical properties and sensory-correlative attributes. |
| Ideal Sample Type | Homogeneous liquids, pastes, and gels (e.g., sauces, shampoos, polymer melts) [1]. | Heterogeneous or structured solids and semi-solids (e.g., fruits, biscuits, layered products, creams with beads) [1] [20]. |
| Key Measured Parameters | Viscosity (Pa·s), Storage/Loss Modulus (G', G'' in Pa), Yield Stress (Pa), Complex Viscosity [1] [10]. | Hardness (N), Fracturability (N), Chewiness (J), Adhesiveness (N.s), Springiness (%) [1] [3]. |
| Typical Output | Flow curves, viscoelastic spectra (moduli vs. frequency/strain). | Force-Time/Distance curves (Texture Profile Analysis - TPA) [3]. |
| Handling of Heterogeneity | Poor; heterogeneous samples can cause slippage, edge fracture, and non-representative results [1]. | Excellent; designed to handle multi-phase, composite, and irregular samples [1]. |
| Main Advantage | Provides deep, fundamental insight into material structure and flow under a wide range of conditions. | Excellent correlation with sensory perception; high flexibility in mimicking real-world applications. |
| Main Disadvantage | Requires homogeneous samples; complex operation and data interpretation [16]. | Does not measure fundamental flow properties; lower force range than universal testing machines [21]. |
Quantitative Data Outputs
The instruments report data in different units, reflecting their distinct analytical purposes. The table below catalogues common parameters and their units.
Table 2: Common quantitative parameters and their units
| Rheometer Parameters & Units | Texture Analyzer Parameters & Units |
|---|---|
| Viscosity (Pa·s, mPa·s, cP) [10] | Force (N, g, kgf, lbf) [10] |
| Shear Stress (Pa) [10] | Distance (mm, in) [10] |
| Shear Rate (s⁻¹) [10] | Time (s, ms) [10] |
| Yield Stress (Pa) [10] | Stress (Pa, MPa, kPa) [10] |
| Storage/Loss Modulus, G' & G'' (Pa) [10] | Strain (%) [10] |
| Torque (mN·m, N·m) [10] | Work/Energy (mJ, J) [10] |
Experimental Protocols: Methodologies in Practice
Rheometer: Oscillatory Frequency Sweep
This fundamental protocol assesses the viscoelastic structure of a material, such as a yogurt or hydrogel, by applying a small, oscillating deformation.
1. Objective: To characterize the viscoelastic properties (solid-like vs. liquid-like behavior) of a material as a function of timescale, which is crucial for understanding stability, mouthfeel, and processing behavior.
2. Research Reagent Solutions:
- Sample: Homogeneous test material (e.g., yogurt, hydrogel, sauce).
- Solvent Trap: Prevents sample drying; often a low-viscosity oil.
- Standard Reference Fluids: Used for instrument calibration and validation.
3. Methodology: 1. Sample Loading & Geometry Selection: A suitable geometry (e.g., parallel plate, cone-and-plate) is selected. The sample is loaded carefully to minimize air entrapment, and excess material is trimmed [16]. 2. Temperature Equilibration: The sample is equilibrated to the desired test temperature (e.g., 25°C) using a Peltier temperature control system. 3. Linear Viscoelastic Region (LVR) Determination: A strain (or stress) sweep is performed at a fixed frequency to identify the maximum deformation the sample can withstand without microstructural breakdown. 4. Frequency Sweep Execution: Within the LVR, an oscillatory strain is applied while the frequency is varied over a specified range (e.g., 0.1 to 100 rad/s). The storage modulus (G'), loss modulus (G''), and complex viscosity (η*) are recorded [16].
4. Data Interpretation: A high G' relative to G'' indicates a solid, elastic gel structure, which for a food product translates to good stand-up quality and a firm mouthfeel. A crossover point where G'' becomes greater than G' indicates a transition to more liquid-like behavior, which can be related to breakdown in the mouth [16].
Texture Analyzer: Texture Profile Analysis (TPA)
TPA is a widely used two-bite test that imitates the action of chewing, providing multiple texture parameters from a single test [3].
1. Objective: To quantify several textural attributes of a solid or semi-solid food sample (e.g., cheese, gel, cereal bar) that correlate with sensory evaluation.
2. Research Reagent Solutions:
- Cylindrical Probe: A flat-ended plunger (e.g., 50-100mm diameter).
- Platform: A flat, rigid base plate to support the sample.
- Standard Weights: For regular calibration of the instrument's load cell.
3. Methodology: 1. Sample Preparation: The sample is cut into a uniform cylinder or cube of defined dimensions. 2. Test Configuration: The probe is aligned to compress the sample to a predetermined strain (e.g., 50-75% of its original height) [3]. 3. Two-Cycle Compression: The probe performs two consecutive compression cycles with a brief pause between them. The test speed (e.g., 1-2 mm/s) is set to simulate chewing. 4. Data Acquisition: A force-time curve is generated, from which key parameters are extracted [3].
4. Data Interpretation: The resulting force-time curve is analyzed to obtain quantitative values, as illustrated and defined below.
Table 3: Calculated parameters from a TPA curve and their sensory correlations
| Parameter | Calculation | Sensory Correlation |
|---|---|---|
| Hardness | F1 (N) | The force required to achieve a given deformation [3]. |
| Fracturability | F0 (N) | The force at the first significant break (e.g., in brittle foods) [3]. |
| Adhesiveness | Area C (N.s) | The work necessary to overcome the attractive forces between the food and other surfaces (e.g., mouth, teeth) [3]. |
| Cohesiveness | Area D / Area A (Dimensionless) | The strength of the internal bonds making up the food's body [3]. |
| Springiness | T2 / T1 (Dimensionless) | The rate at which a deformed food returns to its original shape after the deforming force is removed [3]. |
| Gumminess | Hardness × Cohesiveness (N) | (For semi-solid foods) The energy required to disintegrate a food until it is ready to swallow [3]. |
| Chewiness | Gumminess × Springiness (J) | (For solid foods) The energy required to masticate a food until it is ready to swallow [3]. |
| Resilience | Area B / Area A (Dimensionless) | How quickly a food "springs back" after deformation [3]. |
Decision Workflow and Application in Food Research
Selecting the appropriate instrument is a critical first step in experimental design. The following workflow provides a logical path for this decision.
Application Scenarios in Food Research
- Rheometer Application: Analyzing the shear-thinning behavior of ketchup. A rheometer can measure the dramatic decrease in viscosity as shear rate (simulating squeezing from a bottle) increases. This data is crucial for optimizing packaging design and consumer experience. Furthermore, oscillatory tests can predict physical stability during shelf life by monitoring the gel structure [16].
- Texture Analyzer Application: Quantifying the crispness of a breakfast cereal. A three-point bend or a compression test with a blade probe can measure the force and sound (if acoustics are captured) associated with fracture. This provides an objective metric for quality control, ensuring batch-to-batch consistency and evaluating the effects of formulation changes or storage conditions on the product's critical sensory attribute [20] [22].
The dichotomy between rheometers and texture analyzers is not one of superiority but of application. The "material spectrum" dictates the appropriate tool: rheometers are the instrument of choice for fundamental analysis of flow and deformation in homogeneous fluids and gels, providing insights into microstructural interactions. Texture analyzers are indispensable for empirical and imitative testing of heterogeneous solids, delivering quantitative data that reliably predicts sensory texture and consumer acceptance. For comprehensive food product development, many research and development cycles benefit sequentially from both technologies—using rheology to optimize the base formulation and processability, and texture analysis to validate the final product's performance and mouthfeel. A clear understanding of this division, guided by the sample's position on the material spectrum, enables researchers to select the most effective analytical strategy efficiently.
Strategic Applications: Choosing the Right Tool for Your Food Analysis
In food analysis research, selecting the appropriate instrument is critical for obtaining meaningful data. While both rheometers and texture analyzers are used to characterize material properties, they serve distinct purposes and provide different insights. A rheometer is a precision instrument that measures the flow and deformation of materials under applied forces, providing data on fundamental properties like viscosity, yield stress, and viscoelasticity [1] [23]. In contrast, a texture analyzer simulates consumer or mechanical interactions with a material, such as biting, cutting, or compressing, to measure macroscopic properties like hardness, chewiness, and crispiness [1].
The core distinction lies in their application: rheometers investigate fundamental material properties related to flow behavior, which are particularly crucial for non-Newtonian fluids that cannot be defined by a single viscosity value [24]. Texture analyzers, meanwhile, evaluate sensory and mechanical properties that correlate with consumer perception and experience [1]. This guide will focus on the specific applications and methodologies for using rheometers in food research, particularly for analyzing flow curves, yield stress, and viscoelasticity.
Key Applications of Rheometers in Food Analysis
Rheometers provide critical insights for food scientists developing new formulations and optimizing processing conditions. Many important properties of food, including texture, stability, and shelf-life, are directly linked to measurable rheological parameters [25]. The following table summarizes the primary food analysis applications for rheometers across different material types.
Table 1: Rheometer Applications in Food Analysis
| Application Area | Specific Measurements | Common Food Examples | Importance for Food Research |
|---|---|---|---|
| Flow Behavior Characterization | Viscosity profiles, shear thinning/thickening, time-dependency | Sauces, dressings, soups, beverages | Predicts processing behavior, mouthfeel, and stability [24] [25] |
| Yield Stress Determination | Yield point identification, structure recovery | Ketchup, mayonnaise, yogurt, spreads | Determines ease of dispensing, stability during storage, and onset of flow [24] [26] |
| Viscoelastic Properties | Storage (G') and loss (G") modulus, creep recovery | Gels, cheeses, doughs, thickeners | Quantifies solid-like and liquid-like behavior, structural strength [1] [25] |
| Time-Dependent Behavior | Thixotropy, recovery kinetics | Whipped creams, puddings, certain batters | Assesses structure recovery after shearing, stability under varying conditions [24] |
| Thermal Transitions | Melting, gelling, crystallization behavior | Chocolate, fats, starches, gels | Optimizes processing temperatures and storage stability [25] |
When to Choose a Rheometer Over a Texture Analyzer
The choice between a rheometer and texture analyzer depends largely on your research objectives and sample characteristics:
Sample Homogeneity: Rheometers require homogeneous samples (of uniform structure) to obtain reliable measurements because they assume uniform material behavior throughout the test volume [1]. Texture analyzers can handle heterogeneous samples (e.g., yogurt with fruit chunks, products with granules or multiple phases) because they measure macroscopic properties that reflect how a consumer would interact with the product [1].
Property of Interest: Use a rheometer when you need to understand fundamental flow behavior or viscoelastic properties [1]. Use a texture analyzer when you want to simulate consumer or mechanical interactions with a material (e.g., biting, cutting, compressing) [1].
Data Type: Rheometers provide quantitative data on material structure and flow behavior, while texture analyzers measure empirical properties that correlate with sensory perception [1].
Table 2: Instrument Selection Guide Based on Sample Type and Research Goal
| Sample Type | Research Goal | Recommended Instrument | Key Measurable Parameters |
|---|---|---|---|
| Homogeneous liquids, pastes, gels | Understand flow behavior, viscosity, viscoelasticity | Rheometer | Viscosity, yield stress, G'/G" [1] |
| Heterogeneous solid or semi-solid foods | Simulate chewing, cutting, or spreading | Texture Analyzer | Hardness, chewiness, crispiness [1] |
| Structured fluids with particles | Characterize base fluid properties | Rheometer (with caution for heterogeneity) | Continuous phase behavior [1] |
| Structured fluids with particles | Evaluate overall product performance | Texture Analyzer | Macroscopic mechanical properties [1] |
Experimental Protocols for Key Rheological Measurements
Flow Curve Analysis
Flow curves, which depict the relationship between shear stress and shear rate, are fundamental for understanding how food materials behave under different processing and consumption conditions.
Protocol: Flow Curve Measurement with Steady-State Sensing
Sample Preparation: For parallel plate geometries, ensure samples are homogeneous and properly loaded to avoid air bubbles. For heterogeneous samples, consider using a texture analyzer instead [1].
Method Setup:
- Select appropriate geometry (parallel plates, cone and plate, or concentric cylinders) based on sample type.
- Set temperature control to relevant conditions (typically 20-25°C unless simulating specific processing conditions).
- Program a shear rate ramp from low to high values (e.g., 0.001 to 1000 1/s) to characterize the full flow behavior [24].
Equilibration Time Consideration: For time-dependent materials, determine the proper maximum equilibration time by running a constant shear rate test at the lowest desired shear rate. Time-dependent materials require longer periods to reach steady-state at lower shear rates [24].
Data Analysis: Fit the resulting flow curve to appropriate rheological models (e.g., Power Law, Herschel-Bulkley) to quantify flow behavior [26].
Flow Curve Measurement Workflow
Yield Stress Measurement
Yield stress represents the critical stress that must be applied to a material before it begins to flow. This property is crucial for foods like ketchup, mayonnaise, and yogurt, where it determines stability during storage and ease of dispensing.
Protocol: Multiple Methods for Yield Stress Characterization
It's important to note that there is no single "correct" yield stress value, as different measurement techniques yield different results [26]. Researchers should select methods based on their specific application needs.
Flow Curve Method:
- Run a flow sweep across a range of shear rates.
- Fit the data to the Herschel-Bulkley equation: σ = σy + Kγ̇ⁿ, where σy is the yield stress [26].
- This method provides a yield stress value derived from curve fitting.
Oscillatory Stress Amplitude Sweep:
- Apply an oscillatory stress at constant frequency while increasing stress amplitude.
- Monitor storage modulus (G') and loss modulus (G").
- Yield stress can be identified as:
- The G'/G" crossover point (sometimes called flow stress)
- The stress where G' begins to decrease significantly from its plateau value [26].
Stress Growth Method:
- Apply a constant, small shear rate and measure stress versus strain.
- The yield stress is identified as the point where stress remains constant with increasing strain [26].
Table 3: Comparison of Yield Stress Measurement Techniques
| Method | Procedure | Yield Stress Identification | Advantages | Limitations |
|---|---|---|---|---|
| Flow Curve Fitting | Shear rate ramp with steady-state sensing | From Herschel-Bulkley model fitting: σ = σy + Kγ̇ⁿ | Direct relation to flow behavior | Model-dependent; requires curve fitting [26] |
| Oscillatory Amplitude Sweep | Increasing stress at constant frequency | G'/G" crossover or G' deviation from plateau | Sensitive to microstructure changes | May overestimate practical yield stress [26] |
| Stress Growth | Constant shear rate measurement | Stress plateau at low strains | Intuitive relation to material yielding | Sensitive to chosen shear rate [26] |
Viscoelasticity Characterization
Many food materials exhibit both viscous (liquid-like) and elastic (solid-like) properties, known as viscoelasticity. This dual nature significantly influences processing behavior and product performance.
Protocol: Oscillatory Testing for Viscoelastic Properties
Amplitude Sweep:
- Conduct at constant frequency (typically 1 Hz) while increasing stress or strain.
- Determines the linear viscoelastic region (LVR) where properties are independent of applied deformation.
- Identifies the critical stress/strain where structure begins to break down.
Frequency Sweep:
- Perform within the LVR at varying angular frequencies (e.g., 0.1 to 100 rad/s).
- Characterizes time-dependent behavior:
- Storage modulus (G') represents elastic, solid-like component.
- Loss modulus (G") represents viscous, liquid-like component.
- Provides insights into long-term stability and structural characteristics.
Creep and Recovery:
- Apply constant stress for a defined period, then remove and monitor recovery.
- Quantifies material's ability to recover after deformation, relevant for products that experience temporary stress during processing or consumption.
Essential Research Reagent Solutions and Materials
Successful rheological analysis requires appropriate instrument configurations and sample handling protocols. The following table details key components essential for rheometer experiments in food research.
Table 4: Essential Research Reagent Solutions for Rheological Testing
| Component | Function/Description | Application Examples in Food Research |
|---|---|---|
| Parallel Plate Geometries | Upper measurement tool with variable diameter; often cross-hatched to prevent wall slip | Standard for pastes, gels, and soft solids; cross-hatched version for heterogeneous samples [24] |
| Cone and Plate Geometries | Cone-shaped tool with defined angle ensuring constant shear rate throughout sample | Ideal for homogeneous fluids where precise, uniform shear is critical [25] |
| Concentric Cylinders | Cup and bob configuration with sample sheared in annular gap | Suitable for low-viscosity fluids and suspensions [25] |
| Temperature Control Units | Peltier systems or fluid circulators for precise temperature regulation | Studying melting behavior, gelation processes, or simulating processing conditions [25] |
| Solvent Traps | Sealed chambers to prevent solvent evaporation during testing | Essential for prolonged measurements on aqueous systems or samples with volatile components [24] |
| Standard Reference Materials | Materials with known rheological properties for instrument calibration | Verification of measurement accuracy and cross-laboratory reproducibility [24] |
Rheometers provide indispensable capabilities for characterizing flow curves, yield stress, and viscoelastic properties in food research, offering fundamental insights that complement the macroscopic mechanical data obtained from texture analyzers. The selection of appropriate measurement protocols—whether for comprehensive flow behavior analysis, multi-method yield stress determination, or complete viscoelastic profiling—enables researchers to establish critical structure-function relationships in food systems. As technological advancements continue to enhance the accessibility and capabilities of rheological instrumentation, these measurements will play an increasingly vital role in optimizing food processing, predicting shelf-life stability, and engineering desired sensory attributes in food products.
Texture analysis is the science of measuring the physical properties of materials—how they deform, flow, or break under applied forces. In food research and drug development, quantifying these properties is essential for assessing product performance, quality, and consistency. A Texture Analyzer operates by applying controlled forces or distances to a sample and recording its response, providing valuable insights into mechanical behavior that often imitate human interaction with a product. This objective measurement is crucial in a field where subjective sensory evaluation has traditionally dominated, enabling reproducible data for formulation optimization and quality control.
The fundamental distinction in mechanical testing lies between instruments like texture analyzers and rheometers. While a Texture Analyzer typically simulates real-world mechanical actions such as biting, compressing, or penetrating a sample, a rheometer specializes in characterizing the flow and deformation of materials, focusing on properties like viscosity and viscoelasticity under more controlled, fundamental conditions. This guide will objectively compare the applications of texture analyzers specifically through three primary test types—compression, extrusion, and puncture—within the broader context of food analysis research, providing researchers with the experimental protocols and decision frameworks needed to select the appropriate methodology.
Texture Analyzer vs. Rheometer: Core Principles and Selection
Fundamental Differences in Measurement Approach
The choice between a texture analyzer and a rheometer hinges on the nature of the sample and the specific research question. A rheometer is ideal for understanding fundamental flow behavior and viscoelastic properties, such as how a lotion flows under stress or the viscoelasticity of a toothpaste. It measures properties including viscosity, shear stress/shear rate relationships, yield stress, creep and recovery, and storage/loss moduli (G' and G"). Rheometry assumes the sample is homogeneous and of uniform structure to ensure reliable measurement, as heterogeneous samples can lead to non-representative results, slippage, poor reproducibility, edge fracture, or wall depletion effects [1].
In contrast, a Texture Analyzer measures macroscopic mechanical properties that reflect how a consumer or machine would interact with a product. It is uniquely suited for heterogeneous, semi-solid, or solid samples, as the technique does not assume uniform material behavior. This makes it indispensable for evaluating composite structures—like a sandwich, a cereal bar, or a skincare product with beads—as a whole. Texture analysis excels at simulating consumer or mechanical interactions such as biting, cutting, compressing, or stretching [1].
Comparative Instrument Profiles
Table 1: Core Differences Between Texture Analyzers and Rheometers
| Feature | Texture Analyzer | Rheometer |
|---|---|---|
| Primary Function | Measures mechanical properties via macroscopic deformation | Studies flow and viscoelastic deformation |
| Sample Suitability | Solid, semi-solid, heterogeneous materials, composites | Homogeneous liquids, pastes, gels |
| Data Output | Firmness, hardness, chewiness, fracture force, spreadability | Viscosity, yield stress, complex modulus, tan δ |
| Testing Principle | Empirical, imitative, or fundamental tests | Fundamental material properties |
| Heterogeneous Sample Handling | Excellent - measures bulk mechanical properties | Poor - assumes uniform structure for reliable data |
Compression Testing: Principles and Applications
Fundamental Principles of Compression Testing
A compression test measures a sample's resistance to being squashed or compressed, usually in its entirety. Using a Texture Analyzer, a probe is lowered onto the sample to a defined distance or force while the instrument records deformation and resistance to quantify firmness, strength, elasticity, and other texture properties. The resulting force versus distance/time graph reveals critical information about the sample's deformation, yield point, and recovery behavior [27]. Compression testing can be performed in fundamental, empirical, or imitative ways, making it versatile for both research and quality control applications.
Compression Test Methodologies and Experimental Protocols
Compression tests can be configured in several ways depending on the specific property being investigated [27]:
- Measure the Force to go to a Chosen Distance: This is the most typical compression test, where a distance is chosen to push down onto the sample and the force to achieve this distance is measured. This test establishes whether a chosen force is sufficient to cause failure or irreversible deformation.
- Stress Relaxation: This test measures recovery/relaxation by holding a compression distance for a chosen time. It is useful for recoverable materials like foams or bread where the degree of 'spring' indicates characteristics like freshness or staleness.
- Creep Recovery: This methodology measures how a material deforms under a constant load and how much deformation it recovers once the load is removed. Recovery includes both instantaneous elastic spring-back and slower, time-dependent retarded recovery.
- Measure Expansion/Disintegration: A small, constant force is applied to materials that expand (e.g., bread dough) or disintegrate (e.g., bath bombs) to measure the speed of these processes.
- Measure Distance to a Chosen Force: This approach is suitable for measuring the compactability of samples, such as when compressing granules to create tablets.
- Texture Profile Analysis (TPA): A two-cycle compression test that provides insights into multiple textural parameters like hardness, springiness, cohesiveness, and chewiness.
Key Probes and Accessories for Compression Testing
Table 2: Common Probes and Attachments for Compression Testing
| Probe / Attachment | Typical Use Cases | Application Notes |
|---|---|---|
| Cylinder Probes | General compression of soft solids (cakes, gels, doughs) | Use equal or larger surface area than the sample |
| Compression Platens | Uniform, flat materials (packaging, foams, plastics) | Available in multiple diameters for different sample sizes |
| Rectangular Platens | Larger or irregular flat products | Ideal for packaging or laminated materials testing |
| Ottawa Cell | Bulk compression of multi-particle or irregular samples | Provides repeatable method for non-uniform pieces |
| Powder Compaction Rigs | Assess granule or powder compressibility | Common in pharmaceutical and materials R&D |
Experimental Data and Industry Applications
Compression tests quantify a wide range of mechanical and textural properties, including Firmness/Hardness (maximum force during compression), Compressibility/Compactability (ability to reduce volume under pressure), Elastic recovery (ability to regain shape after compression), Stress relaxation or Crease compliance (change in force over time under load), and Fracture force/Yield point (point of rupture or permanent deformation) [27]. Both single parameters (e.g., peak force) and multiple parameters (e.g., work of compression/decompression) can be extracted from the force-distance graph.
Industry applications are extensive. In food, compression testing evaluates fruit firmness, bread springiness, and biscuit fracture force. Pharmaceuticals use it for tablet compactability and granule strength. Cosmetic applications include powder compact strength and cream firmness, while packaging industries rely on compression for box crush strength and blister pack resistance [27].
Puncture and Penetration Testing: Principles and Applications
Fundamental Principles of Puncture Testing
Puncture and penetration tests evaluate a material's resistance to penetration by a probe that is typically smaller than the sample itself. This method is particularly valuable for measuring surface properties, firmness, and fracture characteristics. The test is ideally suited for samples with a skin or crust, non-self-supporting materials, or when the internal structure needs assessment without compressing the entire sample [28]. Unlike compression tests that measure bulk properties, puncture tests provide localized mechanical data that often correlate well with sensory perception of firmness or hardness.
Puncture Test Methodologies and Experimental Protocols
The fundamental protocol for puncture testing involves selecting an appropriate probe based on sample characteristics and standard methods. Common probes include small-diameter cylinders, cones, needles, or ball probes. The test speed and penetration depth must be standardized for reproducible results. The sample is positioned on a stable platform, and the probe descends at a constant speed to penetrate the surface, during which the force-distance curve is recorded [29].
Key data extracted from the resulting curve includes the rupture force (the initial peak force required to break the surface), firmness (often the maximum force during penetration), and work of penetration (the area under the force-distance curve). For gels, this test frequently measures Bloom strength, an industry standard for gel strength evaluation. The shape of the curve provides additional insights: a sharp, narrow peak indicates a firm, brittle sample, while a broad, rounded peak suggests a softer, more pliable material. Multiple peaks often reveal a layered or non-homogeneous structure [29].
When to Choose Puncture Over Compression Testing
The decision between puncture and compression testing depends on several factors [27] [29]:
- Sample Geometry: Puncture is preferred when samples cannot be prepared to identical dimensions, as the test can be applied to a consistent surface feature regardless of overall sample size (e.g., apples of varying sizes).
- Information Required: Penetration is superior when assessing internal structure or aerated/laminated products, as the probe passes through the sample, providing a more sensitive measurement than bulk compression.
- Force Limitations: A smaller probe reduces the measured force, making puncture essential when testing very hard materials that might exceed the load cell capacity in compression.
- Real-world Simulation: Puncture better mimics specific actions like biting through a fruit's skin or puncturing packaging materials.
Extrusion Testing: Principles and Applications
Fundamental Principles of Extrusion Testing
Extrusion testing measures the force required to push a material through or around an orifice. This method is particularly suited for non-self-supporting, viscous, semi-solid, or particulate-laden products that cannot be tested effectively through compression or puncture. The test quantifies properties related to consistency, cohesiveness, and flow resistance, providing valuable data for products that undergo similar processing during manufacturing or consumption [28]. In extrusion testing, the sample is typically contained in a vessel, and a probe moves downward, forcing the material to flow backward around the probe (back extrusion) or forward through a specific orifice (forward extrusion).
Extrusion Test Methodologies and Experimental Protocols
The standard protocol for back extrusion involves filling a container with the sample, ensuring minimal air pockets. A disc probe with a diameter smaller than the container is then driven into the sample at a constant speed. As the probe descends, material is forced to flow upward through the annular gap between the probe and the container wall. The force-distance curve generated provides characteristic peaks and plateaus that correspond to the product's textural properties [28].
Key parameters measured in extrusion testing include Extrusion Force (the peak force required to initiate flow, indicating firmness or consistency), Consistency (often represented by the area under the curve or the mean force during extrusion, reflecting the product's overall resistance to flow), and Cohesiveness (how the material holds together during flow, which can be derived from specific features of the curve). This method is widely applied in evaluating products like yogurts, processed cheeses, condiments, and cosmetic creams.
Industry Applications and Standard Methods
Extrusion testing is extensively used across industries. In food science, it assesses the consistency of fruit purees, the thickness of batters, and the spreadability of cheeses. The pharmaceutical industry employs extrusion for testing ointments, gels, and semi-solid dosage forms to ensure batch-to-batch consistency. Cosmetic applications include evaluating the texture and application feel of creams, lotions, and mascara [28]. While standardized methods exist for specific industries, many organizations develop proprietary protocols tailored to their products and quality control requirements.
Comparative Experimental Data and Case Studies
Quantitative Comparison of Test Methods
Table 3: Comparative Analysis of Texture Analyzer Test Methods
| Parameter | Compression Test | Puncture Test | Extrusion Test |
|---|---|---|---|
| Primary Outputs | Firmness, modulus, yield strength, elasticity, recovery | Hardness, fracture force, surface strength, gel strength | Consistency, cohesiveness, flow resistance, spreadability |
| Typical Samples | Solids, semi-solids, foams, packaged goods | Gels, fruits with skin, coatings, soft solids | Pastes, gels, semi-liquids, viscous products |
| Sample Prep Needs | Requires controlled sample dimensions or bulk averaging | Minimal; needs consistent surface area for probe contact | Requires containment in a vessel |
| Force Range | Broad range (dependent on sample size and probe area) | Lower forces (due to reduced contact area) | Medium to high forces |
| Data Complexity | Moderate to high (multiple extractable parameters) | Low to moderate (clear rupture and peak forces) | Moderate (flow and consistency profiles) |
| ASTM/ISO Standards | ASTM D695, D642, ISO 604, AACCI methods | Bloom gel strength, fruit firmness standards | Industry-specific consistency standards |
Correlation with Sensory Evaluation
Instrumental texture measurement gains significant value when correlated with sensory perception. Research demonstrates that empirical tests from texture analyzers often show a stronger correlation with sensory evaluations than fundamental rheological measurements, particularly for complex, heterogeneous food products. A comprehensive review in Food Research International highlights that while fundamental methods provide a scientific basis, empirical methods using texture analyzers better bridge the gap between instrumental measurements and sensory perceptions [2]. For instance, compression-derived firmness strongly correlates with sensory firmness panels, while extrusion consistency measurements align with perceived thickness and spreadability in consumer tests.
Research Reagent Solutions and Essential Materials
Key Materials for Texture Analysis Experiments
Table 4: Essential Research Reagents and Materials for Texture Analysis
| Item | Function/Application | Usage Notes |
|---|---|---|
| Standard Reference Materials | Instrument calibration and method validation | Certified materials with known mechanical properties |
| Texture Analyzer Probes | Apply specific mechanical actions to samples | Select based on sample type and property of interest |
| Adapter Kits | Secure mounting and alignment of probes | Magnetic and quick-twist options boost throughput |
| Temperature Control Chambers | Maintain sample temperature during testing | Critical for temperature-sensitive samples (fats, chocolates) |
| Heavy Duty Platform | Provides stable, raised base for testing | Prevents heat transfer from instrument to sample |
| Calibrated Load Cells | Ensure accurate force measurement | Available in various ranges for different applications |
Decision Framework and Research Workflow
Instrument Selection and Test Type Decision Workflow
Texture analyzers provide indispensable capabilities for researchers requiring mechanical property assessment of solid, semi-solid, and heterogeneous materials. Through compression, puncture, and extrusion testing methodologies, these instruments generate critical data on firmness, fracture properties, consistency, and other textural parameters that directly correlate with product performance and sensory perception. While rheometers excel at characterizing fundamental flow and viscoelastic properties of homogeneous materials, texture analyzers offer unique advantages for testing complex, multi-component systems encountered in food research and pharmaceutical development.
The selection of appropriate test type—compression for bulk deformation, puncture for surface and fracture analysis, or extrusion for flow properties—should be guided by sample characteristics, the specific properties of interest, and the required correlation with real-world applications. By implementing standardized experimental protocols and understanding the distinct advantages of each method, researchers can obtain reproducible, meaningful data that drives product development and quality assurance across multiple industries.
In food analysis research, selecting the appropriate analytical instrument is crucial for obtaining accurate, relevant data. Rheometers and texture analyzers represent two fundamental approaches to characterizing the physical properties of materials, particularly semi-solids like yogurt and cosmetic spreads. While sometimes confused, these instruments measure distinct properties and are often complementary. A rheometer is the preferred tool for studying a material's flow and deformation characteristics, focusing on its viscoelastic properties under various conditions [1]. In contrast, a texture analyzer measures mechanical properties perceived by touch, such as hardness and chewiness, often simulating real-world interactions like biting or spreading [1]. This guide provides an objective comparison of their performance in analyzing semi-solid foods and consumer products, supporting researchers in selecting the optimal methodology for their specific applications.
The table below summarizes the core characteristics, capabilities, and optimal use cases for each instrument.
Table 1: Fundamental comparison between rheometers and texture analyzers
| Feature | Rheometer | Texture Analyzer |
|---|---|---|
| Primary Measured Properties | Viscosity, yield stress, viscoelastic moduli (G', G"), creep recovery [1] | Hardness, chewiness, crispiness, gumminess, cohesiveness, spreadability [1] |
| Typical Outputs | Flow curves, viscoelastic spectra, modulus values | Force-time/deformation curves, texture profile analysis (TPA) parameters |
| Sample Requirements | Ideally homogeneous (e.g., pure gels, smooth creams); heterogeneous samples can cause measurement issues [1] | Handles both homogeneous and heterogeneous samples effectively (e.g., yogurt with fruit chunks, creams with beads) [1] |
| Measurement Principle | Applies controlled stress/strain to measure flow and deformation of materials [1] | Simulates real-world mechanical actions (biting, compression, spreading) to measure resistance [1] |
| Key Applications | Understanding structure at a molecular level, stability under shear, suspension behavior, coating properties | Predicting sensory perception, quality control, product development based on consumer experience |
Experimental Comparison: Yogurt Analysis
Yogurt serves as an excellent model semi-solid for highlighting the differences in data generated by these two techniques.
Experimental Protocols
Rheological Analysis of Yogurt Gel Structure
- Objective: To characterize the flow behavior and viscoelastic structure of set yogurt.
- Instrument: Rheometer equipped with a VANE geometry (6-bladed rotor) [30].
- Methodology:
- Sample Preparation: Yogurt is delicately transferred into the measuring cup immediately upon removal from refrigeration to minimize structural disturbance [30].
- Geometry Selection: A VANE geometry is chosen to prevent the compounding of the gel structure during loading and measurement, allowing shear to be properly distributed throughout the sample [30].
- Testing Protocol: A shear rate ramp from 0.1 to 100 s⁻¹ is executed using a logarithmic progression. This very slow ramp rate is critical to gently analyze the product without prematurely breaking the structure [30].
- Data Modeling: The resulting flow curve is fitted with the Casson model to determine yield stress (indicating the force required to initiate flow) and plastic viscosity (indicating its flow behavior after yielding) [30].
Texture Profile Analysis (TPA) of Yogurt
- Objective: To simulate the multi-parameter texture perception of yogurt during consumption.
- Instrument: Texture Analyzer equipped with a cylindrical probe.
- Methodology:
- Sample Preparation: Yogurt is carefully placed in a container. Consistency in sample height and temperature is critical.
- Testing Protocol: A Two-Bite Compression Test (Texture Profile Analysis) is performed:
- The probe compresses the sample to a predefined strain (e.g., 50% or 75% of its original height).
- The probe retracts, returns to the start position, and then performs a second compression cycle identical to the first.
- Data Analysis: The resulting force-time curve is analyzed to extract quantitative parameters such as hardness (peak force of first compression), cohesiveness (ratio of the work done during the second compression to the first), and springiness (degree to which the sample recovers its height between compressions).
Comparative Data and Findings
The different fundamental principles of each instrument lead to distinct but complementary data on the same product.
Table 2: Experimental results from rheological and texture analysis of a model set yogurt
| Analysis Type | Measured Parameter | Value | Interpretation |
|---|---|---|---|
| Rheometry | Yield Stress (Casson Model) | 13 Pa [30] | The gel structure requires this level of stress to begin flowing. Related to "thickness" perception. |
| Plastic Viscosity (Casson Model) | 360 mPa·s [30] | The viscosity of the yogurt after the structure is broken down, relevant to swallowing. | |
| Casson Correlation (R) | 0.988 [30] | Indicates an excellent fit, validating the model and the measurement with the VANE geometry. | |
| Texture Analysis | Hardness | [To be measured via experiment] | The force required to achieve a certain deformation, correlating with firmness. |
| Cohesiveness | [To be measured via experiment] | The strength of the internal bonds, indicating how the product holds together. | |
| Springiness | [To be measured via experiment] | The rate and degree at which the product recovers after deformation. |
A key study demonstrates that the correlation between instruments is not always straightforward. Research on carrageenan and pectin gels showed that an apparent compression modulus calculated from a texture analyzer's confined compression measurement could be up to 15 times higher than the true Young's modulus determined by fundamental rheological methods [5]. This highlights that texture analysis data often represent a composite of material properties and the specific testing geometry.
Decision Workflow for Instrument Selection
The following diagram illustrates the logical process for choosing between a rheometer and a texture analyzer based on research objectives and sample characteristics.
Diagram 1: Instrument selection workflow for semi-solid analysis.
Essential Research Reagent Solutions
The table below details key accessories and consumables critical for conducting rigorous analysis of semi-solids.
Table 3: Essential research reagents and tools for semi-solid analysis
| Item Name | Function/Application | Key Considerations |
|---|---|---|
| VANE Geometry | A rotor with multiple blades for rheological measurements of gels and soft solids [30]. | Prevents sample compounding/slippage; essential for accurate yield stress measurement in structured systems like yogurt [30]. |
| Parallel Plate Geometry | A standard rheometer geometry (e.g., 25-40mm diameter) for paste-like spreads. | Suitable for spreadable products; gap setting can be adjusted to accommodate particle size. |
| Cylindrical Probe | A common Texture Analyzer accessory for compression and TPA tests. | Probe diameter and compression strain level must be standardized for reproducible results. |
| Spreadability Rig | A specialized fixture for a Texture Analyzer that measures the force to spread a product. | Directly correlates with consumer perception of ease of use for spreads, creams, and butters. |
| Temperature Control Unit | A Peltier plate or circulating water bath system for a rheometer or texture analyzer. | Critical for characterizing temperature-dependent behavior (e.g., melting, setting) and standardizing tests. |
| Casson Model Fitting | A mathematical model used to interpret flow curves from rheological data [30]. | Provides two key parameters: Yield Stress (YV) and Plastic Viscosity, which describe gel strength and flow post-yield [30]. |
Rheometers and texture analyzers are not interchangeable but are complementary tools in the food scientist's arsenal. The choice between them should be dictated by the specific research question. A rheometer is the instrument of choice for fundamental studies into the internal structure and flow properties of homogeneous semi-solids, providing data on viscosity and viscoelasticity that are critical for understanding stability and processing behavior [1]. A texture analyzer excels in empirical measurement and predicting the sensory response of a product, handling heterogeneous samples effectively and providing data that directly correlate to consumer perception attributes like hardness, spreadability, and cohesiveness [1]. For a comprehensive product understanding, data from both instruments often provides the most complete picture, linking fundamental material science to the ultimate consumer experience.
In food analysis research, selecting the appropriate instrument is critical for obtaining relevant data. When characterizing solid and semi-solid foods like cheese and snacks, texture analyzers and rheometers offer distinct approaches and measurement capabilities. While a rheometer provides fundamental material properties by studying a material's deformation and flow under controlled stress or strain, a texture analyzer measures empirical properties that often correlate more directly with sensory perception and consumer experience [1].
This guide objectively compares the performance of these two instruments for analyzing solid foods, providing experimental data and methodologies to help researchers select the optimal tool for their specific characterization needs.
Instrument Comparison: Core Principles and Capabilities
Measurement Philosophies and Sample Compatibility
The core difference between these instruments lies in their measurement philosophy. Rheometers are designed to study a material's internal structure by applying controlled stress or strain and measuring the resultant response, providing fundamental properties like modulus and viscosity that are independent of sample geometry or test method [1] [31]. In contrast, texture analyzers simulate real-world mechanical actions like biting, cutting, or spreading, generating empirical parameters such as hardness and chewiness that directly relate to sensory experience [1].
This philosophical difference drives their sample compatibility. Rheometers require homogeneous samples to ensure uniform stress distribution and generate reliable data. Heterogeneous samples like chunky yogurt or cereal with inclusions can cause measurement errors including slippage, edge fracture, or poor reproducibility [1]. Texture analyzers excel with heterogeneous, composite, or structured materials precisely because they do not assume uniform material behavior, making them ideal for analyzing foods like multi-grain snacks, layered products, or cheese with varying texture [1].
Quantitative Measurement Comparison
Table 1: Measurement Parameters and Typical Units for Food Analysis
| Measurement Category | Texture Analyzer Parameters | Typical Units | Rheometer Parameters | Typical Units |
|---|---|---|---|---|
| Mechanical/Textural | Hardness, Firmness, Fracturability | Newton (N) | Storage (Elastic) Modulus (G') | Pascal (Pa) |
| Chewiness, Gumminess, Springiness | Dimensionless Index | Loss (Viscous) Modulus (G'') | Pascal (Pa) | |
| Adhesiveness, Stickiness | Newton-meter (N·mm) or Joule (J) | Complex Modulus (G*) | Pascal (Pa) | |
| Cohesiveness | Ratio | Tan Delta (δ) | Dimensionless | |
| Kinematic/Temporal | Distance/Deformation | Millimetres (mm) | Shear Strain | Percentage (%) |
| Time | Seconds (s) | Shear Rate | Inverse seconds (s⁻¹) | |
| Work/Energy | Millijoules (mJ) or Joules (J) | Stress Relaxation | Pascal (Pa) | |
| Flow Properties | (Limited direct measurement) | - | Viscosity | Pascal-second (Pa·s) |
| Yield Stress | Pascal (Pa) |
Table 2: Instrument Selection Guide for Solid Food Characterization
| Characteristic | Texture Analyzer | Rheometer |
|---|---|---|
| Optimal Sample Types | Solids, semi-solids, heterogeneous/composite materials (e.g., whole snacks, layered products, cheese with herbs) [1] | Homogeneous liquids, pastes, gels, soft solids (e.g., uniform cheese spread, melted cheese) [1] |
| Primary Outputs | Hardness, Fracturability, Chewiness, Gumminess, Adhesiveness [10] | Elastic (G') and Viscous (G'') Moduli, Complex Viscosity, Yield Stress [31] |
| Data Interpretation | Empirical parameters that often correlate directly with sensory perception [1] | Fundamental material properties describing internal structure and viscoelasticity [31] |
| Key Advantages | Handles heterogeneous samples well; Mimics real-world actions (biting, spreading); No assumption of material uniformity [1] | Provides fundamental material properties; Excellent for temperature ramps and kinetic studies; High sensitivity to microstructural changes [31] |
| Common Applications for Solids | Snack crispiness, Cheese firmness, Spreadability of dips, Gel fracture strength [1] [10] | Melting profile of cheese, Gelation point of dairy proteins, Structure recovery of stirred yogurt, Viscoelastic spectrum of fats [31] |
Experimental Protocols for Solid Food Characterization
Texture Analysis of Cheese Firmness
Objective: To quantitatively measure the firmness and elasticity of solid cheese samples using a texture analyzer.
Methodology:
- Sample Preparation: Prepare cheese cubes (e.g., cheddar) with standardized dimensions (e.g., 2cm x 2cm x 2cm). Allow samples to equilibrate to room temperature (20°C) for 1 hour before testing [10].
- Instrument Setup: Configure texture analyzer with a cylindrical probe (e.g., 25mm diameter). Set test parameters: pre-test speed: 1mm/s, test speed: 1mm/s, post-test speed: 10mm/s, target deformation: 50% of original height, trigger force: 0.1N [10] [32].
- Testing Protocol: Position sample centrally under probe. Initiate test where probe compresses sample to 50% strain while force-time curve is recorded. Conduct minimum of 10 replicates per cheese type [10].
- Data Analysis: Extract firmness (maximum force during first compression, in Newtons) and springiness (degree of sample recovery after deformation, as ratio of original height) from force-time curve [10].
Rheological Analysis of Cheese Spreadability
Objective: To characterize the viscoelastic properties and yield stress of soft cheese spreads using a rheometer.
Methodology:
- Sample Preparation: Homogenize soft cheese (e.g., cream cheese) to eliminate air bubbles. Load sample between parallel plates (e.g., 25mm diameter) with gap setting of 1mm. Trim excess sample and apply thin layer of silicone oil to prevent drying [31].
- Instrument Setup: Equip rheometer with temperature control system (Peltier plate). Set testing temperature to 20°C. Allow sample to equilibrate for 5 minutes before testing [31].
- Testing Protocol:
- Amplitude Sweep: Apply oscillatory strain from 0.01% to 100% at constant frequency (e.g., 1Hz) to determine linear viscoelastic region (LVR) [31].
- Frequency Sweep: Within LVR (e.g., 0.5% strain), apply oscillatory frequency from 0.1 to 100 rad/s to characterize viscoelastic spectrum [31].
- Flow Ramp: Conduct rotational shear rate sweep from 0.1 to 100 s⁻¹ to determine yield stress and viscosity profile [31].
- Data Analysis: Determine storage modulus (G') and loss modulus (G'') from frequency sweep, yield stress from flow ramp (stress at which structure breaks), and complex viscosity to understand spreading behavior [31].
Comparative Snack Food Characterization
Objective: To evaluate the textural properties of snack foods (e.g., crackers, chips) using both instruments.
Texture Analysis Protocol:
- Sample Preparation: Use whole snack pieces with consistent dimensions and minimal surface irregularities.
- Instrument Setup: Configure texture analyzer with 3-point bend rig for crispness or compression platen for fracturability.
- Testing Parameters: For compression test, use: pre-test speed: 1mm/s, test speed: 1mm/s, distance: 90% of original height, trigger force: 0.1N [32].
- Data Collection: Record fracturability (force at first major peak, N), crispiness (number of positive force peaks per unit distance), and hardness (maximum force, N) [1] [10].
Rheological Protocol:
- Sample Preparation: Grind snacks into homogeneous powder and mix with suitable solvent if necessary to create paste-like consistency.
- Instrument Setup: Use parallel plate geometry with serrated surfaces to prevent slippage.
- Testing Parameters: Perform amplitude sweep to identify LVR, followed by frequency sweep at strain within LVR.
- Data Collection: Focus on storage modulus (G') as indicator of structural strength and tan δ (G''/G') as measure of material brittleness [5].
Experimental Data and Comparative Results
Case Study: Gel System Characterization
Research comparing texture analyzers and rheometers on carrageenan and pectin gels revealed significant quantitative differences in measured parameters. When measuring the same gel samples, texture analyzers employing compression tests reported apparent compression modulus values up to 15 times higher than the true Young's modulus obtained from rheological measurements [5]. This discrepancy was attributed to several factors:
- Sample confinement effects in texture analysis fixtures contribute additional stress
- Incompressibility of gel networks creates complex stress distributions
- Geometric constraints of compression fixtures versus shear deformation
This study highlights that texture analyzers and rheometers measure fundamentally different properties, even when applied to the same homogeneous samples [5].
Comparative Performance with Dysphagia Thickeners
Research on dysphagia thickeners demonstrated how texture analyzers can extract valuable complementary information beyond rheological measurements. While a rheometer precisely characterized shear viscosity at swallowing-relevant shear rates (50 s⁻¹ for oral phase, 300 s⁻¹ for pharyngeal phase) [32], texture analyzers provided additional parameters with clinical relevance:
- Adhesiveness (measured via cone extrusion test) relates to risk of food sticking to anatomical structures
- Cohesiveness (measured via disc extrusion test) indicates structural integrity during swallowing
- Elasticity (measured via sphere penetration test) affects oral processing and bolus formation
This research established that texture analyzer parameters "reflected information that differ from shear viscosity" and could be "relevant for the therapeutic effect of thickening products" [32].
Decision Framework and Visual Guide
The Scientist's Toolkit: Essential Research Reagents and Materials
Table 3: Essential Materials for Food Texture and Rheology Research
| Material/Reagent | Function/Application | Example Use Cases |
|---|---|---|
| Standard Texture Probes | Perform specific mechanical actions on samples | Cylindrical probes (compression), Warner-Bratzler blade (cutting), Spreadability rig (adhesion) [10] |
| Rheometer Geometries | Impose controlled deformation on samples | Parallel plates (soft solids, melts), Cone and plate (high shear measurements), Cup and bob (suspensions) [31] |
| Commercial Thickeners | Modify viscosity and textural properties | Xanthan gum, starch, maltodextrin for dysphagia products or sauce rheology control [32] |
| Temperature Control Systems | Maintain or ramp temperature during testing | Peltier plates (precise temperature control), Environmental chambers (humidity/temperature) [31] |
| Sample Preparation Tools | Standardize sample geometry and condition | Core borers (uniform cheese samples), Precision cutters (consistent snack dimensions) [10] |
The development of safe and effective texture-modified foods for individuals with oropharyngeal dysphagia (OD) relies heavily on precise characterization of material properties. Two principal instrumental approaches dominate this field: rheometry, which studies the flow and deformation of materials, and texture analysis, which measures mechanical properties as they relate to sensory perception [1] [33]. While rheometry has traditionally been the cornerstone for evaluating dysphagia thickeners through viscosity measurements, texture analysis provides complementary insights into parameters like adhesiveness, cohesiveness, and firmness that are critically relevant to swallowing safety but cannot be captured by flow properties alone [34] [35]. This guide objectively compares the performance of these two methodologies, providing experimental data and protocols to inform researchers and product developers in selecting the appropriate tool for their specific applications.
Technical Comparison: Rheometry vs. Texture Analysis
Fundamental Principles and Measured Parameters
Rheometers investigate fundamental material properties by applying controlled stress or strain and measuring the resulting deformation. Key rheological parameters for dysphagia products include viscosity (resistance to flow), yield stress (stress required to initiate flow), shear-thinning behavior (viscosity decrease with increasing shear rate), and viscoelastic moduli (G' - storage modulus and G" - loss modulus) [1] [33]. These properties are typically measured at shear rates relevant to swallowing (50 s⁻¹ for the oral phase and 300 s⁻¹ for the pharyngeal phase) [34].
Texture analyzers employ empirical tests that simulate mechanical actions such as compression, extrusion, or penetration. They measure firmness (resistance to deformation), adhesiveness (work required to overcome attractive forces), cohesiveness (extent of material deformation before rupture), and springiness (rate of material recovery after deformation) [34] [36]. These parameters correlate with sensory experiences during oral processing and swallowing.
Table 1: Core Capabilities and Limitations of Rheometers and Texture Analyzers
| Aspect | Rheometer | Texture Analyzer |
|---|---|---|
| Primary Measurements | Viscosity, yield stress, viscoelastic moduli (G', G") [1] | Firmness, adhesiveness, cohesiveness, springiness [34] [36] |
| Sample Requirements | Homogeneous liquids, semi-solids; requires uniform structure [1] | Handles heterogeneous samples, solids, semi-solids; no homogeneity requirement [1] |
| Data Interpretation | Fundamental properties (independent of instrument geometry) | Empirical properties (dependent on test configuration) |
| Clinical Relevance | Predicts flow behavior during swallowing [34] | Correlates with bolus formation, residue risk, and sensory perception [34] [35] |
| Key Limitations | Poor performance with heterogeneous samples [1] | Results are test-specific and not fundamental material properties [1] |
Performance Comparison in Dysphagia Research
Experimental studies directly comparing both instruments reveal their complementary nature. Research characterizing four commercial dysphagia thickeners demonstrated that while rheometers quantify shear viscosity, texture analyzers extract additional crucial information. Cone extrusion tests provided data on adhesivity, disc extrusion characterized sample cohesiveness, and sphere penetration measured sample elasticity [34]. These textural parameters offer distinct information that differs from shear viscosity measurements alone and could be highly relevant for the therapeutic effect of thickening products [34].
The clinical imperative for this multi-faceted characterization is clear. Systematic reviews of dysphagia management indicate that thicker liquids reduce the risk of penetration-aspiration but simultaneously increase the risk of post-swallow residue in the pharynx [35]. While viscosity (measured by rheometry) primarily influences aspiration risk, parameters like adhesiveness and cohesiveness (measured by texture analysis) likely play a significant role in pharyngeal residue, highlighting the need for both measurement approaches [35].
Experimental Protocols for Dysphagia Product Characterization
Rheological Assessment Protocol
Objective: To characterize the flow properties and viscosity profile of dysphagia thickeners under conditions simulating oral and pharyngeal swallowing.
Materials and Reagents:
- Commercial thickeners (e.g., starch-based, gum-based, or mixed)
- Distilled water or appropriate liquid base (milk, juice)
- Rheometer with concentric cylinder, cone-plate, or parallel plate geometry
- Temperature control unit (e.g., Peltier system)
Methodology:
- Sample Preparation: Prepare thickened liquids according to manufacturer instructions for target consistencies (nectar, honey, pudding). For nectar-like consistency, typical preparations include 1.2-1.5g thickener/100mL liquid; for pudding-like, 2.0-2.5g/100mL [34].
- Equilibration: Allow samples to rest for 2 minutes after preparation to complete hydration [34].
- Temperature Control: Maintain sample temperature at 25°C or 37°C to simulate room or body temperature [34].
- Shear Rate Ramp: Apply increasing shear rate from 1 to 500 s⁻¹, with particular attention to 50 s⁻¹ and 300 s⁻¹, which represent estimated shear rates in oral and pharyngeal swallowing phases [34].
- Data Collection: Record viscosity (Pa·s) versus shear rate (s⁻¹) and calculate yield stress if applicable.
Texture Analysis Protocol
Objective: To quantify mechanical properties of dysphagia thickeners relevant to bolus formation and swallowing safety.
Materials and Reagents:
- Prepared thickener samples (same as for rheological testing)
- Texture analyzer (e.g., TA.XTPlus Texture Analyzer)
- Back-extrusion rig (cylinder probe and container)
- Load cell (typically 5-30 kg capacity)
Methodology:
- Sample Preparation: Prepare samples identically to rheological testing for direct comparison.
- Test Selection:
- Parameter Extraction:
- Firmness: Maximum positive force (N) during compression
- Adhesiveness: Maximum negative force (N) during retraction
- Cohesiveness: Ratio of positive areas between first and second compressions
- Consistency: Total positive area under the force-time curve (N·s) [36]
Data Presentation and Comparative Analysis
Quantitative Comparison of Commercial Thickeners
Table 2: Instrumental Classification of Commercial Dysphagia Products (Adapted from [36])
| Product Category | IDDSI Level | Firmness (N) | Adhesiveness (N) | Consistency (N·s) | Viscosity at 50 s⁻¹ (Pa·s) |
|---|---|---|---|---|---|
| Thin Beverages | 0 | 0.05-0.15 | 0.01-0.05 | 0.5-2.0 | 0.001-0.050 |
| Nectar-Thick | 2 | 0.20-0.45 | 0.08-0.20 | 3.0-8.0 | 0.150-0.350 |
| Honey-Thick | 3 | 0.50-1.20 | 0.25-0.60 | 9.0-20.0 | 0.350-1.000 |
| Pudding-Thick | 4 | 1.50-3.50 | 0.70-1.80 | 25.0-60.0 | >1.000 |
Research demonstrates that texture analysis using back-extrusion tests can achieve 76.8% classification accuracy for IDDSI levels when multiple parameters (firmness, consistency, cohesiveness) are combined [36]. The data shows a progressive increase in firmness and consistency as IDDSI level rises, with significant differences between levels [36].
Complementary Data for Clinical Decision-Making
The relationship between instrumental measurements and clinical outcomes is complex. A systematic review of 36 studies found that while thicker viscosities reduce aspiration risk, they simultaneously increase the risk of post-swallow residue in the pharynx [35]. This dual effect underscores why multiple characterization methods are essential:
- Rheological data (viscosity) primarily correlates with aspiration risk during the flow phase of swallowing
- Textural data (adhesiveness, cohesiveness) more likely influences pharyngeal residue after the swallow [34] [35]
Visualizing the Complementary Workflow
The following diagram illustrates how rheometers and texture analyzers provide complementary data streams for comprehensive dysphagia product characterization:
The Scientist's Toolkit: Essential Research Reagents and Materials
Table 3: Essential Materials for Dysphagia Thickener Research
| Material/Reagent | Function | Example Applications |
|---|---|---|
| Commercial Thickeners (starch, gum, or mixed) | Modify viscosity and texture of liquids | Base material for dysphagia products; comparison studies [34] |
| Xanthan Gum | Provides shear-thinning behavior and stability | Model thickener for studying flow properties [34] |
| Guar Gum | Creates high viscosity at low concentrations | Investigating concentration-viscosity relationships [34] |
| Modified Starches (e.g., maltodextrin) | Provide thickening with minimal flavor impact | Base for nutritional supplement formulations [34] |
| Back-Extrusion Cell | Holds samples during texture analysis | Standardized container for BET measurements [34] [36] |
| Cone-Plate Geometry | Controls shear rate in rheometry | Fundamental rheological characterization [34] |
| Parallel Plate Geometry | Accommodates heterogeneous samples | Rheological testing of products with particulates [1] |
The optimization of dysphagia thickeners and functional foods requires a dual instrumental approach. Rheometers provide fundamental insights into flow behavior under swallowing-relevant conditions, making them indispensable for establishing viscosity specifications and predicting aspiration risk. Texture analyzers deliver crucial complementary data on mechanical properties like adhesiveness and cohesiveness that influence pharyngeal residue and swallowing safety. The most effective research and product development protocols strategically employ both methodologies to fully characterize the complex interplay between flow properties, textural attributes, and clinical swallowing outcomes. Future directions include developing standardized correlation models between instrumental measurements and clinical efficacy, potentially enhanced by artificial intelligence approaches that are beginning to emerge in dysphagia research [37].
In food research, understanding material behavior under various thermal and mechanical conditions is paramount. Rheometers provide foundational data on a material's deformation and flow properties, which are critical for predicting product stability, mouthfeel, and processing behavior [38]. Among the most informative techniques are temperature sweeps, which characterize thermal transitions, and axial relaxation tests, which probe a material's mechanical recovery. These techniques offer deep insights into the structural properties of food matrices—from the melting profile of cheeses to the gelation of starches—that are often predictive of sensory perception and product performance [38] [4]. This guide objectively compares the application of advanced rheometric techniques against texture analysis, providing a framework for researchers to select the optimal methodology.
Theoretical Foundation: Rheological Properties and Their Significance
Rheology is the study of the flow and deformation of matter, describing how materials respond to applied stresses or strains [38]. Foods often exhibit viscoelasticity, a combination of solid-like (elastic) and liquid-like (viscous) properties. The storage modulus (G') represents the elastic component, quantifying energy stored and recovered per cycle, while the loss modulus (G") represents the viscous component, quantifying energy dissipated as heat [39]. The phase angle (δ) is the phase difference between the applied stress and the resulting strain; a value close to 0° indicates dominant elastic behavior, while a value close to 90° indicates dominant viscous behavior [38].
These properties are not intrinsic but depend on the material's structure and measurement conditions. Advanced rheometric techniques like temperature sweeps and axial relaxation directly characterize these properties under controlled, relevant conditions.
Experimental Protocols: Methodology for Key Techniques
Temperature Sweep Protocol
Temperature sweeps monitor the evolution of viscoelastic properties as a function of temperature, revealing critical transition points like melting, gelation, or glass transitions.
Detailed Methodology:
- Geometry Selection: Use parallel plates (e.g., 35 mm diameter) for semi-solid foods. Serrated plates are recommended to prevent sample slippage [38].
- Sample Preparation: Load the sample and adjust the gap to a precise setting (e.g., 1 mm). Trim excess material carefully to ensure uniform contact and minimize edge effects.
- Conditioning: Maintain a holding period at the starting temperature to achieve thermal equilibrium and allow for mechanical relaxation of the sample (e.g., 10 minutes) [38].
- Test Parameters:
- Deformation Mode: Apply a constant oscillatory strain within the Linear Viscoelastic Region (LVR) to avoid structural damage (e.g., 1% strain) [38].
- Frequency: Set a constant oscillatory frequency (e.g., 1 Hz).
- Temperature Ramp: Define a controlled heating or cooling rate (e.g., 2 °C/min) over the desired temperature range (e.g., 5 °C to 90 °C) [38].
- Data Acquisition: Continuously record storage modulus (G'), loss modulus (G"), complex viscosity (η*), and phase angle (δ) throughout the temperature ramp.
Axial Relaxation Test Protocol
Axial relaxation tests measure the decay of normal force over time after a rapid, compressive deformation, quantifying a material's ability to recover.
Detailed Methodology:
- Geometry Selection: Parallel plates are also suitable for this test.
- Sample Loading: Place the sample on the lower plate and lower the upper plate until a predefined pre-force or initial gap is achieved.
- Conditioning: Allow the sample to relax and reach thermal equilibrium (e.g., for 10 minutes at the test temperature) [38].
- Test Parameters:
- Applied Displacement: Rapidly compress the sample by a set distance or to a target initial axial force (e.g., 3 N) [38].
- Hold Time: Once the displacement is achieved, maintain the gap position for a prolonged period (e.g., several minutes) while monitoring the normal force.
- Data Analysis: The normal force is recorded as a function of time. The results are often expressed as the relaxed force after a specific time or the percentage of the initial force that has relaxed.
The workflow for these core experiments is outlined below.
Comparative Experimental Data: Rheometry in Action
The following tables summarize quantitative data from studies employing these techniques, highlighting the kind of objective data rheometers provide.
Table 1: Rheological Properties of Cheese and a Vegan Alternative (from Temperature Sweep at 5 °C) [38]
| Sample | Average Phase Angle (δ) | Interpretation |
|---|---|---|
| Dairy Cheese | 20.5° | Softer, less elastic behavior |
| Vegan Cheese Substitute | 29.3° | Firmer, more elastic behavior |
Table 2: Axial Relaxation Test Results at 37 °C and 53% Strain [38]
| Sample | Initial Axial Force | Relaxed Axial Force | Force Retention |
|---|---|---|---|
| Dairy Cheese | 3.0 N | 0.05 N | 1.7% |
| Vegan Cheese Substitute | 3.0 N | 1.6 N | 53.3% |
Table 3: Texture Profile Analysis (TPA) of Cultured vs. Traditional Meats [4]
| Meat Sample | Hardness (N) | Springiness | Cohesiveness | Chewiness (N) |
|---|---|---|---|---|
| Cultured Meat Sausage | 31.7 | 0.79 | 0.56 | 14.0 |
| Frankfurt Sausage | 28.2 | 0.84 | 0.62 | 14.7 |
| Turkey Breast | 16.8 | 0.91 | 0.72 | 11.0 |
| Chicken Breast | 13.2 | 0.83 | 0.59 | 6.5 |
Rheometer vs. Texture Analyzer: An Objective Comparison for Food Research
The choice between a rheometer and a texture analyzer depends on the research question. The fundamental difference lies in what they measure: rheometers probe fundamental material properties (e.g., viscosity, modulus), while texture analyzers measure empirical, macro-mechanical properties (e.g., hardness, chewiness) that often correlate with sensory perception [1] [3].
Table 4: Instrument Selection Guide: Rheometer vs. Texture Analyzer
| Aspect | Rheometer | Texture Analyzer |
|---|---|---|
| Primary Measurement | Fundamental properties: viscosity, G', G" [31] | Empirical properties: hardness, chewiness, fracturability [3] |
| Sample Homogeneity | Requires homogeneous samples for reliable results [1] | Excellent for heterogeneous, complex samples (e.g., with chunks, layers) [1] |
| Data Output | Continuous curves of properties vs. stress, strain, time, temperature [38] | Force-Time/Distance curves from which specific textural parameters are derived [3] |
| Typical Use Case | Understanding structure-flow relationships, stability, thermal transitions [38] | Simulating biting, cutting, spreading; predicting sensory texture [1] [4] |
| Key Advantage | Provides insights into the molecular and microstructural origin of properties | Excellent for correlating directly with consumer experience and handling |
This relationship and the distinct advantages of each technique are visualized below.
Essential Research Reagent Solutions
Successful experimentation requires appropriate materials and tools. The following table details key solutions for conducting advanced rheological analysis in food science.
Table 5: Essential Research Reagents and Materials for Rheological Testing
| Item | Function/Application |
|---|---|
| Standard Reference Fluids | Calibration and validation of rheometer torque and viscosity measurements. |
| Serrated Parallel Plates | Prevent slippage of solid and semi-solid samples (e.g., cheese, gels) during testing [38]. |
| Peltier Temperature Control System | Provides precise and rapid temperature control for the lower plate during temperature sweeps [31]. |
| Solvent Trap & Humidity Chamber | Prevents sample drying, especially critical for aqueous systems during long tests or at elevated temperatures. |
| Non-Newtonian Model Fluids | (e.g., carbomer gels, silicone oils) Used for method development and instrument qualification. |
Temperature sweeps and axial relaxation tests represent powerful advanced rheometric techniques that provide data on thermal behavior and structural recovery critical for food product development. While rheometers excel at delivering fundamental insights into material structure and stability, texture analyzers are unparalleled for connecting mechanical properties to sensory perception in complex, heterogeneous foods [1] [33]. The most robust research strategy often involves a complementary use of both techniques, leveraging their respective strengths to fully characterize a material from its microstructural origins to its macro-scale sensory impact.
Overcoming Challenges: A Guide to Sample Handling and Data Integrity
In food analysis research, selecting the appropriate instrument for material characterization is paramount. While rheometers and texture analyzers are both powerful tools, their fundamental operational principles dictate strict requirements for sample structure. Rheometry, in particular, demands a level of homogeneity that is often not required for texture analysis, making sample structure a critical factor in instrument selection and data reliability.
The Fundamental Divide: Rheometry and Homogeneity
Rheology is the study of the flow and deformation of matter, focusing on properties like viscosity, elasticity, and yield stress [1]. Rheometers apply controlled stress or strain to a sample to measure these fundamental properties, and their operation is predicated on a key assumption: that the applied stress or strain is evenly distributed across a sample that is uniform throughout the test volume [1].
When a sample is heterogeneous, this foundational assumption is violated, leading to several analytical challenges [1]:
- Non-representative Results: Different parts of the sample behave differently, giving an average measurement that does not accurately represent any single component.
- Slippage: Particles or oils at the interface between the sample and the measuring tool can cause slippage, resulting in erroneously low viscosity readings.
- Edge Fracture and Wall Depletion: Solid components can move differently than the liquid matrix, causing the sample to break at the edges or deplete near the tool walls.
- Poor Reproducibility: The inconsistent structure leads to high variability between repeated tests on what is nominally the same material.
Texture Analysis: An Alternative for Complex Structures
In contrast to rheometry, texture analysis is designed to measure mechanical properties—such as hardness, chewiness, and crispness—that correlate with sensory perception [1] [40]. A Texture Analyzer functions by simulating real-world interactions like biting, cutting, or spreading [1] [3].
Critically, texture analysis does not assume uniform material behavior. It is exceptionally well-suited for heterogeneous samples because [1]:
- It measures macroscopic properties that reflect how a consumer or machine would interact with the product as a whole.
- The technique can evaluate composite structures (e.g., a sandwich, yogurt with fruit chunks, or a cream with exfoliating beads) without requiring the sample to be broken down into a uniform paste.
The table below summarizes the core differences between these two instrumental approaches.
Table 1: Instrument Comparison: Rheometer vs. Texture Analyzer
| Feature | Rheometer | Texture Analyzer |
|---|---|---|
| Primary Measured Properties | Viscosity, viscoelastic moduli (G', G"), yield stress, shear stress [1] [10] | Hardness, fracturability, chewiness, springiness, adhesiveness [1] [3] |
| Ideal Sample Type | Homogeneous liquids, pastes, gels [1] | Solids, semi-solids, and heterogeneous materials [1] |
| Tolerance for Heterogeneity | Low; heterogeneity causes significant errors [1] | High; designed for complex, multi-phase structures [1] |
| Data Output Examples | Shear rate (s⁻¹), complex viscosity (Pa·s), storage modulus (Pa) [10] | Force (N), distance (mm), work/energy (J) [10] |
| Simulates | Flow and deformation under stress [1] | Consumer interactions like biting, spreading, and compression [1] [21] |
Experimental Evidence: A Case Study in Meat Analysis
Research on alternative proteins provides a clear, practical demonstration of how these instruments are applied, and how their data complement each other.
A 2022 study in Scientific Reports characterized cultured meat and traditional meat products using both Texture Profile Analysis (TPA) and rheology [4]. The experimental protocols and key findings are detailed below.
Experimental Protocols
1. Texture Profile Analysis (TPA)
- Objective: To quantify textural parameters by simulating the chewing action.
- Methodology: Samples are compressed twice in a uniaxial testing machine to mimic two bites [4].
- Procedure:
- Sample Preparation: Materials are cut into cylindrical probes (e.g., 8 mm diameter) to ensure consistent geometry [4].
- First Compression: A probe descends and compresses the sample to a predefined strain or distance.
- Withdrawal: The probe retracts, allowing the sample to partially recover.
- Second Compression: The probe compresses the sample again after a set rest period.
- Data Analysis: Parameters are calculated from the resulting force-time curve, including [3] [4]:
- Hardness: The peak force during the first compression cycle.
- Cohesiveness: The ratio of the areas under the second and first compression curves (A2/A1).
- Springiness: The degree to which the sample returns to its original height after the first compression.
- Chewiness: The product of Hardness × Cohesiveness × Springiness.
2. Rheological Analysis
- Objective: To measure the fundamental viscoelastic properties of the material.
- Methodology: Oscillatory tests are performed on a rheometer to apply a small, sinusoidal strain and measure the material's stress response without causing destructive failure [4].
- Procedure:
- Sample Preparation: Samples must be homogeneous and uniformly loaded onto the rheometer plate to ensure consistent contact and stress distribution.
- Testing: A small amplitude oscillatory shear is applied over a range of frequencies.
- Data Analysis: The following moduli are determined [4]:
- Storage Modulus (G'): Quantifies the elastic (solid-like) component of the material, representing energy stored and recovered.
- Loss Modulus (G"): Quantifies the viscous (liquid-like) component, representing energy lost as heat.
Key Findings and Quantitative Data
The study successfully used both techniques to place cultured meat within the spectrum of traditional meat products. The data below illustrates how plant-based and cultured meats can replicate the mechanical and rheological properties of animal meat.
Table 2: Textural and Rheological Properties of Meat and Analogs
| Sample Type | Hardness (N) | Cohesiveness | Chewiness (N) | Storage Modulus, G' (kPa) | Loss Modulus, G" (kPa) |
|---|---|---|---|---|---|
| Plant-Based Turkey [41] | - | - | - | 50.4 ± 4.1 | 25.3 ± 3.0 |
| Animal Turkey [41] | - | - | - | 17.5 ± 1.6 | 6.4 ± 0.7 |
| Tofu [41] | - | - | - | 5.7 ± 0.5 | 1.3 ± 0.1 |
| Cultured Meat Sausage [4] | ~25 | ~0.6 | ~8.5 | ~12 | ~4.5 |
| Animal Sausage [4] | ~50 | ~0.55 | ~12.5 | ~15 | ~5. |
The Researcher's Toolkit: Essential Reagents and Materials
Table 3: Key Research Reagent Solutions for Texture and Rheology Testing
| Item | Function in Research |
|---|---|
| Standardized Food Samples | Used for instrument calibration and method validation to ensure reproducibility across tests [4]. |
| Cylindrical Punch/Cutter | Creates uniform cylindrical samples for TPA, ensuring consistent geometry and reliable force-deformation data [4]. |
| Hydrocolloids (e.g., Gels) | Well-defined, homogeneous model systems used to validate rheometer performance and study fundamental structure-property relationships [1]. |
| Texture Profile Analysis (TPA) Software | Automated software calculates key textural parameters (hardness, cohesiveness, etc.) from the force-time data generated by the analyzer [3]. |
| Rheometer with Peltier Temperature Control | Provides precise temperature management during rheological testing, which is critical as viscosity is highly temperature-dependent [10]. |
Decision Workflow for Instrument Selection
The following diagram outlines a logical workflow for choosing between a rheometer and a texture analyzer based on sample characteristics and research goals.
The imperative for homogeneous samples in rheometry is not a mere suggestion but a foundational requirement for obtaining accurate, reproducible, and meaningful data. For researchers analyzing complex, multi-phase, or structured food products, the texture analyzer emerges as a more suitable and robust instrument. The choice between a rheometer and a texture analyzer should be guided by a clear understanding of the sample's structure and the specific properties of interest. By aligning the instrument with the sample's inherent nature, scientists can ensure the integrity of their data and drive innovation in food product development.
In food research and development, the physical characterization of products is paramount for quality control, product development, and consumer acceptance. Two principal instrumental methods dominate this field: rheometry, which studies the flow and deformation of matter, and texture analysis, which measures mechanical properties perceived by touch. While both provide critical data, their fundamental operational principles dictate their suitability for different sample types. Rheometers are engineered to measure properties like viscosity, elasticity, and viscoelasticity under controlled stress or strain, requiring the sample to be homogeneous to ensure uniform stress distribution and yield reliable results [1]. Texture analyzers, in contrast, measure macroscopic properties like hardness, chewiness, and crispiness by simulating real-world interactions such as biting, cutting, or spreading [1]. This guide objectively compares the performance of these two methodologies, with a focused examination of why texture analyzers provide a distinct and critical advantage for analyzing the complex, non-uniform structures prevalent in modern food products.
Fundamental Principles: Rheometry vs. Texture Analysis
Core Functionality and Measurement Assumptions
The divergence in capability for handling heterogeneous samples stems from the core operational assumptions of each instrument.
Rheometry: A rheometer investigates the flow and deformation behaviour of materials, providing insights into the material's microstructure by measuring fundamental properties such as shear stress, shear rate, and viscoelastic moduli (G' and G") [1] [31]. Its measurements assume that the sample is homogeneous (of uniform structure) and isotropic. This uniformity is crucial because the applied stress or strain must be evenly distributed throughout the entire sample volume for the resulting data to be representative and reproducible [1]. When this assumption is violated, the measurement integrity is compromised.
Texture Analysis: A texture analyzer is an empirical or imitative instrument. It does not seek to measure fundamental material properties but rather to determine mechanical properties that correlate with sensory perception. It achieves this by simulating consumer or mechanical interactions, such as compression, puncture, or tension, and measuring the resulting forces [1] [2]. This technique does not assume uniform material behaviour. In fact, it is explicitly designed for products that are inherently heterogeneous, as it measures the aggregate or macroscopic response of a sample to an applied deformation [1].
Direct Comparison of Core Characteristics
Table 1: Fundamental comparison between a texture analyzer and a rheometer.
| Characteristic | Texture Analyzer | Rheometer |
|---|---|---|
| Primary Function | Measures mechanical/textural properties via simulated real-world interactions [1] | Studies flow and deformation of matter under applied stress [1] |
| Sample Assumption | Handles heterogeneous and homogeneous samples effectively; no assumption of uniformity [1] | Requires homogeneous samples for reliable and reproducible data [1] |
| Typical Measured Parameters | Hardness, Fracturability, Chewiness, Gumminess, Adhesiveness, Springiness [1] [22] | Viscosity, Yield Stress, Viscoelastic Moduli (G', G"), Creep Recovery [1] [31] |
| Ideal Sample Types | Solid, semi-solid, or composite structures (e.g., whole sandwiches, yoghurt with fruit, layered desserts) [1] | Homogeneous liquids, pastes, gels, and melts (e.g., oils, simple sauces, polymer solutions) [1] |
The Heterogeneity Challenge: Experimental Evidence and Limitations
Why Rheometers Struggle with Complex Samples
The confinement of rheometry to homogeneous samples is not a mere preference but a technical necessity. When a heterogeneous sample (e.g., a suspension with particles, an emulsion with phase separation, or a yoghurt with fruit chunks) is tested in a rheometer, several phenomena can occur that invalidate the data [1]:
- Non-Representative Results: Different components within the sample (e.g., a soft matrix and a hard inclusion) will respond to stress differently, leading to measurements that do not represent the bulk material.
- Slippage: Particulates or oils can migrate, creating a layer at the interface between the sample and the measuring tool (e.g., plate or cone), leading to an apparent reduction in measured viscosity and stress.
- Edge Fracture and Wall Depletion: In rotational flow, solid components can be ejected from the high-shear region at the edge of the tool, or particles can migrate away from the wall, leaving a particle-depleted layer. This disrupts the flow field and makes the measurement unreliable.
- Poor Reproducibility: Due to the inconsistent distribution of heterogeneous components, measurements from the same batch can vary significantly.
How Texture Analyzers Manage Heterogeneity
Texture analyzers circumvent these issues by operating on a different principle. They treat the heterogeneous sample as a complete system and measure its bulk mechanical response to a defined deformation. This approach is inherently suited to complex foods because:
- It mimics the actual consumer experience of biting into a product containing multiple components [1].
- The measurement does not assume uniform stress distribution. The force detected is the sum total of resistances from all components—soft and hard, liquid and solid—within the path of the probe.
- Various fixtures and probes (e.g., compression plates, multiple blade shears, puncture probes) can be selected to best simulate the specific interaction of interest, making the technique highly adaptable.
Experimental Data: A Case Study on Gels
A scientific study directly comparing texture analyzer and rheometer measurements on carrageenan and pectin gels provides quantitative evidence of their differing outputs. The research used a texture analysis method involving stress-strain measurements on a confined gel with a plunger to calculate an apparent compression modulus [5]. The results showed that the values obtained from this texture analysis method were up to 15 times higher than the true Young's modulus, a fundamental property measurable by rheometry. This discrepancy was attributed to the contribution of stress from the sample deformed outside the plunger's cross-section and the lateral confinement of the incompressible gel [5]. This experiment highlights that texture analysis provides an empirical value that is highly dependent on the test geometry, rather than a fundamental material property. For quality control, this empirical value can be more relevant as it captures the complex mechanical response of the entire sample under a specific, defined stress.
Table 2: Summary of experimental findings from a comparative study on gels [5].
| Aspect | Texture Analysis (Compression Test) | Rheometry (Oscillatory Shear) |
|---|---|---|
| Measured Property | Apparent Compression Modulus | True Young's Modulus / Shear Moduli |
| Key Finding | Values up to 15x higher than the true Young's Modulus | Provides intrinsic, fundamental material properties |
| Attributed Cause | Sample confinement and deformation outside the plunger area; empirical nature of the test | Controlled deformation within a defined geometry; fundamental nature of the test |
| Implication | Provides a practical, if empirical, measure of firmness relevant to sensory perception | Provides a scientific basis for understanding molecular structure and interactions |
Research Reagent Solutions: Essential Tools for Texture Analysis
To implement texture analysis effectively, researchers utilize a suite of specialized tools and reagents. The following table details key components of a texture analysis workflow for complex foods.
Table 3: Key research reagents and solutions for texture analysis of heterogeneous foods.
| Item Name | Function/Brief Explanation |
|---|---|
| Texture Analyzer | The core instrument that applies a controlled force or deformation and records the sample's response. Key for generating force-time/displacement curves. |
| Calibration Weights | Essential for verifying the accuracy and precision of the force and distance measurements of the instrument, ensuring data integrity. |
| Various Probes & Fixtures | Different attachments (e.g., cylindrical probes, knife blades, shear cells, back-extrusion rigs) are used to simulate specific actions like biting, cutting, or spreading. |
| Standard Reference Materials | Certified materials with known texture properties (e.g., standardized gels) used for method validation and instrument performance verification. |
| Software for Data Analysis | Specialized programs that analyze the force-time curve to extract specific texture profile analysis (TPA) parameters like hardness, cohesiveness, and springiness. |
Decision Framework and Workflow for Food Analysis
The choice between a texture analyzer and a rheometer is not a matter of which instrument is superior, but which is the correct tool for the specific research question and sample type. The following diagram outlines a logical decision pathway for researchers.
Instrument Selection Workflow
In the comparative analysis of rheometers and texture analyzers for food research, the defining factor for instrument selection is often sample homogeneity. Rheometers are unparalleled for fundamental research into the structural and flow properties of homogeneous materials. However, for the vast and growing category of complex, multi-component, and heterogeneous food products, the texture analyzer emerges as the unequivocally robust and appropriate tool. Its ability to handle non-uniform samples without data compromise, coupled with its empirical design that directly correlates with consumer sensory experiences, makes it an indispensable asset for researchers and product developers aiming to quantify and control the textural quality of today's sophisticated food products.
In food analysis research, the choice between a rheometer and a texture analyzer is fundamental, dictating the quality, reliability, and interpretability of the data collected. These instruments, while sometimes used for complementary analyses, are founded on different measurement principles and are susceptible to distinct experimental pitfalls. Rheometers excel at quantifying fundamental viscoelastic properties like storage (G') and loss (G") modulus by applying controlled shear deformations to characterize a material's internal structure [1]. In contrast, texture analyzers measure empirical, multi-parameter mechanical properties such as hardness and chewiness, often by simulating real-world interactions like biting or spreading [1]. A critical understanding of the specific challenges associated with each technique—namely slippage, edge fracture, and non-representative data—is essential for researchers to select the appropriate tool, design robust experiments, and draw valid scientific conclusions. This guide objectively compares the performance of these instruments in the context of these common pitfalls, supported by experimental data and methodologies.
Theoretical Foundations and Pitfall Mechanisms
Defining the Core Pitfalls
- Slippage: This occurs when the sample fails to adhere to the measuring geometry surface, resulting in a relative motion between the sample and the tool. Instead of the sample deforming uniformly, the applied stress is dissipated at the interface, leading to a significant underestimation of the material's true resistance to flow or deformation [1].
- Edge Fracture: A phenomenon primarily in rotational rheometry where the sample's free surface (the edge) becomes unstable and ruptures at high deformations or shear rates. This fracture terminates the test and makes the measurement of steady-state flow properties impossible, as the sample geometry is no longer controlled [1].
- Non-Representative Data: This broad category encompasses data that does not accurately reflect the bulk property of the material intended for study. Causes include poor sampling techniques, testing a material under inappropriate conditions (e.g., wrong temperature), or, most critically, using an instrument whose measurement principle is incompatible with the sample's physical nature [1].
How Instrument Design Fosters Different Vulnerabilities
The susceptibility to these pitfalls is intrinsically linked to the instrument design and measurement objective. Rheometers require homogeneous samples to ensure that the applied stress and strain are evenly distributed throughout the tested volume, allowing for the calculation of fundamental material functions [1]. When a heterogeneous sample (e.g., one with chunks, beads, or particles) is tested, this core assumption is violated. The inclusions can cause local stress concentrations, impede uniform deformation, and lead to slippage or depletion at the geometry wall, thereby generating non-representative data [1].
Texture analyzers, on the other hand, make no assumption of homogeneity. They are designed to measure the macroscopic mechanical response of a sample as a whole, which is precisely how a consumer would interact with it. A heterogeneous structure, like a cookie with chips or a cream with exfoliating beads, is evaluated in its entirety, effectively bypassing the issues that plague rheological measurements of similar materials [1].
The following diagram illustrates the decision pathway for selecting the appropriate instrument based on sample characteristics and the associated risks of common pitfalls.
Experimental Comparison: Instrument Performance and Data Fidelity
Direct comparison of rheometers and texture analyzers reveals how their underlying principles lead to different data outputs and susceptibility to artifacts. The following table summarizes key differences observed in experimental settings.
Table 1: Experimental Comparison of Rheometer and Texture Analyzer Performance
| Aspect | Rheometer | Texture Analyzer |
|---|---|---|
| Measured Properties | Fundamental rheological properties: Viscosity, Yield Stress, Storage/Loss Modulus (G', G") [1] | Empirical textural properties: Hardness, Chewiness, Firmness, Crispiness [1] |
| Sample Requirement | Homogeneous, uniform structure [1] | Homogeneous or Heterogeneous (e.g., with chunks, beads, layers) [1] |
| Pitfall: Slippage | High risk with heterogeneous samples; particles/oils cause slip at tool interface [1] | Low risk; macroscopic compression/cutting is less susceptible to surface slip. |
| Pitfall: Edge Fracture | High risk at high deformations/shear rates, terminating tests [1] | Not applicable; deformation is typically confined and not shear-based. |
| Pitfall: Non-Representative Data | High risk if sample is heterogeneous, leading to poor reproducibility [1] | Low risk for consumer perception; method is designed for complex, real-world structures [1] |
| Data Correlation | An apparent compression modulus from texture analysis can be up to 15x higher than the true Young's modulus from rheometry [5] | Texture analysis provides a qualitative correlation with material properties but does not measure them directly [5]. |
Detailed Experimental Protocols
The data in Table 1 is derived from standard and comparative experimental methodologies used in material science and food research.
Protocol for Rheological Measurement of Viscoelastic Properties: A homogeneous sample (e.g., a smooth gel or syrup) is loaded between the parallel plates of a rheometer. A temperature control system is activated to maintain the test temperature. A small-amplitude oscillatory shear (SAOS) test is performed within the linear viscoelastic region (LVR) of the material, which is previously determined via a strain sweep. The frequency is varied (e.g., 0.1 to 100 rad/s) at a constant strain within the LVR, and the storage modulus (G') and loss modulus (G") are recorded as a function of frequency [1].
Protocol for Texture Analysis via Compression/Strain Measurement: A sample of specified dimensions (e.g., a cylinder of gel 20mm in height and diameter) is placed on the base of the texture analyzer. A probe (e.g., a cylindrical plunger) with a diameter larger than the sample is compressed into the sample at a constant speed. The force-distance curve is recorded, and parameters such as hardness (peak force), cohesiveness, and springiness are calculated from the curve [5] [1]. This method is also known as a "Texture Profile Analysis" (TPA).
Protocol for Direct Comparison of Moduli: As referenced in Table 1, a comparative study was conducted on carrageenan and pectin gels. The apparent compression modulus was calculated from a texture analysis test (confined compression with a plunger). This value was then compared to the true Young's modulus obtained from a rheometer using parallel plates compression stress-relaxation and oscillatory torsion shear deformation. The study found a significant discrepancy, attributing it to the contribution of stress from sample deformed outside the plunger's cross-section and the lateral confinement of the incompressible gel [5].
The Scientist's Toolkit: Essential Research Reagent Solutions
Selecting the correct materials and tools is paramount for obtaining reliable and reproducible data. The following table details key solutions and their functions in the context of rheological and texture analysis.
Table 2: Key Research Reagent Solutions for Food Analysis
| Item | Function & Application |
|---|---|
| Standard Reference Gels (e.g., Carrageenan, Pectin) | Used for instrument calibration and validation of experimental protocols. Their well-characterized rheological and textural properties provide a benchmark for performance comparison [5]. |
| Rheometer Parallel Plate Geometry | The standard tool for oscillatory shear testing of gels and pasty samples. Allows for easy loading and cleaning and is suitable for temperature-controlled studies. |
| Texture Analyzer Cylindrical Plunger | A common probe for performing compression and penetration tests (e.g., for TPA). The ratio of plunger diameter to sample size is critical for generating meaningful and comparable data [5]. |
| Temperature Control Unit (Peltier System) | Essential for both rheometers and texture analyzers. Many food properties are highly temperature-dependent; controlled temperature ensures data reflects the intended test condition. |
| 3D Topographical Imaging Microscope | While not a standard tool for food, advanced fracture analysis (e.g., in brittle snacks) can benefit from 3D surface mapping to quantitatively characterize fracture surfaces and understand failure mechanisms, as demonstrated in materials science [42]. |
Workflow for a Comprehensive Material Characterization
A robust approach to characterizing a new food material often involves the sequential use of both techniques to gain a complete picture from fundamental properties to empirical perception. The following workflow diagram outlines this integrated methodology.
The journey to obtaining reliable mechanical data for food analysis is fraught with potential missteps. Slippage, edge fracture, and non-representative data are not merely operational nuisances but are direct consequences of a mismatch between the instrument's operational principles and the sample's physical characteristics. As demonstrated, rheometers are unparalleled for probing the fundamental viscoelastic nature of homogeneous materials but are highly vulnerable to artifacts when faced with heterogeneity. Texture analyzers, designed for empirical assessment, thrive on complexity and provide data that directly correlates to consumer experience but do not yield fundamental material properties.
The choice is not about which instrument is superior, but which is the right tool for the specific scientific question at hand. By understanding the inherent vulnerabilities of each technique and employing a structured experimental approach, researchers can navigate these common pitfalls, ensuring their data is both technically sound and contextually meaningful.
In food analysis research, the selection of appropriate instrumental methods is paramount for obtaining accurate, relevant, and reproducible data. The core dichotomy often lies in choosing between a rheometer and a texture analyzer, instruments founded on distinct physical principles and designed to probe different aspects of material properties. Rheology is defined as the study of the flow and deformation of matter, focusing on fundamental properties like viscosity, elasticity, and viscoelasticity (often reported as storage modulus G' and loss modulus G") [1]. In contrast, texture analysis employs empirical or imitative methods to quantify mechanical attributes such as hardness, chewiness, and crispiness, which are more directly correlated with sensory perception [1] [2].
Framing this comparison within a broader thesis, it is critical to understand that these instruments are not inherently interchangeable but are frequently complementary. The choice hinges on the research objective: rheometers are ideal for investigating the fundamental, often microstructural, properties of a material, particularly its response to flow and small deformations. Texture analyzers excel in simulating real-world mechanical actions like biting, spreading, or cutting, providing data that often correlate more directly with consumer experience [1] [43]. This guide provides a detailed, method-oriented comparison to empower researchers in optimizing their selection of probes, fixtures, and test parameters for robust food analysis.
Comparative Operating Principles and Application Scope
The primary distinction between these instruments originates from their underlying measurement philosophies. A rheometer typically applies a controlled stress or strain to a homogeneous sample and measures the resultant strain or stress, operating well within the material's linear viscoelastic region (LVER) to probe its fundamental structure without causing failure [1] [5]. This makes it unparalleled for characterizing the flow behavior of sauces, the gelation point of polysaccharides, or the viscoelastic structure of hydrocolloids.
Conversely, a texture analyzer is designed to apply a deformation that often leads to sample failure, measuring the force required to achieve this. It is an empirical tool that mimics a process, such as mastication or spreading [43]. Its strength lies in handling heterogeneous samples (e.g., yoghurt with fruit chunks, a layered sandwich, or a grainy suspension) which are problematic for rheometry due to issues like slippage, edge fracture, and non-representative sampling [1]. Texture analyzers are thus the instrument of choice for evaluating the firmness of cheese, the crispiness of a snack, or the spreadability of butter.
The following workflow outlines the key decision-making process for selecting the appropriate instrument and method based on research goals and sample characteristics.
Experimental Protocols for Method Optimization
To illustrate the practical application and data output of both techniques, we detail standardized protocols for a common food matrix: a gel system. These methodologies allow for a direct comparison of the information generated by each instrument.
Protocol 1: Texture Profile Analysis (TPA) of a Food Gel
Objective: To quantify the mechanical textural properties of a gel sample through a double compression test that simulates the chewing action [4] [3].
Equipment: Texture Analyzer equipped with a 50 N load cell and a cylindrical compression probe (e.g., 25-50 mm diameter).
Sample Preparation: The gel is prepared according to a standardized formula and carefully cut into uniform cylindrical probes (e.g., 15 mm height × 20 mm diameter). Care is taken to ensure the top and bottom surfaces are parallel [4].
Test Parameters:
- Test Type: Double Compression (TPA)
- Pre-test Speed: 1.0 mm/s
- Test Speed: 1.0 mm/s
- Post-test Speed: 1.0 mm/s
- Strain: 50% of original sample height (to simulate a bite)
- Time Between Compressions: 5 seconds
- Trigger Force: 5 g
- Data Acquisition Rate: 200 points per second [4] [3]
Data Analysis: The resulting force-time curve is analyzed to extract key texture parameters, as illustrated below.
Protocol 2: Oscillatory Rheology of a Food Gel
Objective: To characterize the viscoelastic structure and gelation kinetics of the gel sample by measuring its response to a small, oscillating deformation [5] [4].
Equipment: Rheometer equipped with a Peltier temperature control system and a parallel plate geometry (e.g., 40 mm diameter).
Sample Preparation: The gel solution is prepared and carefully loaded onto the rheometer plate, ensuring minimal sample disturbance and no air bubble entrapment. The geometry is then lowered to a defined gap (e.g., 1 mm), and excess sample is trimmed.
Test Parameters:
- Geometry: Parallel Plate (40 mm diameter)
- Gap: 1.0 mm
- Strain: 0.5% (determined to be within the Linear Viscoelastic Region - LVER via an amplitude sweep)
- Angular Frequency: 1 rad/s to 100 rad/s (for a frequency sweep)
- Temperature: 25°C (held constant)
- Data Acquisition: Continuous recording of G' (Storage Modulus) and G" (Loss Modulus) [5] [4]
Data Analysis: The mechanical spectrum from the frequency sweep is interpreted. A solid-like, well-structured gel is typically indicated by G' > G" across the entire frequency range, with both moduli showing relative independence of frequency.
Quantitative Data Comparison and Analysis
The following tables synthesize typical experimental data, highlighting how the two instruments provide different yet complementary quantitative insights.
Table 1: Comparison of Measurement Parameters and Outputs
| Parameter | Rheometer | Texture Analyzer |
|---|---|---|
| Primary Measured Quantity | Stress (τ), Strain (γ), Complex Modulus (G*) | Force (F), Distance/Displacement (Δx) |
| Key Calculated Properties | Viscosity (η), Storage/Loss Modulus (G', G"), Tan δ | Hardness, Springiness, Cohesiveness, Chewiness, Fracturability |
| Typical Deformation Mode | Small, often non-destructive (within LVER) | Large, typically destructive (beyond yield point) |
| Sample Homogeneity Requirement | High (critical for reliable data) [1] | Low to High (can handle heterogeneous samples) [1] |
| Data Correlation | Fundamental material properties (molecular/ microstructure) | Empirical & sensory properties (consumer perception) [2] |
Table 2: Experimental Data from a Gel Study (Illustrative Values) [5] [4]
| Sample Type | Rheology (Oscillatory Shear) | Texture Analysis (TPA) | |||
|---|---|---|---|---|---|
| G' @ 10 rad/s (Pa) | G" @ 10 rad/s (Pa) | Hardness (N) | Cohesiveness | Springiness | |
| κ-Carrageenan Gel | 5,000 | 500 | 12.5 | 0.65 | 0.92 |
| Pectin Gel | 3,000 | 400 | 8.7 | 0.72 | 0.88 |
| Cultured Meat Sausage | N/A | N/A | 18.2 | 0.55 | 0.85 |
Note: The apparent compression modulus from a texture analyzer can be up to 15 times higher than the true Young's modulus measured via fundamental methods due to sample confinement and incompressibility, underscoring the empirical nature of the data [5].
The Scientist's Toolkit: Essential Research Reagent Solutions
Selecting the correct accessories and consumables is as critical as choosing the instrument itself. The following table details key components for both techniques.
Table 3: Essential Probes, Fixtures, and Materials
| Item | Function | Application Example |
|---|---|---|
| Parallel Plate Geometry | A rheometer fixture for controlling shear rate; ideal for viscous fluids, soft solids, and gels. Allows easy loading and gap setting [5]. | Measuring the viscoelastic modulus of a yogurt or a hydrogel. |
| Cone-and-Plate Geometry | Provides a constant shear rate across the entire sample volume, preferred for absolute viscosity measurements of homogeneous fluids. | Determining the flow behavior index (n) of a chocolate syrup. |
| Cylindrical Compression Probe | A Texture Analyzer probe for performing TPA and firmness tests via uniaxial compression. | Quantifying the firmness and chewiness of a cheese or gel sample [4] [3]. |
| Warner-Bratzler Blade | A V-notched blade fixture for a Texture Analyzer that measures the force to shear a sample. | Evaluating the tenderness of meat or meat alternatives [2] [4]. |
| Spreadability Rig | A specialized fixture that simulates the action of spreading a product with a knife. | Objectively comparing the spreadability of butter, margarine, or creams [44] [43]. |
| Universal Sample Clamp | A fixture for a Texture Analyzer that secures samples or containers during tests for adhesive products. | Preventing a sample from lifting during a penetration or withdrawal test, ensuring accurate adhesiveness measurement [43]. |
The decision to employ a rheometer or a texture analyzer is not a matter of which instrument is superior, but which is more appropriate for the specific research question at hand. Rheometers provide fundamental insights into the internal structure and flow properties of homogeneous materials, making them indispensable for understanding formulation chemistry and predicting processing behavior. Texture analyzers deliver empirical and imitative data that directly correlate with sensory perception and product performance, even for complex, heterogeneous materials.
For a comprehensive research thesis, the most powerful approach often involves a complementary strategy. A rheometer can be used to optimize a base formulation for its microstructural properties, while a texture analyzer can subsequently validate that the final product meets the desired sensory and textural benchmarks. By strategically applying the method optimization principles for probes, fixtures, and test speeds outlined in this guide, researchers can leverage the strengths of both instruments to drive robust and impactful conclusions in food science and product development. Future advancements are likely to focus on the integration of these techniques with tools from tribology and artificial intelligence to build even more predictive models of sensory perception [2].
In food analysis research, understanding the mechanical and flow properties of materials is fundamental for product development, quality control, and predicting consumer perception. Two instrumental techniques dominate this landscape: the rheometer, which studies the deformation and flow of matter, and the texture analyzer, which measures mechanical properties through simulated practical interactions [1]. While these terms are sometimes used interchangeably, they represent distinct methodologies with different applications, theoretical foundations, and data interpretation protocols.
Rheology provides fundamental insights into material structure by examining parameters like viscosity and viscoelasticity under controlled flow conditions. In contrast, texture analysis offers empirical measurements that often correlate more directly with sensory attributes, quantifying properties like hardness, chewiness, and spreadability [1] [2]. This guide provides an objective comparison of these techniques, supported by experimental data and protocols, to assist researchers in selecting the appropriate methodology for their specific analytical requirements.
Fundamental Principles and Measured Parameters
Rheological Measurements
Rheology is defined as the study of the flow and deformation of materials. It characterizes how substances respond to applied forces, encompassing both liquid and solid behaviors [1]. Rheometers excel at measuring fundamental properties that reflect the internal structure of materials at a molecular level.
Key Rheological Parameters:
- Viscosity: Resistance to flow, measured under varying shear conditions.
- Shear Stress/Shear Rate Relationships: Fundamental flow curves.
- Yield Stress: Critical stress required to initiate flow.
- Viscoelastic Moduli: Storage modulus (G') measures elastic solid-like behavior; Loss modulus (G") measures viscous liquid-like behavior.
- Creep and Recovery: Time-dependent deformation and recovery after stress removal [1].
Texture Analysis Measurements
Texture refers to the physical properties of a material perceived by touch and mouthfeel. Texture analyzers measure mechanical properties by simulating real-world interactions such as biting, spreading, or compressing [1]. Texture Profile Analysis (TPA) is a widely used method that simulates the biting action of teeth through a double compression cycle [11].
Key Textural Parameters from TPA:
- Hardness: Maximum force during first compression.
- Fracturability: Force at the first significant break in the curve.
- Adhesiveness: Negative force area representing work needed to overcome attraction.
- Springiness: Degree to which a sample returns to original height after deformation.
- Cohesiveness: Extent of sample deformation before rupture.
- Gumminess: Hardness × Cohesiveness (for semi-solids).
- Chewiness: Hardness × Cohesiveness × Springiness (for solids) [11].
Instrument Selection Guide
The choice between a rheometer and texture analyzer depends on sample characteristics, research questions, and the nature of the required data.
Table 1: Instrument Selection Criteria
| Criterion | Rheometer | Texture Analyzer |
|---|---|---|
| Primary Application | Flow behavior, viscoelastic properties [1] | Mechanical properties, sensory correlation [1] |
| Sample Type | Homogeneous liquids, pastes, gels [1] | Heterogeneous solids, semi-solids, composites [1] |
| Sample Requirement | Homogeneous structure [1] | Homogeneous or heterogeneous structures [1] |
| Data Output | Fundamental material properties (viscosity, moduli) [1] | Empirical & imitative properties (hardness, chewiness) [1] |
| Measurement Principle | Continuous flow or oscillatory shear [45] | Compression, tension, penetration, extrusion [11] |
Table 2: Handling of Sample Heterogeneity
| Aspect | Rheometer | Texture Analyzer |
|---|---|---|
| Structural Assumption | Assumes uniform material behavior [1] | Does not assume uniform behavior [1] |
| Effect of Particles | Problematic (slippage, wall depletion) [1] | Acceptable (reflects real-world interaction) [1] |
| Composite Structures | Not suitable | Suitable (e.g., sandwiches, layered products) [1] |
| Data Reproducibility | Challenging with heterogeneous samples [1] | Generally good with proper method [1] |
Experimental Protocols and Data Interpretation
Standard Rheological Protocol
Objective: To characterize the flow behavior and viscoelastic properties of a cosmetic cream formulation [45].
Materials and Equipment:
- Controlled-strain rheometer
- Parallel plate geometry (appropriate diameter)
- Temperature control unit (capable of maintaining 32±1°C)
- Sample loading tools
Procedure:
- Sample Loading: Load sample onto Peltier plate, lower upper geometry with defined gap (e.g., 1 mm), trim excess material.
- Temperature Equilibration: Allow sample to equilibrate at 32°C (skin temperature) for 5-10 minutes.
- Yield Stress Test:
- Apply increasing shear stress from 0.1 to 100 Pa.
- Record viscosity as function of stress.
- Identify yield point as stress where viscosity decreases dramatically.
- Amplitude Sweep (to determine Linear Viscoelastic Region - LVR):
- Apply oscillatory strain from 0.01% to 100% at constant frequency (e.g., 1 Hz).
- Plot G' and G" versus strain.
- Identify critical strain where G' decreases (end of LVR).
- Frequency Sweep (within LVR):
- Apply oscillatory strain at constant amplitude (within LVR).
- Sweep frequency from 0.1 to 100 rad/s.
- Record G' and G" as function of frequency.
Data Interpretation:
- Yield Stress: Correlates with pourability from container [45].
- LVR Length: Longer LVR indicates more structured/firm cream [45].
- G' and G" Crossover: Indicates stickiness; no crossover suggests non-sticky product [45].
- Frequency Dependence of G': Independent G' suggests solid-like behavior; dependent G' suggests more liquid character [45].
Texture Profile Analysis (TPA) Protocol
Objective: To evaluate textural properties of food samples through double compression simulation of biting [11].
Materials and Equipment:
- Texture analyzer with 25-50 kg load cell
- Compression platen or cylindrical probe
- Texture Expert or similar software
- Sample preparation tools
Procedure:
- Sample Preparation: Prepare bite-size pieces with defined dimensions (e.g., 15×15×15 mm cubes).
- Method Setup:
- Pre-test speed: 1.0 mm/s
- Test speed: 1.0 mm/s
- Post-test speed: 1.0 mm/s
- Target strain: 50-75% (for first compression)
- Time between compressions: 3-5 seconds
- Trigger force: 0.1 N
- Test Execution:
- Perform double compression cycle.
- Record force-time curve throughout test.
- Data Analysis:
- Identify key points on TPA curve for parameter calculation.
Data Interpretation from TPA Curve:
- Hardness: Peak force (Anchor 2) during first compression [11].
- Fracturability: First significant peak in first compression (if present) [11].
- Adhesiveness: Negative force area after first compression (Area 2:3) [11].
- Springiness: Distance (Time diff 4:5)/(Time diff 1:2) between end of first compression and start of second [11].
- Cohesiveness: Ratio (Area 4:6)/(Area 1:3) of positive areas under second and first compressions [11].
- Gumminess: Hardness × Cohesiveness [11].
- Chewiness: Hardness × Cohesiveness × Springiness [11].
Diagram 1: TPA Test Sequence
Comparative Experimental Data
Quantitative Comparison of Gel Measurements
A comparative study on carrageenan and pectin gels revealed significant methodological differences between instrumental approaches [5].
Table 3: Comparison of Texture Analyzer and Rheometer Measurements on Gels
| Measurement Type | Apparent Compression Modulus | True Young's Modulus | Discrepancy Factor |
|---|---|---|---|
| Texture Analysis(Compression with plunger) | Up to 15 times higher | Reference value | 15× |
| Rheometer(Parallel plate oscillation) | Closer to true value | Reference value | Minimal |
| Key Finding | Confined compression in texture analyzeroverestimates modulus due tosample incompressibility andlateral confinement [5] |
Correlation with Sensory Properties
Research on cosmetic creams demonstrated how rheological parameters quantitatively predict sensory attributes:
Table 4: Rheological Correlates of Sensory Attributes in Creams
| Sensory Attribute | Testing Stage | Rheological Test | Correlating Parameter |
|---|---|---|---|
| Pourability | Appearance | Yield stress test | Yield stress value [45] |
| Firmness | Pick-up | Amplitude sweep | Length of LVR [45] |
| Spreadability | Rub-out | Viscometry flow curve | Viscosity at relevant shear rate [45] |
| Stickiness | Rub-out | Frequency sweep | Crossover of G' and G" [45] |
| Elasticity/Stretchability | Pick-up | Frequency sweep | Magnitude and frequencydependence of G' [45] |
Research Reagent Solutions
Table 5: Essential Materials for Rheology and Texture Analysis
| Reagent/Material | Function/Application | Example Use Cases |
|---|---|---|
| Carrageenan/pectin gels | Model viscoelastic systems formethod validation [5] | Instrument correlation studies |
| Hydrocolloids (starches, gums) | Modify viscosity andviscoelastic properties [2] | Structure-function relationship studies |
| Traditional Balsamic Vinegar | Complex fluid with crystallizationbehavior [46] | Rheological quality assessment |
| Oil-in-water emulsion creams | Model systems forcosmetic/pharmaceutical studies [45] | Sensory-rheological correlation |
| Standard reference materials | Instrument calibration andmethod validation | Ensuring measurement accuracy |
Advanced Applications and Future Perspectives
Integrated Approaches for Complex Attributes
Modern food science recognizes that simple rheological or textural measurements cannot fully capture complex sensory attributes like creaminess, astringency, or graininess. Emerging approaches combine rheology (mechanical properties) with tribology (lubrication and friction properties) to better predict mouthfeel sensations [2]. For instance, while thickness primarily relates to viscosity, creaminess involves both viscosity and lubricating properties that can be measured by tribological methods [2].
Statistical methods like Principal Component Analysis (PCA) and Multivariate Regression Analysis (MRA) are increasingly employed to link instrumental measurements with sensory data [46] [2]. These approaches can identify which combination of instrumental parameters best predicts specific sensory attributes.
Novel Analytical Techniques
Future methodological developments include:
- Micro-analytical techniques for small sample volumes
- Tactile sensing technologies that better mimic human touch
- Biomimetic approaches simulating oral surfaces and motions
- Multi-modal sensing integrating multiple measurement principles [2]
Diagram 2: Instrument Selection Workflow
Rheometers and texture analyzers provide complementary approaches to material characterization in food research. The selection between these methodologies should be guided by:
- Sample characteristics (homogeneous vs. heterogeneous)
- Nature of research questions (fundamental properties vs. practical performance)
- Required data output (theological parameters vs. sensory-correlative measurements)
- End application (quality control, product development, or fundamental research)
For comprehensive product understanding, researchers increasingly employ both techniques in parallel, recognizing that rheology excels at characterizing fundamental material structure, while texture analysis better predicts consumer perception and practical performance in real-world applications. Future methodological developments will likely focus on integrating these approaches with tribology and advanced sensory science to provide more complete prediction of consumer experiences.
Data Correlation and Validation: Bridging Instrumental and Sensory Outcomes
The global vegan cheese market is undergoing rapid transformation, reaching $3 billion in 2024 and projected to expand to $7.5 billion by 2033 [47]. This growth is fueled by increasing consumer demand for sustainable, ethical, and lactose-free alternatives to traditional dairy products. Despite market enthusiasm, significant technical challenges remain in replicating the complex functional and sensory properties of dairy cheese in plant-based alternatives, particularly in key performance areas such as meltability, stretch, and texture [48] [47].
This case study provides an objective, data-driven comparison between commercial dairy and plant-based cheeses, focusing on their physicochemical properties, microstructure, and functional performance. Furthermore, it situates this product benchmarking within a broader methodological framework, comparing the application of rheometers and texture analyzers for food analysis research. These instruments provide complementary data streams essential for quantifying the fundamental differences between product categories and correlating instrumental measurements with sensory perception [1] [49].
Analytical Framework: Rheometry vs. Texture Analysis in Food Research
Selecting appropriate analytical instrumentation is critical for generating meaningful, reproducible data in food science research. Rheometers and texture analyzers measure distinct yet complementary material properties.
Rheometry: Probing Fundamental Viscoelastic Properties
Rheology is the study of the deformation and flow of matter [1]. A rheometer applies controlled stress or strain to a homogeneous material and measures its resulting deformation, providing fundamental insights into its viscoelastic properties [1] [49]. Key parameters include:
- Storage Modulus (G'): Quantifies the solid-like, elastic component of a material, representing energy stored and recovered per cycle.
- Loss Modulus (G"): Quantifies the liquid-like, viscous component, representing energy lost as heat per deformation cycle.
- Loss Tangent (tan δ): The ratio G"/G', indicating the relative dominance of viscous vs. elastic behavior [49].
- Complex Modulus (G*): The overall resistance to deformation, or rigidity [50].
Rheometry is ideal for understanding a product's internal structure and molecular interactions under conditions simulating processing, storage, and consumption [49]. However, it typically requires homogeneous samples to ensure uniform stress distribution during testing [1].
Texture Analysis: Measuring Macroscopic Mechanical Properties
Texture analysis involves measuring the response of a food when subjected to mechanical forces that simulate real-world handling and consumption, such as cutting, compressing, or chewing [20]. A Texture Analyzer moves a probe to compress or stretch a sample while recording the force response, generating data on properties like hardness, fracturability, chewiness, and springiness [20].
Unlike rheometers, texture analyzers can effectively handle heterogeneous samples (e.g., cheeses with grains or aggregates) because they measure macroscopic properties and do not assume uniform material behavior [1]. This makes them excellent for correlating instrumental measurements with sensory perception (mouthfeel).
The following workflow illustrates how these two techniques can be integrated in a comparative food study:
Experimental Data and Comparative Analysis
Composition, Nutrition, and Price
Plant-based cheeses exhibit significantly different nutritional profiles and often command a higher price point compared to their dairy counterparts.
Table 1: Nutritional and Price Comparison per 100g/100mL (Median Values)
| Parameter | Dairy Cheddar Cheese | Plant-Based Cheese (General) | Dairy Milk (Whole) | Soya Milk |
|---|---|---|---|---|
| Energy (kcal) | Higher | Lower [51] | - | - |
| Protein (g) | Higher | Significantly Lower [51] | - | Lower (except soya) [51] |
| Fat (g) | Higher | Lower [51] | - | - |
| Calcium (mg) | Higher | Lower (unless fortified) [51] | - | - |
| Iodine (μg) | Higher | Significantly Lower [51] | - | - |
| Price | Lower | Significantly More Expensive [51] | Similar | Similar |
Functional and Textural Properties
The functional performance of cheese, particularly during heating, is a critical quality benchmark. The data below highlight the performance gap between dairy and standard plant-based products, as well as the improvement possible with specialized high-protein plant-based (HPC) formulations.
Table 2: Functional and Textural Properties
| Property | Dairy Cheese | Commercial Plant-Based Cheese | High-Protein Plant-Based (HPC) |
|---|---|---|---|
| Meltability | Optimal / High [52] [47] | Low / Considerable structural integrity after heating [52] | Notable improvement over standard plant-based [52] |
| Stretchability | Optimal / High [52] [47] | Low [52] | Notable improvement over standard plant-based [52] |
| Cold State Texture | Ideal texture profile [52] | Least resemblance to dairy cheese [52] | Improved texture vs. standard plant-based [52] |
| Storage Modulus (G') | - | Highest (Cold State) [52] | Lower than standard plant-based [52] |
| Loss Tangent (tan δ) | - | Lowest (Cold State) [52] | Higher than standard plant-based (more viscous) [52] |
| Heating Behavior | Fat pooling and matrix yielding [52] | Minimal structural change; irreversible starch matrix [52] | Similar microstructure to dairy upon melting [52] |
Microstructural Insights
Microstructural analysis reveals the fundamental physical reasons behind the performance differences.
- Dairy Cheese: Comprises a high density of small fat globules entrapped within a continuous casein protein network. Upon heating, this network yields, allowing for fat pooling while maintaining matrix connectivity, which enables stretching and flowing [52] [49].
- Commercial Plant-Based Cheese: While it may also contain small fat globules, its matrix is often dominated by an irreversible starch or protein network that does not yield under heat, leading to poor melt and stretch [52].
- High-Protein Plant-Based Cheese (HPC): Features significantly larger fat globules and protein aggregates. However, upon melting, it can display fat pooling and a yielding matrix similar to dairy cheese, correlating with its improved functionality [52].
Rheo-microscopy, which combines rheological testing with simultaneous microscopy, visually captures these differences. The diagram below summarizes how the structural components of each cheese type dictate its functional behavior.
Detailed Experimental Protocols
To ensure reproducibility and provide a clear standard for researchers, detailed methodologies for key characterization tests are outlined below.
Dynamic Oscillatory Temperature Ramp Test via Rheometry
This test quantifies how the viscoelastic properties of cheese change with temperature, directly indicating melting behavior and solid-liquid transitions [49].
- Objective: To characterize the melting profile and viscoelastic transition of cheese from refrigeration to cooking temperatures.
- Instrumentation: Discovery Hybrid Rheometer (DHR) or equivalent, equipped with a Peltier temperature control system and parallel plate geometry (25-mm sandblasted plates recommended to reduce wall slip) [49].
- Sample Preparation: Load the sample onto the preheated geometry (70°C) in a molten state to erase thermal and mechanical history. Trim excess sample and cool to the initial test temperature. A low-viscosity silicon oil can be used to coat the sample edge to prevent drying [49].
- Test Parameters:
- Mode: Oscillation
- Temperature Range: 70°C to 10°C (or 20°C to 80°C for melting studies) [49] [50]
- Cooling/Heating Rate: 2°C/min [49]
- Strain Amplitude: A value (e.g., 0.05%) determined to be within the Linear Viscoelastic Region (LVR) via a prior strain sweep test [49].
- Frequency: 1 Hz (6.28 rad/s) [49]
- Axial Force: Controlled at 0 ± 0.1 N to compensate for thermal expansion/contraction [49].
- Key Outputs:
- Storage (G') and Loss (G") Moduli vs. Temperature: The crossover point (G' = G") indicates the gelation point (during cooling) or the solid-to-liquid transition (during heating) [49].
- Tan δ vs. Temperature: Reveals shifts in the material's viscous-elastic balance.
Texture Profile Analysis (TPA) via Texture Analyzer
TPA is a two-bite compression test that mimics the action of the jaw, providing parameters that correlate well with sensory perception [20].
- Objective: To simulate oral processing and quantify textural attributes like hardness, springiness, and cohesiveness.
- Instrumentation: TA.XTplus Texture Analyzer or equivalent, equipped with a cylindrical compression probe (e.g., 35-mm diameter).
- Sample Preparation: Prepare cheese samples of uniform geometry (e.g., cylinders 20mm height x 20mm diameter). Ensure consistent, flat surfaces for testing.
- Test Parameters:
- Test Type: Compression
- Target Mode: Strain (typically 50-75% of original height)
- Test Speed: 1.0 mm/s (pre-test and post-test speed may be set higher, e.g., 2.0 mm/s)
- Time Between Cycles: 5 seconds (to allow for sample recovery)
- Key Outputs [20]:
- Hardness: Maximum force during the first compression cycle.
- Springiness: The degree to which the sample returns to its original height after the first compression.
- Cohesiveness: The ratio of the area under the second compression curve to the area under the first compression curve (a measure of internal bond strength).
- Chewiness: The product of Hardness × Cohesiveness × Springiness (for solid products).
Rheo-Microscopy for Melt Profile Characterization
This advanced technique couples rheology with in-situ microscopy, allowing researchers to visualize structural changes responsible for the measured rheological behavior [50].
- Objective: To simultaneously measure rheological properties and observe microstructural evolution (e.g., fat coalescence, protein breakdown) during heating.
- Instrumentation: Rheometer coupled with an optical microscope, equipped with a temperature-controlled stage and fluorescence filters.
- Sample Preparation: Stain cheese samples with fluorescent dyes (e.g., Nile Red for lipids, Acridine Orange for carbohydrates). Apply cover slip and allow to stabilize [50].
- Test Parameters:
- Key Outputs:
- Complex Modulus (G) vs. Temperature/Time: Quantifies rigidity changes during melting/cooling cycles [50].
- Microscopy Images: Provide visual evidence of structural phenomena like fat pooling in dairy cheese versus the stability of the starch matrix in plant-based cheese, explaining the differences in G profiles [50].
The Scientist's Toolkit: Key Research Reagent Solutions
Successful formulation and analysis of plant-based cheese rely on a specific set of ingredients and analytical tools.
Table 3: Essential Materials and Reagents for Plant-Based Cheese Research
| Item | Function/Application | Example/Note |
|---|---|---|
| TICAGEL CA 0979 M Modified Corn Starch | Key texturizer providing dairy-like melt and stretch in plant-based matrices [47]. | Outperforms other commercial starches in melt, stretch, and shredding functionality [47]. |
| Casein Protein Powder | Provides protein content and contributes to texture in some plant-based analogs [53]. | Used in "high-protein plant-based cheese" (HPC) formulations [52]. |
| Soy Milk / Protein Sludge | Plant-based protein source and bulk matrix former [53]. | A primary ingredient in many research formulations [53]. |
| Coconut Oil | Primary fat source, mimicking the role of milk fat in dairy cheese [53]. | Contributes to mouthfeel and melting characteristics [52]. |
| Carrageenan & Xanthan Gum | Hydrocolloids used as gelling and stabilizing agents to control water retention and texture [53]. | Often used in combination to achieve specific viscoelastic properties. |
| Nile Red & Acridine Orange | Fluorescent dyes for staining lipids (Nile Red) and carbohydrates (Acridine Orange) in rheo-microscopy [50]. | Enables visualization of microstructure and phase separation during heating [50]. |
| Sandblasted Parallel Plates | Rheometer geometry for cheese testing, reduces wall slip common in high-fat samples [49]. | Standard diameter: 25 mm [49]. |
Correlating Instrumental Data with Sensory Panels and Consumer Acceptance
In food product development, the ultimate measure of success is consumer acceptance. While trained sensory panels provide detailed profiles of a product's attributes, these methods are time-consuming, costly, and subject to human variability. Consequently, the food industry and research institutions heavily rely on instrumental methods to predict sensory perception and anticipate consumer preferences objectively and efficiently. Two principal instrumental approaches dominate this field: rheology, which studies the flow and deformation of matter, and texture analysis, which measures mechanical properties often linked to the tactile experience. This guide provides a comparative analysis of rheometers and texture analyzers, examining their capabilities, the data they generate, and the strength of their correlation with the human sensory experience. The objective is to equip researchers and scientists with the knowledge to select the appropriate tool for linking instrumental measurements to consumer hedonic responses.
Fundamental Principles: Rheology vs. Texture Analysis
Rheology and texture analysis probe distinct yet complementary aspects of a material's physical properties. Understanding their core principles is essential for their correct application.
Rheology is the science of the deformation and flow of materials [1]. It characterizes fundamental material properties, focusing on responses to applied stresses and strains under controlled, often homogeneous, conditions. Rheometers are ideal for quantifying properties like viscosity (resistance to flow), elasticity (ability to recover shape), and viscoelasticity (a combination of viscous and elastic behaviors) through parameters such as the storage modulus (G') and loss modulus (G") [1]. A core assumption of fundamental rheological measurement is that the sample is homogeneous; heterogeneous samples can lead to unreliable data due to issues like slippage or edge fracture [1].
Texture Analysis employs a texture analyzer to measure the mechanical properties of a food as they are perceived by touch, including during chewing (mouthfeel) [1]. Instead of measuring fundamental material properties, texture analysis often provides empirical or imitative data. It simulates real-world mechanical actions like biting, cutting, spreading, or chewing [1]. It is exceptionally well-suited for heterogeneous samples (e.g., yoghurt with fruit chunks, cereals, layered desserts) because it does not assume uniform material behavior and can evaluate composite structures as a whole [1].
The following diagram illustrates the primary focus and perception mechanisms of these two approaches in the context of food texture.
Diagram 1: Pathways of Food Texture Perception and Instrumental Measurement. This chart outlines how different food properties are measured instrumentally and linked to sensory perception pathways.
Comparative Instrumental Capabilities
The choice between a rheometer and a texture analyzer is dictated by the research question, the nature of the sample, and the target sensory attributes. The table below summarizes their core characteristics and optimal use cases.
Table 1: Comparative Analysis: Rheometers vs. Texture Analyzers
| Feature | Rheometer | Texture Analyzer |
|---|---|---|
| Core Measurement | Fundamental material properties (viscosity, viscoelasticity) [1] | Mechanical & physical properties (hardness, fracturability) [1] |
| Primary Principle | Measures stress, strain, and flow under defined deformation [1] | Measures force as a function of time/distance during probe-sample interaction [3] |
| Sample Suitability | Homogeneous liquids, pastes, gels [1] | Homogeneous and heterogeneous solids, semi-solids [1] |
| Typical Outputs | Viscosity, Yield Stress, G' (Elastic Modulus), G" (Viscous Modulus) [1] | Hardness, Springiness, Cohesiveness, Chewiness, Fracturability [4] [3] |
| Sensory Link | Thickness, Spreadability, Flowability [2] | Firmness, Chewiness, Crispiness, Hardness [1] [2] |
| Key Advantage | Provides deep insights into material structure and flow behavior [1] | Excellent at simulating real-world handling and consumption (biting, spreading) [1] |
Experimental Protocols for Correlation Studies
Establishing a robust correlation requires standardized protocols for both instrumental and sensory methods. Below are detailed methodologies for key tests.
Texture Profile Analysis (TPA)
TPA is a double-compression test that mimics the action of the jaw, providing a multi-parameter textural fingerprint [4] [3].
- Sample Preparation: Samples are typically cut into uniform cylinders (e.g., 8-20 mm height and diameter). Consistency in size and shape is critical for reproducibility. For heterogeneous samples, a larger diameter may be needed to ensure representativeness [4].
- Instrumental Setup: A texture analyzer is fitted with a flat cylindrical probe (e.g., 50-75 mm diameter). The test involves two compression cycles.
- Protocol:
- Pre-test: The probe descends at a defined speed (e.g., 1 mm/s) until it contacts the sample surface and a trigger force (e.g., 0.05 N) is detected.
- First Compression: The probe compresses the sample to a predetermined strain (e.g., 50% or 75% of its original height) at a constant speed (e.g., 1-2 mm/s).
- First Withdrawal: The probe retracts from the sample at the same or a faster speed.
- Wait Period: The sample is allowed to recover for a set time (e.g., 3-5 seconds).
- Second Compression: The probe repeats the compression cycle, following the same parameters as the first.
- Data Interpretation: The resulting force-time curve is analyzed to extract key parameters as illustrated below [3]:
- Hardness: Maximum force (N) during the first compression cycle (F1).
- Fracturability: The first significant peak force (N) in the first compression, if present (F0).
- Cohesiveness: Ratio of the area under the second compression curve to the area under the first compression curve (A2/A1).
- Springiness: The distance (mm) or time (s) the sample recovers between the first and second compressions (T2/T1).
- Chewiness: Calculated as Hardness × Cohesiveness × Springiness (for semi-solid foods).
- Resilience: The ratio of the area under the upstroke to the area under the downstroke of the first compression (A4/A3) [4].
Diagram 2: Texture Profile Analysis (TPA) Workflow. This flowchart outlines the key steps in a TPA test and where primary parameters are derived.
Oscillatory Rheology for Viscoelastic Characterization
This test probes the viscoelastic structure of a material without causing destructive failure, ideal for gels, creams, and semi-solids.
- Sample Preparation: Homogeneous samples are carefully loaded onto the rheometer measuring geometry (e.g., parallel plate, cone-and-plate) to avoid air bubbles and ensure uniform contact.
- Instrumental Setup: A strain-controlled or stress-controlled rheometer with appropriate geometry is used. A solvent trap is often employed to prevent sample drying.
- Protocol:
- Amplitude Sweep: The oscillation frequency is held constant while the strain (or stress) amplitude is progressively increased. This determines the Linear Viscoelastic Region (LVR), where the microstructure remains intact.
- Frequency Sweep: Conducted within the LVR at a fixed strain, the oscillation frequency is varied (e.g., from 10 Hz to 0.1 Hz). This simulates different time scales of processing or consumption.
- Data Interpretation:
- Storage Modulus (G'): Quantifies the elastic, solid-like component of the material. A higher G' indicates a more rigid, structured network.
- Loss Modulus (G"): Quantifies the viscous, liquid-like component. A higher G" indicates a more dissipative, flowable material.
- Loss Tangent (tan δ): The ratio G"/G'. A tan δ < 1 indicates dominant solid-like behavior (gel), while tan δ > 1 indicates dominant liquid-like behavior (sol) [1].
Correlating Instrumental Data with Sensory Attributes
The ultimate goal of instrumental testing is to predict sensory outcomes. Strong correlations have been established for several key attributes.
Table 2: Correlation between Instrumental Data and Sensory Attributes
| Sensory Attribute | Primary Instrument | Correlating Instrumental Parameter(s) | Correlation Strength & Notes |
|---|---|---|---|
| Thickness / Viscosity | Rheometer | Apparent Viscosity (at a defined shear rate) [2] | Typically strong correlation for homogeneous fluids. |
| Firmness / Hardness | Texture Analyzer | Hardness (from TPA or puncture test) [1] [4] | Very strong correlation, a direct mechanical analog. |
| Spreadability | Rheometer | Yield Stress, Complex Viscosity [1] | Strong correlation; yield stress indicates the force required to initiate flow. |
| Chewiness | Texture Analyzer | Chewiness (TPA parameter) [4] [3] | Strong correlation, as the parameter is designed to mimic mastication energy. |
| Springiness | Texture Analyzer | Springiness (TPA parameter) [4] | Strong correlation with sensory perception of elasticity and rebound. |
| Creaminess | Rheometer & Tribometer | High Viscosity, Low Friction [2] | A complex attribute; requires a multi-parameter approach for good prediction. |
| Grittiness / Graininess | (Challenging for both) | Particle Size Analysis, Microscopy [2] | Poor correlation with standard rheology/TPA; relates to geometrical properties. |
A practical example comes from the development of cultured meat. A 2022 study used TPA to compare the mechanical properties of a cultured meat sausage with commercial meat products [4]. The research demonstrated that by adjusting formulations and processes, the hardness, chewiness, and springiness of the cultured product could be engineered to fall within the range of traditional products, providing a quantitative basis for achieving a familiar and acceptable sensory experience [4].
The Scientist's Toolkit: Essential Research Reagents and Materials
Successful correlation studies require more than just the primary instruments. The following table lists key solutions and materials essential for robust experimental design.
Table 3: Essential Research Reagents and Materials for Texture Analysis
| Item | Function | Example Application |
|---|---|---|
| Texture Analyzer | Applies controlled deformation to measure force-response profiles. | Performing TPA, puncture tests, and tensile tests on solid and semi-solid foods [4] [3]. |
| Rheometer | Characterizes flow and viscoelastic properties under controlled stress/strain. | Measuring viscosity profiles of sauces and viscoelastic moduli of gels [1] [4]. |
| Standard Reference Materials | Calibrates instruments to ensure accuracy and reproducibility. | Using standard weights for force calibration and standard oils for viscosity calibration. |
| Sensory Analysis Software | Manages panelist data, collects ratings, and performs statistical analysis. | Conducting Temporal Check-All-That-Apply (TCATA) or Time-Intensity (TI) studies [2]. |
| Statistical Analysis Software | Identifies correlations and builds predictive models. | Performing Principal Component Analysis (PCA) to link instrumental and sensory data [2]. |
Rheometers and texture analyzers are both powerful, yet distinct, tools in the predictive toolbox of food science. The choice is not which is better, but which is fit-for-purpose. Rheometers excel at probing the fundamental structural properties of homogeneous materials, providing insights crucial for process design and stability. Texture analyzers shine in simulating real-world consumption scenarios, especially for complex, heterogeneous foods, delivering empirical data that often directly translates to sensory perceptions like hardness and chewiness.
The future of correlating instrumental data with consumer acceptance lies in multi-modal approaches. No single instrument can capture the full complexity of sensory perception. Emerging trends include the integration of tribology (friction studies) to better understand mouthfeel attributes like creaminess and astringency, the use of artificial intelligence to build sophisticated predictive models from complex datasets, and the development of biomimetic robotic systems that more accurately replicate the entire oral processing journey [2] [22]. By strategically combining these tools, researchers can continue to close the gap between laboratory data and the delightful, subjective experience of the consumer.
This guide provides an objective comparison between rheometers and texture analyzers, two pivotal instruments in food analysis research. By presenting direct experimental data and detailed methodologies, this article equips researchers and development professionals with the evidence needed to select the appropriate instrumental technique for their specific quality control and product development objectives.
Instrument Fundamentals: Rheometers vs. Texture Analyzers
Understanding the core principles of each instrument is essential for proper application selection.
- Rheology is the study of the flow and deformation of matter, focusing on properties like viscosity, elasticity, and viscoelasticity under various force conditions [1]. A rheometer is the instrument used for these measurements, providing deep insights into a material's internal structure and flow behavior [54].
- Texture refers to the physical properties of a material perceived by touch (e.g., mouthfeel). Key attributes include hardness, chewiness, crispiness, and cohesiveness [1]. A Texture Analyzer quantifies these properties by simulating real-world mechanical interactions such as biting, cutting, or spreading [1].
The choice between these tools often hinges on the nature of the sample and the research question. Rheometers assume sample homogeneity for reliable measurement of flow properties, while texture analyzers are adept at handling heterogeneous samples (e.g., yoghurt with fruit chunks, cereals) as they measure macroscopic properties reflecting actual consumer interactions [1].
Direct Experimental Comparison
A practical study comparing the analysis of three everyday paste-like foods—smooth peanut butter, American mustard, and chocolate spread—highlights the capabilities and limitations of each instrument [54].
Viscometer (Single-Point Measurement) Results and Limitations
The study found that standard viscometers, often used for basic viscosity checks, face significant challenges with structured materials [54]. The use of disk spindles can create holes in the sample, leading to poor contact, while the instrument's limited torque range frequently results in error messages. The data obtained is a single viscosity value, which is useful for quality control but offers limited insight.
Table 1: Single-Point Viscosity Measurements from a Viscometer [54]
| Sample | Viscosity (Pa.s) |
|---|---|
| Smooth Peanut Butter | 32.5 |
| American Mustard | 9.5 |
| Chocolate Spread | 25.0 |
Rheometer (Multi-Point Profiling) Results and Insights
In contrast, the rheometer provided a comprehensive profile of each material's behavior without the operational challenges encountered by the viscometer [54]. Key tests in the "Rheology Snapshot" included:
- Shear Rate Sweep: Characterizes how viscosity changes under different processing conditions (e.g., pumping, spreading).
- Thixotropy Testing: Measures the time-dependent recovery of viscosity after shearing, critical for understanding structure recovery.
- Oscillatory Measurements: Gently probes the material's internal structure to determine properties like rigidity (complex modulus) and the stress required to initiate flow (yield stress).
Table 2: Rheometer-Measured Material Properties [54]
| Sample | Viscosity at Low Shear (Pa.s) | Viscosity at High Shear (Pa.s) | Complex Modulus (Pa) | Yield Stress (Pa) |
|---|---|---|---|---|
| Smooth Peanut Butter | 1000 | 10 | 100,000 | 500 |
| American Mustard | 100 | 1 | 10,000 | 50 |
| Chocolate Spread | 500 | 5 | 50,000 | 200 |
Experimental Protocols for Method Comparison
To ensure reliable and valid instrumental comparisons, a rigorous experimental design must be followed. The following protocol is adapted from established method validation standards in clinical science, which provide a robust framework for assessing systematic error (bias) between measurement procedures [55] [56].
Sample Selection and Preparation
- Number of Samples: A minimum of 40 different patient (or in this case, food) specimens should be tested, though 100 is preferable to identify matrix-related interferences [56].
- Concentration Range: Samples must be carefully selected to cover the entire clinically—or in food science, functionally—meaningful measurement range. Avoid gaps in the data [56].
- Replication: Perform duplicate measurements for both the test and comparative method to minimize the effects of random variation [56].
- Randomization: Analyze samples in a randomized sequence to avoid carry-over effects and systematic bias [56].
Data Analysis and Graphical Presentation
- Graphical Inspection: The first step in data analysis is visual inspection. Create scatter plots (test method vs. comparative method) and difference plots (test result minus comparative result vs. the average of both) to identify outliers, the range of agreement, and potential constant or proportional biases [56].
- Statistical Calculations:
- For a wide analytical range: Use linear regression analysis to estimate the slope and y-intercept. This allows for the estimation of systematic error (bias) at any critical decision concentration and reveals whether the error is constant or proportional [55].
- For a narrow analytical range: Calculate the average difference (bias) between the two methods using a paired t-test approach. The standard deviation of the differences describes the distribution of these between-method discrepancies [55].
The Scientist's Toolkit: Essential Research Reagents and Materials
Successful instrumental analysis requires not only the primary device but also a suite of supporting tools and materials.
Table 3: Essential Research Toolkit for Instrumental Analysis
| Item | Function |
|---|---|
| Reference Materials | Certified materials with known properties used to calibrate instruments and verify the accuracy of measurements. |
| Standard Geometries | Interchangeable tools (e.g., parallel plates, cone-and-plate, cylindrical probes) that define how stress is applied to a sample in a rheometer or texture analyzer. |
| Temperature Control Unit | Maintains the sample at a precise, uniform temperature during testing, as temperature significantly influences material properties. |
| Data Analysis Software | Specialized software for controlling the instrument, acquiring data, and performing complex calculations (e.g., regression analysis, modulus derivation). |
Decision Framework for Instrument Selection
The choice between a rheometer and a texture analyzer is not a matter of which is better, but which is more appropriate for the specific research goal.
Both rheometers and texture analyzers are indispensable for establishing a gold standard in food quality control. The rheometer excels as a tool for fundamental research and formulation science, providing unparalleled insight into the microscopic interactions that define a material's flow and structural properties. The texture analyzer serves as a bridge to consumer perception and product performance, delivering macroscopic data that directly correlates with sensory experience. A sophisticated quality control program will leverage the complementary strengths of both instruments to build a complete understanding of product performance from the molecule to the consumer.
For researchers and scientists in food analysis, selecting the appropriate analytical instrument is crucial for obtaining meaningful data. The choice between a rheometer and a texture analyzer is often presented as a dichotomy, but a more sophisticated approach recognizes their complementary strengths. Rheometry provides deep insights into the fundamental flow and viscoelastic properties of materials, often at a microstructural level [38] [57]. In contrast, texture analysis offers empirical and imitative measurements that frequently show a stronger correlation with sensory perception and consumer experience [2] [28]. This guide objectively compares the performance of these instruments and details how their integrated use enables a holistic analysis of food products.
Core Instrument Principles and Capabilities
At a fundamental level, these instruments are designed to answer different types of questions about a material's properties.
The Rheometer: Probing Microstructure and Flow
A rheometer is a precision instrument that studies the deformation and flow of matter under applied stress [38] [57]. Its key advantage lies in characterizing viscoelasticity—the simultaneous display of solid-like (elastic) and liquid-like (viscous) behavior [31]. By performing tests like amplitude sweeps, frequency sweeps, and temperature sweeps, a rheometer can reveal information about a material's internal structure, such as the strength of a gel network or the stability of an emulsion, at a molecular level [38] [57]. It is the instrument of choice for understanding why a material behaves the way it does.
The Texture Analyzer: Measuring Macroscopic Mechanical Properties
A texture analyzer operates by applying a controlled force or deformation to a sample and measuring its response [28]. It is exceptionally well-suited for empirical and imitative tests that simulate real-world interactions, such as biting, spreading, or cutting [2] [28]. Unlike rheology, texture analysis does not assume material homogeneity; it can effectively handle heterogeneous samples like whole fruits, layered desserts, or products with inclusions (e.g., yoghurt with chunks) [1]. Its data often directly correlates with sensory attributes like hardness, chewiness, and crispiness [28].
Table 1: Fundamental Comparison of a Rheometer and a Texture Analyzer
| Aspect | Rheometer | Texture Analyzer |
|---|---|---|
| Primary Function | Measures flow & deformation; characterizes viscoelasticity [38] [57] | Measures mechanical properties & texture via force/distance [28] |
| Property Type | Fundamental (intrinsic material properties) [28] | Empirical & Imitative (correlates with sensory/handling) [2] [28] |
| Sample Ideal | Homogeneous, uniform structure [1] | Homogeneous or Heterogeneous (e.g., with chunks, layers) [1] |
| Typical Outputs | Viscosity, Yield Stress, Storage/Loss Modulus (G', G") [38] [57] | Hardness, Firmness, Chewiness, Springiness, Fracturability [28] [58] |
| Data Correlation | Microstructure, stability, processability [31] [57] | Sensory perception, consumer experience, quality control [2] [28] |
Experimental Protocols for Comparative Analysis
To illustrate the complementary data provided by each technique, the following protocols can be applied to a single product, such as a cream cheese or a cultured meat sausage [59].
Protocol 1: Rheological Characterization
Objective: To determine the viscoelastic properties and flow behavior of the sample.
- Equipment: Rotational rheometer (e.g., HAAKE MARS iQ), parallel plate or serrated plate geometry (to prevent slippage), Peltier temperature control system [38] [60].
- Sample Preparation: Sample is molded into a uniform disc (e.g., 35mm diameter) to ensure consistent loading and gap setting between the plates [38].
- Key Experiments:
- Amplitude Sweep:
- Frequency Sweep:
- Methodology: Conducted within the LVER at a constant strain, while the oscillation frequency is varied.
- Data Output: Reveals the material's structure over time scales. Measures Storage Modulus (G') and Loss Modulus (G") to classify the material as a viscoelastic solid (G' > G") or liquid (G" > G') [57].
- Temperature Sweep:
- Methodology: Temperature is ramped (e.g., 5°C to 90°C at 2°C/min) under constant oscillation.
- Data Output: Tracks changes in complex viscosity (η*) and phase angle (δ) to identify melting points, gelation, or other thermal transitions [38].
Protocol 2: Texture Profile Analysis (TPA)
Objective: To simulate the chewing action and quantify key textual parameters.
- Equipment: Texture Analyzer (e.g., ZwickiLine, Brookfield CTX) with a load cell and a flat-plate or cylindrical probe [28] [59].
- Sample Preparation: Sample is cut into a uniform cylinder (e.g., 8mm diameter and height). Precautions are taken to maintain original moisture content [59].
- Methodology: A double compression cycle (often to 50-75% of original height) is performed with a brief pause between cycles. The test speed and target deformation are kept constant [59].
- Data Output and Analysis: The resulting force-time curve is analyzed for several parameters [59]:
- Hardness: The peak force of the first compression cycle.
- Springiness: The degree to which the sample returns to its original height after the first compression.
- Cohesiveness: The ratio of the areas under the second and first compression cycles, indicating the material's internal bond strength.
- Chewiness: The product of Hardness × Cohesiveness × Springiness.
Diagram 1: Workflow for Texture Profile Analysis (TPA) illustrating the test sequence and derivation of key parameters from force-time data.
Integrated Data Interpretation: A Case Study Approach
The true power of a complementary approach is revealed when data from both instruments is interpreted together.
Table 2: Complementary Data from Rheometry and Texture Analysis on a Hypothetical Sample
| Sensory Attribute | Rheometer Data Insight | Texture Analyzer Data Insight | Holistic Interpretation |
|---|---|---|---|
| Firmness/Hardness | High Storage Modulus (G') indicates a strong, solid-like gel structure [38] [57]. | High Hardness value from TPA or puncture test [28] [58]. | A strong internal microstructure (rheology) directly results in a firm sensory experience (texture). |
| Spreadability | Low Yield Stress and significant shear-thinning behavior allows flow under low stress [31] [57]. | Low Firmness and/or low force required in a spreadability rig test [28]. | The material is structurally stable at rest but easily breaks down and flows when manipulated. |
| Melt-in-Mouth | Phase Angle (δ) shifts towards 90° (viscous) at body temperature (37°C), indicating melting [38]. | A sharp decrease in hardness and high cohesiveness in TPA at 37°C. | The microstructural breakdown measured by rheology correlates with the rapid loss of texture in the mouth. |
| Grittiness/Graininess | Limited direct measurement. Heterogeneous samples can cause poor data quality [2] [1]. | Effectively detects and quantifies particle presence through irregular force-deformation profiles [2] [28]. | Texture analysis is superior for quantifying geometrical properties related to particle size and distribution. |
Case Study: Cheese vs. Vegan Alternative
A study using a HAAKE MARS iQ rheometer compared dairy cheese and a vegan alternative [38].
- Rheological Data: The amplitude sweep showed the vegan cheese had a higher storage modulus (G') and a lower phase angle (δ) at 37°C, meaning it was more elastic and lost its structure less readily than the dairy cheese. A temperature sweep revealed the dairy cheese had a distinct melting point at 48°C, while the vegan alternative did not melt but formed a more elastic gel [38].
- Complementary Texture Data: While not shown in the same study, a texture analyzer would be expected to show higher hardness and chewiness for the vegan cheese at body temperature, and a higher force required in a wire-cutting test (simulating biting), directly quantifying the "rubbery" texture implied by the rheological data.
This multi-instrument approach provides formulators with a complete picture: the rheometer explains the structural basis (starch vs. protein network), while the texture analyzer quantifies the resulting sensory experience.
Essential Research Reagent Solutions
The following table details key materials and tools required for the experiments described in this guide.
Table 3: Essential Research Reagents and Tools for Food Texture and Rheology Analysis
| Item | Function/Application | Example Use Case |
|---|---|---|
| Parallel Plate Geometry | Absolute measuring geometry for rheometers; ideal for soft solids and high-viscosity samples [57]. | Testing viscoelastic properties of cheese, gels, or pastes [38]. |
| Serrated or Sandblasted Plates | Relative measuring geometry that prevents wall slip in rheometers for heterogeneous samples [57]. | Testing samples like yogurt with weak gel structures that may slip on smooth plates. |
| Cylindrical Probe | A common probe for texture analyzers used for compression and TPA tests [28] [59]. | Performing Texture Profile Analysis (TPA) on cultured meat or cheese samples [59]. |
| Warner-Bratzler Shear Blade | A shearing attachment for texture analyzers that simulates cutting [2] [28]. | Measuring the tenderness of meat or meat alternatives [2] [59]. |
| Back Extrusion Rig | An attachment for texture analyzers that forces material through an annular gap [28]. | Measuring the consistency and cohesiveness of viscous liquids and pastes like Crème Fraiche [58]. |
| Peltier Temperature Control System | Provides precise and rapid temperature control for a rheometer's measuring geometry [38]. | Conducting temperature sweeps to study melting behavior or gel formation [38]. |
Decision Workflow for Technique Selection
Integrating both techniques is ideal, but practical constraints often require a strategic choice. The following workflow aids in this decision.
Diagram 2: Technique Selection Workflow to guide researchers in choosing between a rheometer, a texture analyzer, or a combined approach based on their specific sample and research questions.
The dichotomy between rheometers and texture analyzers is a false one for the advanced food researcher. The most robust and insightful food analysis strategy leverages the complementary nature of these techniques. The rheometer provides a deep, fundamental understanding of why a material behaves as it does through its microstructure and flow properties. The texture analyzer delivers critical empirical data on how the material performs in practical, consumer-relevant scenarios. By integrating both instruments into a holistic analysis workflow, scientists and product developers can accelerate R&D, optimize processes, and ultimately create superior food products with precisely controlled sensory profiles.
In food analysis research, selecting the appropriate instrument for material characterization is crucial. Rheometers and texture analyzers are foundational tools, yet they differ fundamentally in their approach, the data they generate, and their applicability to different sample types. This guide provides an objective comparison of these instruments, detailing their limitations and the specific scope of data obtained from each.
Operational Principles and Data Outputs
At their core, rheometers and texture analyzers measure different physical properties. Understanding this distinction is key to selecting the right tool.
- Rheometers probe the flow and deformation properties of materials, focusing on properties like viscosity, elasticity, and viscoelasticity under controlled stress or strain. They are designed to understand how a material behaves at a molecular or microstructural level [1].
- Texture Analyzers measure mechanical properties perceived by touch, such as hardness, chewiness, crispiness, and fracturability. They simulate real-world interactions like biting, spreading, or cutting to provide data that often correlates directly with sensory perception [1] [28].
The following table summarizes the fundamental differences in their operation and outputs.
| Feature | Rheometer | Texture Analyzer |
|---|---|---|
| Primary Measured Properties | Viscosity, elastic modulus (G'), viscous modulus (G''), yield stress, complex modulus [1]. | Hardness, fracturability, chewiness, gumminess, adhesiveness, springiness, cohesiveness [28]. |
| Typical Sample Form | Homogeneous liquids, pastes, gels [1]. | Solids, semi-solids, and heterogeneous materials (e.g., fruits, biscuits, yogurts with chunks) [1]. |
| Nature of Data Output | Fundamental material properties (often absolute values) [28]. | Empirical or imitative measurements (relative values, often specific to the test setup) [28]. |
| Key Operational Principle | Applies controlled shear stress or strain to measure flow and viscoelastic response [1]. | Applies controlled force or distance to simulate a real-world action and measures the resistance [28]. |
Key Limitations and Challenges
The strengths of each instrument are coupled with inherent limitations that define their appropriate use.
Rheometer-Specific Limitations
- Requires Homogeneous Samples: Rheometers assume the sample has a uniform structure throughout the testing volume. Heterogeneous samples (e.g., yogurt with fruit chunks, creams with exfoliating beads, or suspensions with settling particles) can cause poor reproducibility, slippage, and non-representative results because the applied stress is not evenly distributed [1].
- Complex Data Interpretation: Extracting meaningful fundamental properties can require sophisticated analysis and a strong understanding of rheological concepts. Converting raw force and deformation data into parameters like modulus and viscosity involves complex equations that may not be intuitive for all users [28].
- Limited to Simple Geometries and Small Strains for Fundamental Testing: For fundamental tests that calculate absolute material properties, rheometry typically requires samples of uniform and regular shape. These tests also often assume small deformations (1-3% strain), which may not represent the large, destructive strains encountered during eating [28].
- Indirect Correlation to Sensory Experience: While rheology provides deep scientific insight into material structure, the data it produces (e.g., loss tangent, complex modulus) may not directly translate to a human perceivable texture attribute like "crunchiness" or "creaminess" [28].
Texture Analyzer-Specific Limitations
- Provides Empirical, Not Fundamental, Data: Texture analysis results are highly dependent on the specific probe geometry, sample size, and test conditions. A hardness value obtained with a 5mm cylinder probe cannot be directly compared to one from a 10mm probe. This means the data is relative and not an intrinsic material property, making comparison between different studies or labs challenging [28].
- Limited Insight into Microstructure: While a texture analyzer can tell you how hard or chewy a product is, it provides little direct information about why—the underlying microstructural elements like molecular interactions, particle size distribution, or polymer network structure that cause the texture [1].
- Less Suitable for Simple Liquids: It is difficult to design a meaningful test for low-viscosity liquids (e.g., water, milk, juice) using a texture analyzer, as they offer little mechanical resistance to compression or penetration. Rheometers are the preferred tool for characterizing such materials [1].
- Requires Careful Test Design: To ensure data is relevant, the test must accurately simulate the real-world condition being studied. Choosing the wrong probe or test speed can yield data that does not correlate with actual consumer perception [28].
Decision Workflow and Experimental Design
The choice between a rheometer and a texture analyzer is guided by the research question, sample nature, and the type of data required. The following diagram outlines the decision-making process.
Experimental Protocols for Food Analysis
To illustrate practical applications, here are detailed methodologies for common tests in food research.
Protocol 1: Gel Strength and Brittleness Analysis with a Texture Analyzer
This protocol is ideal for characterizing products like gelatin gels, dairy desserts, or structured plant-based products [28].
- Sample Preparation: Prepare a gel and set it in a cylindrical container with a diameter at least 3x greater than the probe. Ensure a smooth, flat surface. Measure and record the exact diameter and height of the gel sample.
- Instrument Setup: Fit the texture analyzer with a spherical or cylindrical probe. Select a compression test. Set the test speed to 1 mm/s and a target deformation of 50% of the sample's original height.
- Data Acquisition: Conduct the test. The resulting force-time curve will show a peak force (indicating hardness or gel strength) followed by a rapid drop (indicating fracturability or brittleness). The area under the curve can indicate cohesiveness [28].
- Data Interpretation: Analyze the curve for key parameters. Higher peak force indicates a harder, stronger gel. A sharper, more pronounced drop after the peak indicates a more brittle structure.
Protocol 2: Yield Stress and Flow Behavior with a Rheometer
This protocol is used for products like ketchup, yogurt, mayonnaise, or thick sauces to determine the stress required to initiate flow and the subsequent thinning behavior [1].
- Sample Preparation: Load the sample carefully onto the rheometer's plate, ensuring no air bubbles are trapped. For yield stress measurement, a roughened plate or serrated geometry is often used to prevent wall slip.
- Instrument Setup: Select a cone-plate or parallel plate geometry with an appropriate gap. Equilibrate the sample temperature. For a comprehensive analysis, program two test sequences:
- Flow Ramp: A logarithmic sweep of shear stress or shear rate.
- Oscillation Stress Sweep: A sweep of oscillatory stress at a fixed frequency.
- Data Acquisition: Run the tests. The flow ramp will produce a flow curve (viscosity vs. shear rate). The oscillation stress sweep will show the elastic (G') and viscous (G'') moduli as a function of stress.
- Data Interpretation: The stress value where G' and G'' cross over (where the material transitions from solid-like to liquid-like behavior) is often reported as the dynamic yield stress. From the flow curve, the static yield stress can be identified as the stress required to initiate flow from rest, and the degree of shear thinning can be quantified [1].
Essential Research Reagent Solutions
The following table details key materials and tools required for conducting the featured experiments.
| Item Name | Function / Application |
|---|---|
| High-Precision Analytical Balance | Weighing ingredients to an accuracy of 0.1 mg, crucial for preparing consistent sample formulations with minor components like vitamins or preservatives [61]. |
| Standard Reference Gels/Fluids | Calibrating both rheometers and texture analyzers; used for method validation and ensuring inter-laboratory reproducibility [28]. |
| Spherical/Cylindrical Probes | Attachments for texture analyzers used for puncture and compression tests to measure hardness and fracturability in gels and soft solids [28]. |
| Parallel Plate/Cone-Plate Geometries | Standard measuring systems for rheometers, suitable for a wide range of viscous and semi-solid materials like sauces, creams, and gels [1]. |
| Serrated or Roughened Plate Geometries | Rheometer accessories designed to prevent wall slip during testing of yield stress fluids like ketchup or mayonnaise [1]. |
| pH and Water Activity Meter | Characterizes sample environment, which critically impacts rheological and textural properties, as well as microbial stability and shelf-life [61]. |
| Temperature Control Unit (Peltier) | Precise temperature control for a rheometer or texture analyzer chamber, essential for studying temperature-dependent behavior (e.g., melting, gelling) [61]. |
Comparative Experimental Data
To concretely illustrate the difference in data output, consider a hypothetical study on a strawberry yogurt.
| Test Instrument | Measured Parameter | Value Obtained | Interpretation in Context |
|---|---|---|---|
| Texture Analyzer | Hardness (Peak Force) | 85.6 g | The yogurt requires this much force to penetrate; relates to perceived "thickness" or "firmness" on the spoon. |
| Texture Analyzer | Adhesiveness (Work of Adhesion) | -45.3 g·sec | The work required to pull the probe away; relates to how much the yogurt "sticks" to the mouth. |
| Rheometer | Yield Stress | 32.4 Pa | The minimum stress required to make the yogurt flow; determines if it will hold its shape in a container or slump. |
| Rheometer | Storage Modulus (G') | 15.8 Pa | Indicates the solid-like, elastic character of the yogurt's protein network at rest. |
| Rheometer | Loss Modulus (G'') | 9.2 Pa | Indicates the liquid-like, viscous character of the yogurt's continuous phase. |
| Rheometer | Complex Viscosity | 2.8 Pa·s | The overall resistance to flow under oscillatory conditions. |
Rheometers and texture analyzers are complementary, not competing, tools in the food scientist's toolkit. The "limitation" of one instrument is often the strength of the other. The rheometer excels at providing fundamental, microstructural insights for homogeneous materials, while the texture analyzer shines in providing empirical, macro-mechanical data that directly correlates with sensory experience for complex, heterogeneous products. A thorough material characterization strategy often leverages both instruments to build a complete picture from molecular interactions to consumer perception.
Conclusion
Rheometers and texture analyzers are not competing tools but complementary pillars of modern food analysis. The rheometer excels in probing the fundamental, microstructural forces governing flow and viscoelasticity, which is critical for understanding processing behavior and stability. The texture analyzer provides macroscopic data that directly correlates with consumer sensory experiences like firmness, chewiness, and spreadability. The key takeaway is that the choice between them—or the decision to use them in tandem—is dictated by the specific research question and the nature of the food material. For complex, heterogeneous products, a combined approach often yields the most comprehensive understanding. Future directions involve the deeper integration of this instrumental data with sensory and tribological studies to build predictive models for consumer acceptance and performance, particularly in the rapidly advancing fields of personalized nutrition and novel food formulation, such as plant-based alternatives and functional foods for populations with specific needs like dysphagia.
References
- 1. Rheology vs. texture: Understanding the differences and ... [https://www.stablemicrosystems.com/blog/2025/rheology-vs-texture-understanding-the-differences-and-their-importance/]
- 2. Methods and instruments for the evaluation of food texture [https://www.sciencedirect.com/science/article/abs/pii/S0963996925004995]
- 3. Texture Analysis And Texture Profile Analysis [https://www.rheologylab.com/services/texture-analysis/]
- 4. Application of texture analysis methods for the ... [https://www.nature.com/articles/s41598-022-07785-1]
- 5. Comparison of texture analyser and rheometer ... [https://www.sciencedirect.com/science/article/abs/pii/B9781855737884500162]
- 6. How a Texture Analyser works [https://stablemicrosystems.com/texture-analysis/how-a-texture-analyser-works/]
- 7. Interlaboratory Measurement of Rheological Properties ... [https://pubmed.ncbi.nlm.nih.gov/31589341/]
- 8. Correlating instrumental textural properties to human ... [https://www.sciencedirect.com/science/article/pii/S2665927125002023]
- 9. Comparison of texture analyser and rheometer ... [https://www.sciencedirect.com/science/article/pii/B9781855737884500162]
- 10. Texture vs viscosity: Understanding their roles and ... [https://www.stablemicrosystems.com/blog/2025/texture-vs-viscosity-understanding-their-roles-and-differences/]
- 11. Understand your Texture Profile Analysis tests and analysis [https://www.stablemicrosystems.com/blog/2025/understand-your-texture-profile-analysis-tests-and-analysis/]
- 12. Chewiness - an overview [https://www.sciencedirect.com/topics/agricultural-and-biological-sciences/chewiness]
- 13. Correlation of instrumental texture properties from ... [https://pubmed.ncbi.nlm.nih.gov/30256358/]
- 14. Correlation Analysis of Subjective and Objective Texture ... [https://www.mdpi.com/2227-9717/12/11/2465]
- 15. Rheometer - A357 - CKN Knowledge in Practice Centre [https://compositeskn.org/KPC/A357]
- 16. Rheometer Explained: The Tool You Need for Complex ... [https://www.worldoftest.com/articles/rheometer-for-complex-material-analysis]
- 17. Rheometer - an overview | ScienceDirect Topics [https://www.sciencedirect.com/topics/engineering/rheometer]
- 18. Measure the texture of alternative proteins [https://stablemicrosystems.com/applications/alternative-proteins/]
- 19. Rheometers for Viscosity & Rheological Testing [https://www.brookfieldengineering.com/products/rheometers/help-me-choose]
- 20. Texture Analysis - A Beginner's Guide [https://www.stablemicrosystems.com/BeginnersGuideToTextureAnalysis.html]
- 21. Understanding the difference between materials testing ... [https://www.linkedin.com/pulse/understanding-difference-between-materials-testing-ndsze]
- 22. Food Texture Analysis [https://www.meegle.com/en_us/topics/food/food-texture-analysis]
- 23. What is Rheometer? Uses, How It Works & Top Companies ... [https://www.linkedin.com/pulse/what-rheometer-uses-how-works-top-companies-2025-irybc/]
- 24. Core Rheometry: Yield Stress, Time-dependency, and ... [https://www.tainstruments.com/applications-notes/core-rheometry-yield-stress-time-dependency-and-rheometry-tips-rh146/]
- 25. Rheometers and Viscometers Applications [https://www.thermofisher.com/us/en/home/life-science/lab-equipment/rheometry-viscometry/applications.html]
- 26. Yield-Stress Measurement | Practical Coatings Science [https://www.stevenabbott.co.uk/practical-rheology/Yield-Measurement.php]
- 27. Compression Testing | Texture Analyser [https://www.stablemicrosystems.com/compression-testing.html]
- 28. Types of testing | Texture Analyser methods [https://www.stablemicrosystems.com/test-types/]
- 29. Measure firmness hardness softness | Texture Analyser test [https://www.stablemicrosystems.com/properties/firmness-softness/]
- 30. Yogurt texture [https://www.lamyrheology.com/en/under-food-industry-1/]
- 31. Viscometer vs Rheometer: Discover Why a ... [https://www.tainstruments.com/viscometer-vs-rheometer-discover-why-a-rheometer-offers-more-than-just-viscosity-measurement-blog/]
- 32. Characterization of Dysphagia Thickeners Using Texture ... [https://pmc.ncbi.nlm.nih.gov/articles/PMC9323126/]
- 33. Food Texture and Rheological Properties Analysis [https://lab-solutions.dksh.com/food-science/physical-testing/texture/]
- 34. Characterization of Dysphagia Thickeners Using Texture ... [https://www.mdpi.com/2310-2861/8/7/430]
- 35. The Influence of Food Texture and Liquid Consistency ... [https://pmc.ncbi.nlm.nih.gov/articles/PMC4342510/]
- 36. Textural Classification of Commercial Foodstuffs for ... [https://pmc.ncbi.nlm.nih.gov/articles/PMC12611084/]
- 37. Artificial intelligence in dysphagia since the 21st century [https://pmc.ncbi.nlm.nih.gov/articles/PMC12399612/]
- 38. Testing the rheological properties of food using a rheometer [https://www.scimed.co.uk/education/rheological-properties-of-food/]
- 39. Comprehensive experimental assessments of rheological ... [https://pmc.ncbi.nlm.nih.gov/articles/PMC9335515/]
- 40. Texture analysis properties [https://stablemicrosystems.com/properties/]
- 41. Texture profile analysis and rheology of plant-based and ... [https://www.sciencedirect.com/science/article/pii/S0963996925002133]
- 42. Quantitative matching of forensic evidence fragments using ... [https://pmc.ncbi.nlm.nih.gov/articles/PMC11381546/]
- 43. Choosing the best test method for your texture analysis ... [https://www.stablemicrosystems.com/blog/2025/understanding-how-a-texture-analyser-works-choosing-the-best-test-method/]
- 44. Texture Compression Testing [https://www.mecmesin.com/test-type/compression-texture]
- 45. Quantitative Sensory Interpretation of Rheological ... [https://www.mdpi.com/2079-9284/7/1/2]
- 46. A rheological approach to the quantitative assessment of ... [https://www.sciencedirect.com/science/article/abs/pii/S0260877407005481]
- 47. Reinventing cheese: How dairy alternatives are ... [https://www.ingredion.com/na/en-us/be-whats-next/reinventing-market-cheese-with-dairy-alternatives]
- 48. Sensory evaluation of plant-based cheese: a systematic ... [https://pubmed.ncbi.nlm.nih.gov/40660898/]
- 49. Exploring the Viscoelastic Properties of Cheese Using a ... [https://www.tainstruments.com/applications-notes/exploring-the-viscoelastic-properties-of-cheese-using-a-rheometer-rh098/]
- 50. Rheo-Microscopy Melt Profiles: Dairy Vs Vegan Cheeses [https://www.rheologylab.com/articles/food/rheo-microscopy-for-melt-profiles-of-cheese/]
- 51. A comparison of the nutritional content and price between ... [https://pmc.ncbi.nlm.nih.gov/articles/PMC10924701/]
- 52. Exploration of structural differences between dairy and ... [https://www.sciencedirect.com/science/article/pii/S221332912500019X]
- 53. Formulation and evaluation of texture nutritional and ... [https://www.sciencedirect.com/science/article/pii/S2772502225001878]
- 54. Viscometers Tell You One Thing; Rheometers ... [https://www.rheologylab.com/viscometers-tell-you-one-thing-rheometers-tell-you-everything/]
- 55. The Comparison of Methods Experiment [https://www.westgard.com/lessons/basic-method-validation/lesson23.html]
- 56. Statistical analysis in method comparison studies part one [https://acutecaretesting.org/en/articles/statistical-analysis-in-method-comparison-studies-part-one]
- 57. Rheology in Food Testing – How a Rheometer ... | Technology Networks [https://www.technologynetworks.com/applied-sciences/articles/rheology-in-food-testing-how-a-rheometer-works-and-what-it-can-tell-you-364448]
- 58. and Beverage Applications Food [https://www.brookfieldengineering.com/brookfield-university/learning-center/application-notes/texture-applications/food-and-beverage]
- 59. Application of texture analysis methods for the ... [https://pmc.ncbi.nlm.nih.gov/articles/PMC8913703/]
- 60. HAAKE Rheometer and Viscometer Selection Guide [https://www.thermofisher.com/us/en/home/life-science/lab-equipment/rheometers-viscometers/rheometer-viscometer-selection-guide.html]
- 61. Advanced Food Product Development Lab Tools In 2025 [https://foodsure.co.in/blog/food-product-development-lab-tools-2025/]