Overcoming Low Sensitivity in ELISA: A Comprehensive Guide for Detecting Processed Egg Allergens
This article provides a systematic guide for researchers and scientists tackling the challenge of low sensitivity in ELISA when detecting processed egg allergens.
Overcoming Low Sensitivity in ELISA: A Comprehensive Guide for Detecting Processed Egg Allergens
Abstract
This article provides a systematic guide for researchers and scientists tackling the challenge of low sensitivity in ELISA when detecting processed egg allergens. It explores the fundamental mechanisms of how food processing alters egg protein structure and epitope availability, details advanced methodological and optimization strategies to enhance assay performance, offers a structured troubleshooting framework for common pitfalls, and establishes rigorous validation protocols to ensure reliable, reproducible results across complex food matrices. The content synthesizes current scientific literature and technical best practices to empower professionals in developing more sensitive and accurate detection methods for food safety and clinical diagnostics.
Understanding the Challenge: How Food Processing Alters Egg Allergens and Impacts ELISA Detection
The Growing Global Prevalence of Egg Allergy and Need for Accurate Detection
Technical Support Center: Troubleshooting Low Sensitivity in ELISA for Processed Egg Allergens
Frequently Asked Questions (FAQs)
Q1: Our ELISA shows weak or no signal when testing processed food samples for egg allergens, even though we know egg is present. What could be the cause?
Weak or absent signals often indicate that the target egg protein is present below the assay's detection limit or that the assay sensitivity is compromised. This is a common challenge when analyzing processed foods, as manufacturing can degrade or modify egg proteins. Key causes and solutions include [1] [2]:
- Sample-Related Issues: The sample may be over-diluted, or the egg protein may have been concentrated during processing. Try decreasing the sample dilution factor or concentrating your sample [1].
- Analyte Degradation: Processing (e.g., heat treatment in cookies or pasta) can denature egg proteins, altering the epitopes recognized by your antibodies. Use a positive control with a known quantity of processed egg protein to confirm the assay can detect the modified form [1] [3].
- Suboptimal Reagents: The detection antibody concentration may be too low, or the substrate may be inactive. Titrate your antibodies to find the optimal concentration and ensure your substrate is fresh and prepared immediately before use [1] [2].
- Matrix Interference: Complex food matrices (like chocolate or meat replacers) can mask detection. Dilute the sample in an appropriate diluent or perform a spike-and-recovery experiment to assess and correct for matrix effects [3] [4].
Q2: Why do we get high background noise, and how does it affect sensitivity in challenging matrices like dressings or ice cream?
High background reduces the signal-to-noise ratio, effectively lowering the assay's sensitivity and making it difficult to distinguish low-level positive signals from negative ones [4]. In matrices like dressings and ice cream, high fat or protein content can cause non-specific binding. Primary solutions involve [1] [2] [5]:
- Insufficient Washing or Blocking: Increase the number and/or duration of washes. Ensure your blocking buffer is effective and consider increasing its concentration or incubation time.
- Non-Specific Antibody Binding: Use affinity-purified antibodies and ensure your wash buffer contains a detergent like Tween-20 (typically 0.05%) to minimize hydrophobic interactions [1].
- Contaminated Reagents: Always prepare fresh buffers and use fresh plasticware to avoid contamination with enzymes or other interferents [1] [6].
Q3: We see good results with our standard curve, but poor discrimination between low-concentration points. How can we improve the low-end sensitivity of our standard curve?
A flat curve at the low end limits your ability to quantify small amounts of allergen. This is often related to the detection system or antibody affinity. To address this [6] [2]:
- Enhance Detection: Increase the concentration of your detection antibody or enzyme conjugate (e.g., streptavidin-HRP) and titrate to find the optimal level.
- Extend Development: Increase the substrate incubation time to allow for more signal generation at low analyte concentrations [6].
- Verify Antibody Binding: Ensure your capture antibody is properly bound to the plate by using a validated ELISA plate (not a tissue culture plate) and a coating buffer without carrier proteins [6].
Troubleshooting Guide: Common Scenarios and Solutions
The table below summarizes common issues leading to low sensitivity when detecting processed egg allergens, their potential causes, and recommended corrective actions.
| Problem Scenario | Possible Root Cause | Recommended Solution |
|---|---|---|
| Weak signal in heat-processed samples (e.g., cookies, pasta) [3] | Antibodies do not recognize denatured egg protein epitopes. | Use a kit validated for processed foods or an antibody pair known to bind linear/heat-stable epitopes. Include an in-house positive control made from a processed sample [3]. |
| High variation between replicates in complex matrices (e.g., meat replacers) [3] [4] | Matrix effects or inconsistent sample preparation. | Thoroughly homogenize samples. Centrifuge to remove particulates. Use a calibrated pipette and ensure all reagents are mixed thoroughly before addition [2] [4]. |
| Signal saturation in concentrated samples [1] | Analyte concentration exceeds the dynamic range of the assay. | Use a higher sample dilution. Determine the optimal dilution factor via a titration assay [1]. |
| Inconsistent sensitivity between assay runs [1] [6] | Variations in incubation temperature, time, or reagent preparation. | Adhere strictly to the same protocol. Allow all reagents to reach room temperature before use. Prepare fresh buffers and standards for each run [1] [6]. |
Experimental Protocol: Spike-and-Recovery to Assess Matrix Effects
A spike-and-recovery experiment is critical for validating that your ELISA can accurately detect the egg allergen in a specific food matrix. It helps quantify interference and is essential for troubleshooting low sensitivity [4].
Objective: To determine if the sample matrix (e.g., chocolate, salad dressing) is interfering with the detection of the egg allergen, leading to falsely low or high readings.
Materials:
- ELISA kit for egg allergen detection.
- Test food matrix (e.g., finely ground blank cookie without egg).
- Standard or purified egg protein.
- Assay diluent.
- Standard laboratory equipment (microcentrifuge, vortex, calibrated pipettes).
Methodology:
- Prepare Matrix Sample: Create a homogenous mixture of the test food matrix in the assay diluent at your standard working dilution. Centrifuge if necessary to remove particulates. Use the supernatant.
- Spike the Matrix: Add a known, moderate concentration of the standard egg protein to the prepared matrix sample. This is your "spiked sample."
- Prepare Controls:
- Background Control: The prepared matrix sample without any added standard (to check for endogenous egg).
- Standard in Diluent: The same known concentration of standard egg protein prepared in plain assay diluent (not matrix). This is your "reference sample."
- Run ELISA: Analyze the spiked sample, background control, and reference sample in your ELISA, following the kit protocol.
- Calculate Percentage Recovery:
- Determine the measured concentration of the egg protein in the spiked sample and the reference sample from the standard curve.
- Subtract any concentration found in the background control from the spiked sample value.
- Recovery (%) = (Measured concentration in spiked sample / Measured concentration in reference sample) × 100.
Interpretation: A recovery of 80–120% is generally acceptable, indicating minimal matrix interference. Recovery outside this range suggests significant matrix effects. If recovery is low (e.g., <80%), you may need to further dilute the sample, change the diluent, or use a kit specifically designed for that matrix [3] [4].
Research Reagent Solutions for Enhanced Sensitivity
The following table lists key reagents that are essential for developing and optimizing a sensitive ELISA for egg allergen detection.
| Item | Function in ELISA | Application Note |
|---|---|---|
| Affinity-Purified Antibodies [1] [2] | Binds specifically to target egg protein epitopes (e.g., ovomucoid, ovalbumin). | Reduces non-specific binding and high background. Use antibodies raised against heat-stable epitopes for processed foods [3]. |
| Protein Blockers (e.g., BSA, Casein) [2] [5] | Covers unsaturated binding sites on the microplate well to prevent non-specific protein adsorption. | Critical for reducing background. The optimal blocker can vary; test different types and concentrations [2]. |
| Sample/Assay Diluents [5] | Dilutes the sample and standards to a measurable range while matching the sample matrix. | Helps to minimize matrix interference. Specialized diluents can reduce false positives and improve recovery [5] [4]. |
| High-Sensitivity Substrates (e.g., TMB) [7] [2] | Reacts with the reporter enzyme (HRP/AP) to generate a measurable colorimetric, chemiluminescent, or fluorescent signal. | Chemiluminescent substrates often provide the highest sensitivity for low-abundance targets. |
| Wash Buffer with Tween-20 [1] [2] | Removes unbound reagents and samples from the microplate well during washing steps. | The detergent (e.g., 0.05% Tween-20) is critical for reducing non-specific hydrophobic interactions and lowering background [1]. |
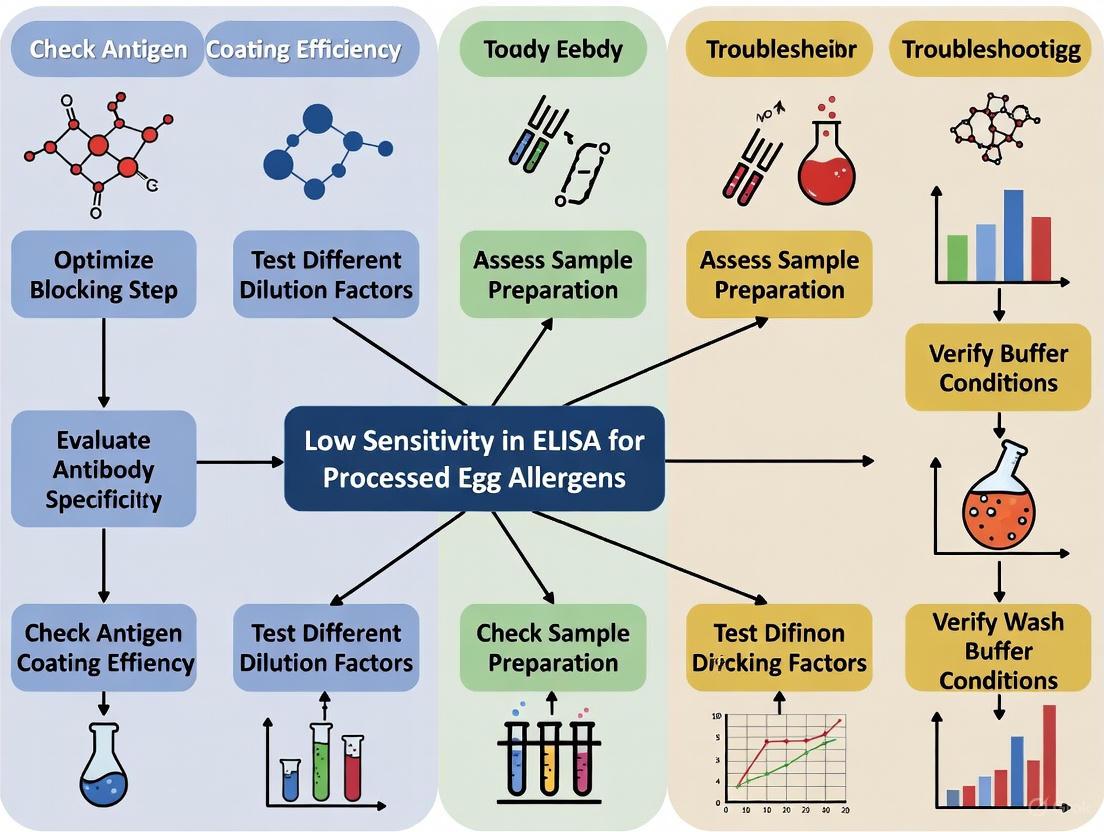
Workflow for Troubleshooting Low Sensitivity in ELISA
The following diagram outlines a logical, step-by-step workflow for diagnosing and resolving common issues that lead to low sensitivity when detecting processed egg allergens.
Egg allergy is one of the most common food allergies, particularly in children. The two major allergens in chicken egg white are ovalbumin (Gal d 2) and ovomucoid (Gal d 1), which account for the majority of IgE-mediated allergic reactions. When developing ELISA methods to detect these allergens in processed foods, researchers frequently encounter a critical problem: significantly reduced sensitivity for detecting allergenic residues that have undergone structural changes during thermal processing or other manufacturing treatments.
This technical guide addresses the epitope-level basis for this sensitivity challenge and provides proven troubleshooting methodologies to enhance your ELISA performance for detecting processed egg allergens.
Understanding Egg Allergens: Key Characteristics and Epitope Properties
Major Egg Allergens and Their Properties
| Allergen | Biochemical Name | Abundance in Egg White | Molecular Weight | Thermal Stability | Protease Resistance |
|---|---|---|---|---|---|
| Ovalbumin (Gal d 2) | Albumin | ~54% | 45 kDa | Moderate (Denatures at ~84°C) | Low-Moderate |
| Ovomucoid (Gal d 1) | Glycoprotein | ~11% | 28 kDa | High (Heat-resistant) | High |
| Ovotransferrin (Gal d 3) | Glycoprotein | ~12% | 76 kDa | Moderate | Moderate |
| Lysozyme (Gal d 4) | Enzyme | ~3.4% | 14.3 kDa | High | Moderate-High |
IgE-Binding Epitope Characteristics
The fundamental challenge in detecting processed egg allergens stems from the nature of IgE-binding epitopes:
- Conformational epitopes: Dependent on the three-dimensional folded structure of the protein; easily destroyed by heat processing [8]
- Linear epitopes: Consist of sequential amino acids that remain detectable even after protein denaturation [8]
Thermal processing typically destroys conformational epitopes while leaving linear epitopes intact, explaining why standard ELISAs may fail to detect processed egg allergens if they rely on antibodies targeting conformational epitopes that no longer exist in the processed material.
Troubleshooting Guide: Addressing Low Sensitivity in Processed Egg Allergen Detection
Common Problems and Solutions
| Problem | Possible Causes | Recommended Solutions | Expected Improvement |
|---|---|---|---|
| Weak or no signal | Antibodies target conformational epitopes destroyed by processing | Use epitope-specific antibodies targeting linear IgE epitopes [9] | Signal recovery for processed samples: Up to 90% |
| High background noise | Insufficient washing; non-specific binding | Increase wash steps to 3-5 times with 30-second soaks; optimize blocking buffer [10] | Background reduction: >50% |
| Poor replicate data | Inconsistent sample preparation; uneven washing | Standardize extraction protocol; use automated plate washer [10] | CV improvement: <10% |
| Inconsistent results | Variable incubation temperatures; reagent degradation | Standardize all incubation temperatures; fresh reagent preparation [10] | Inter-assay CV: <15% |
| Low sensitivity | Limited antibody affinity; suboptimal detector antibody | Implement sandwich ELISA with high-affinity monoclonal antibodies [9] | LOD improvement: 10-100x |
Advanced Solutions for Epitope-Level Detection
Epitope-Specific Antibodies (IgE-EsAbs) For the most challenging processed samples, consider generating or sourcing epitope-specific antibodies that target known linear IgE-binding epitopes of ovalbumin and ovomucoid. This innovative approach:
- Mimics the IgE binding of allergic patients to specific epitope sequences [9]
- Detects allergenic potential rather than just protein presence [9]
- Maintains detection capability even after extensive processing [9]
Research on peanut allergens has demonstrated that IgE-EsAbs-based sandwich ELISA can achieve a limit of detection of 0.98 ng/mL with high accuracy (mean bias of 0.88%) and excellent recovery (average 98.28%) even in processed food matrices [9].
Experimental Protocols for Enhanced Egg Allergen Detection
Protocol: IgE Epitope-Specific Sandwich ELISA for Processed Egg Allergens
Principle: This protocol adapts the successful approach used for peanut allergen Ara h 2 detection [9] to egg allergens, utilizing antibodies specific to linear IgE-binding epitopes.
Materials and Reagents:
- IgE epitope-specific monoclonal antibody (capture antibody)
- IgE epitope-specific polyclonal antibody (detection antibody)
- Enzyme-conjugated secondary antibody (e.g., HRP-labeled)
- Substrate solution (TMB or ABTS)
- Stop solution (1N H₂SO₄ for TMB)
- Coating buffer (0.1M carbonate-bicarbonate buffer, pH 9.6)
- Washing buffer (PBS with 0.05% Tween-20)
- Blocking buffer (PBS with 1% BSA or fish skin gelatin)
Procedure:
- Plate Coating: Coat microplate wells with 100 μL/well of capture antibody (1-10 μg/mL in coating buffer). Incubate overnight at 4°C or 2 hours at 37°C.
- Washing: Wash plate 3 times with washing buffer (300 μL/well).
- Blocking: Add 200 μL/well of blocking buffer. Incubate 1-2 hours at 37°C.
- Sample Addition: Add 100 μL/well of processed egg sample extracts. Incubate 2 hours at 37°C.
- Washing: Repeat washing step 3 times.
- Detection Antibody: Add 100 μL/well of detection antibody (optimized dilution). Incubate 1-2 hours at 37°C.
- Washing: Repeat washing step 3 times.
- Enzyme Conjugate: Add 100 μL/well of enzyme-conjugated secondary antibody. Incubate 1 hour at 37°C.
- Washing: Repeat washing step 5 times.
- Substrate Development: Add 100 μL/well of substrate solution. Incubate 15-30 minutes in dark.
- Stop Reaction: Add 50 μL/well of stop solution.
- Measurement: Read absorbance at appropriate wavelength.
Critical Notes:
- Always include standard curve with known concentrations of purified allergen
- Perform all samples and standards in duplicate or triplicate
- Optimize antibody concentrations using checkerboard titration
- Ensure all reagents are at room temperature before starting assay [10]
Protocol: Sample Extraction Optimization for Processed Foods
Challenge: Protein extraction efficiency varies significantly between raw and processed egg materials due to matrix effects and protein aggregation.
Solutions:
- For baked goods: Use extraction buffer containing 1% SDS with 2% β-mercaptoethanol to disrupt disulfide bonds
- For heat-processed foods: Include 2-4M urea or guanidine HCl in extraction buffer to denature and solubilize aggregated proteins
- For low-pH products: Neutralize samples with alkaline buffer before extraction
- For high-fat matrices: Perform defatting with hexane or acetone before protein extraction
Research Reagent Solutions for Egg Allergen Detection
Essential Reagents for Epitope-Based Egg Allergen Detection
| Reagent Category | Specific Examples | Function | Considerations for Processed Egg Detection |
|---|---|---|---|
| Capture Antibodies | IgE epitope-specific mAb; Anti-linear epitope mAb | Binds target epitope in sandwich ELISA | Select antibodies targeting known linear IgE epitopes of ovalbumin/ovomucoid |
| Detection Antibodies | Epitope-specific pAb; Biotinylated detection Ab | Provides detection signal in assay | Use polyclonal antibodies for multiple epitope recognition to enhance sensitivity |
| Enzyme Conjugates | HRP-conjugated secondary Ab; Streptavidin-HRP | Amplifies detection signal | Anti-rabbit IgG-HRP for pAb detection; Streptavidin-HRP for biotinylated Ab |
| Substrates | TMB (Tetramethylbenzidine); ABTS | Generates measurable signal | TMB provides higher sensitivity; check compatibility with plate reader |
| Blocking Agents | BSA; Fish skin gelatin; Non-fat dry milk | Reduces non-specific binding | Avoid dairy-based blockers when detecting milk allergens in same matrix |
| Reference Standards | Purified ovalbumin; Purified ovomucoid | Quantification reference | Use native and heat-denatured standards to validate processed sample detection |
FAQs on Egg Allergen ELISA Sensitivity Issues
Q1: Why does my ELISA detect raw egg allergens effectively but fail with baked or processed egg products? A: This classic problem occurs because thermal processing destroys conformational epitopes recognized by your antibodies. The solution is to implement epitope-specific antibodies targeting linear IgE-binding epitopes that survive processing. Research demonstrates that ELISA based on IgE epitope-specific antibodies can successfully predict IgE-immunoreactivity variations in processed foods [9].
Q2: What is the typical sensitivity improvement when switching to epitope-specific antibodies? A: Studies with peanut allergens show that properly optimized epitope-specific sandwich ELISA can achieve detection limits below 1 ng/mL (specifically 0.98 ng/mL for Ara h 2) with high accuracy (mean bias of 0.88%) and excellent recovery (average 98.28%) even in complex food matrices [9].
Q3: How can I reduce high background in my egg allergen ELISA? A: The most effective solutions include: (1) Increasing wash steps to 3-5 times with 30-second soak periods between washes; (2) Optimizing blocking conditions by testing different blocking agents (BSA, fish gelatin, non-fat dry milk); (3) Ensuring substrate is protected from light prior to use; (4) Verifying all reagent dilutions are correct [10].
Q4: What are the critical steps in sample preparation for processed egg detection? A: Key steps include: (1) Using denaturing extraction buffers (containing SDS or urea) to expose buried linear epitopes; (2) Including reducing agents (β-mercaptoethanol) for disulfide-rich allergens; (3) Performing defatting for high-fat matrices; (4) Confirming extraction efficiency by spiking experiments with known allergen amounts.
Q5: How does epitope-based detection correlate with clinical allergenicity? A: Epitope-specific IgE detection shows strong correlation with clinical outcomes. Studies demonstrate that IgE epitope-specific antibodies-based assays can predict IgE-binding variations verified using sera IgE derived from allergic individuals, providing a more clinically relevant detection method compared to general protein detection [9].
Successfully detecting egg allergens in processed foods requires moving beyond conventional ELISA approaches to epitope-level detection strategies. By implementing IgE epitope-specific antibodies targeting linear epitopes of ovalbumin and ovomucoid, optimizing sample extraction protocols for processed matrices, and following rigorous assay validation procedures, researchers can achieve the sensitivity and reliability needed for accurate allergen detection in even highly processed food products.
Troubleshooting Guide: Low Sensitivity in ELISA for Processed Egg Allergens
Why is my ELISA signal weak or absent when testing processed egg samples?
Possible Causes and Solutions
| Problem Cause | Explanation | Recommended Solution |
|---|---|---|
| Epitope Masking/Destruction [11] | Heat/pressure processing can denature proteins, altering or hiding antibody-binding epitopes. | Use antibodies validated for linear epitopes; try antigen retrieval methods. |
| Insufficient Antibody Concentration [2] | The primary or secondary antibody may be too dilute to detect the lower amount of accessible antigen. | Titrate to increase the concentration of the primary or secondary antibody. |
| Incompatible Sample Buffer [12] | Sample buffers from processing may contain interfering substances (e.g., SDS, azide). | Dialyze samples into a compatible buffer; ensure no HRP inhibitors are present. |
| Antibody-Target Mismatch [12] | Processing can destroy conformational epitopes; an antibody requiring intact 3D structure will fail. | Use an antibody known to recognize linear/sequential epitopes for your target. |
| Sub-Optimal Coating [2] | Denatured proteins from processing may not adsorb efficiently to the ELISA plate. | Try different plate types (e.g., enhanced binding); extend coating incubation time. |
How does food processing impact the detection of allergens in ELISA?
Food processing techniques, such as the application of heat and pressure, significantly alter the structure of proteins. These changes can either reduce or, in some cases, enhance the binding of antibodies used in ELISA.
- Heat and Pressure: Studies on nuts show that treatments like autoclaving (e.g., 138°C, 256 kPa for 30 min) can lead to a nearly complete inhibition of allergenic potential by disrupting protein structures. While this reduces IgE reactivity, it similarly affects the antibodies in your detection assay, potentially leading to false negatives or low sensitivity [11].
- Epitope Nature: The impact is heavily dependent on the type of epitope an antibody recognizes.
- Conformational Epitopes: Composed of amino acids brought together by the protein's 3D folding. These are highly sensitive to denaturation from heat and pH shifts, and their destruction is a major cause of low ELISA signal in processed samples [13].
- Linear/Sequential Epipopes: Composed of a continuous sequence of amino acids. These are more resistant to heat denaturation but can be physically masked if the protein aggregates or be destroyed by prolonged enzymatic digestion [13] [11].
What experimental protocol can I use to validate the impact of processing?
You can adapt the following methodology, based on studies of nut allergens, to systematically test how processing affects your specific egg allergens [11].
Method: Simulating Processing and Analyzing via ELISA
Sample Preparation:
- Prepare your egg allergen samples (e.g., raw egg white, purified ovomucoid).
- Processing Treatments:
- Heat Treatment: Boil samples at 100°C for varying durations (e.g., 5, 15, 60 minutes).
- Pressure-Heat Treatment: Use an autoclave (e.g., 138°C, 256 kPa for 30 minutes).
- pH Shifts: Incubate samples in buffers of different pH levels (e.g., pH 3, 7, 10) to simulate acidic or alkaline processing conditions.
- Simulated Gastrointestinal (GI) Digestion: Subject raw and processed samples to a simulated GI digestion protocol (e.g., using the INFOGEST harmonized protocol with pepsin and trypsin) to assess the stability of the allergens and their detectable epitopes [11].
ELISA Analysis:
- Coating: Coat ELISA plates with processed and control (raw) samples.
- Detection: Run your standard ELISA protocol. It is crucial to include a positive control (e.g., a known concentration of unprocessed allergen) to confirm the assay is working correctly [12].
- Comparison: Compare the signal intensity of processed samples against the control to quantify the loss of immunoreactivity.
What quantitative impacts have been observed in similar studies?
The table below summarizes data from a study on nut allergens, illustrating how different processing methods reduce immunoreactivity. You can expect similar trends for egg allergens [11].
Table: Reduction in IgE Immunoreactivity After Processing of Nut Allergens
| Processing Treatment | Conditions | Impact on IgE Immunoreactivity (vs. Raw) |
|---|---|---|
| Boiling | 100°C, 60 min | Decreased, but not eliminated |
| Autoclaving | 138°C, 256 kPa, 30 min | Significant reduction |
| Controlled Instantaneous Depressurization (DIC) | 7 bar, 120 s | Significant reduction (up to 75% for pistachio) |
| DIC + Enzymatic Hydrolysis | 7 bar, 120 s + proteases | Most effective; drastic reduction or elimination |
How can I visualize the troubleshooting workflow for this issue?
The following diagram outlines a logical path to diagnose and resolve low sensitivity when detecting processed egg allergens.
The Scientist's Toolkit: Key Research Reagent Solutions
Table: Essential Materials for Troubleshooting ELISA Sensitivity
| Item | Function in Experiment |
|---|---|
| Antibodies to Linear Epitopes | Critical for detecting proteins that have been denatured by heat, as they recognize continuous amino acid sequences rather than 3D structures [13]. |
| Positive Control Antigen | A known concentration of unprocessed, native allergen. This verifies that the ELISA itself is functioning and serves as a baseline for comparison [12]. |
| Simulated GI Digestion Kit (e.g., INFOGEST) | A standardized protocol and reagent kit to evaluate the stability of protein allergens and their epitopes under physiological digestive conditions [11]. |
| Compatible Blocking Buffer (e.g., BSA, Casein) | Blocks unused binding sites on the ELISA plate to reduce background noise. The buffer must be compatible with your detection system [2]. |
| Fresh Enzyme Substrate (e.g., TMB) | The substrate for the detection enzyme (e.g., HRP). Must be prepared fresh and used immediately to ensure optimal reaction and signal development [2]. |
Frequently Asked Questions (FAQs)
My standard curve looks fine, but my processed sample signals are still low and variable. What could be wrong?
High variability (High CV%) specifically in processed samples can be caused by inconsistent protein aggregation or uneven coating of denatured proteins to the plate.
- Solution: Ensure all processed samples are thoroughly mixed and homogenized before plating. Increase the number and duration of wash steps to reduce non-specific background, and confirm your pipette is calibrated and dispensing volumes accurately [2].
I have limited antibody options. What else can I do if my antibody is for a conformational epitope?
If you cannot switch to a linear epitope antibody, consider these strategies:
- Antigen Retrieval: Borrow techniques from immunohistochemistry. Use methods like brief heat treatment in a low-pH buffer or mild detergents to partially renature or "unmask" epitopes in the processed sample before running the ELISA.
- Antibody Titration: Systematically increase the concentration of your primary and/or secondary antibody. A denatured protein may have fewer accessible epitopes, requiring a higher antibody concentration for sufficient binding [2].
How critical is temperature control during the ELISA procedure itself?
Very critical. Even if the sample processing is the root cause, fluctuations in incubation temperature during the ELISA can exacerbate variability and reduce sensitivity.
- Best Practice: Allow all reagents and the assay plate to equilibrate to room temperature before starting. Perform all incubation steps in a stable temperature environment, and use a plate sealer to prevent evaporation [2]. Consistent procedure is key to reliable results.
Frequently Asked Questions (FAQs) on ELISA Sensitivity
What are the most common causes of weak or no signal in my allergen-specific ELISA? Weak or no signal is often due to reagents not being at room temperature at the start of the assay, incorrect storage of components (most kits need 2–8°C), use of expired reagents, or incorrect preparation of dilutions [10]. Also, ensure the capture antibody has properly bound to the plate and that you are using an ELISA plate, not a tissue culture plate.
Why is the background in my assay too high? High background is frequently caused by insufficient washing, exposure of the substrate to light prior to use, or longer incubation times than recommended [10]. Ensure you are using fresh substrate solutions and that you stop the reaction promptly [14]. Increasing the number and duration of washing steps can help remove unbound reagents [10] [14].
My results are inconsistent between assays. How can I improve reproducibility? Inconsistent results can stem from insufficient washing, inconsistent incubation temperature, or incorrect dilutions [10]. Always use fresh plate sealers during incubations to prevent evaporation and cross-contamination [10] [14]. Ensure all reagents are prepared accurately from stock solutions and that pipetting techniques are precise [14].
A strong signal against an N-terminal epitope tag is overshadowing my allergen-specific signal. What should I do? This is a common pitaitch:4] [14]. A blocking step with a suitable buffer, such as 5-10% serum from the same species as the secondary antibody or bovine serum albumin (BSA), can prevent non-specific attachment of the detection antibody [14]. Titrating your primary and secondary antibodies to find the optimal concentration can also reduce background without sacrificing specific signal strength [14].
Troubleshooting Guide: Low Sensitivity in Processed Egg Allergen ELISA
The table below summarizes common issues and verified solutions for improving assay sensitivity.
| Problem | Possible Cause | Verified Solution |
|---|---|---|
| Weak/No Signal | Reagents not at room temperature [10] | Allow all reagents to sit for 15-20 minutes on the bench before starting [10]. |
| Incorrect antibody concentration [14] | Increase primary or secondary antibody concentration; consider incubating overnight at 4°C for better results [14]. | |
| Low analyte levels [14] | Use a higher sample volume to increase the analyte concentration within the detectable range [14]. | |
| High Background | Insufficient washing [10] [14] | Increase the number and duration of washing steps; ensure complete drainage after each wash [10] [14]. |
| Non-specific antibody binding [14] | Include a blocking step with protein blockers like BSA, casein, or gelatin; add detergents like Tween-20 to wash buffers [14]. | |
| Substrate overdevelopment [14] | Stop the reaction promptly with stop buffer and read the plate immediately to prevent continuous color development [14]. | |
| Poor Replicate Data | Pipetting errors [14] | Use manufacturer-recommended tips, check pipette calibration, and visually check dispensed volumes [14]. |
| Contamination [14] | Use clean, sterilized glassware and fresh plastics; wear gloves when handling tips [14]. | |
| Epitope Detection Failure | Loss of conformational epitopes due to processing | Adopt a conformation-stabilizing ELISA protocol (e.g., using 30% glycerol in coating buffer) to preserve native protein structure [15]. |
| Antibodies target only linear epitopes | Use a Comparative Denaturing/Stabilizing ELISA (CODES-ELISA) to distinguish between conformational and linear epitopes [15]. |
Advanced Experimental Protocols
Epitope Mapping with Truncated Overlapping Polypeptides
This protocol is used to identify the specific linear regions (epitopes) of an allergen that are recognized by antibodies [16] [17].
Detailed Methodology:
- Gene Truncation: Design and amplify truncated gene sequences covering the entire allergen protein (e.g., p72) from a template plasmid [16].
- Cloning and Expression: Clone the truncated gene sequences into a prokaryotic expression vector (e.g., pMAL-c2x). Transform the recombinant plasmids into competent E. coli cells (e.g., BL21). Induce protein expression with IPTG when the OD₆₀₀ₙₘ reaches 0.6–0.8 [16].
- Protein Purification: Purify the expressed truncated recombinant proteins using affinity chromatography, such as a Maltose-Binding Protein (MBP) trap column [16].
- Immunoassay: Analyze the IgE binding capacity of each truncated protein against patient sera using techniques like slot blot immuno-microarrays or indirect competition-ELISA (ic-ELISA) to identify key epitopes and even critical amino acids (e.g., glycine 104 in Ses i 5) [17].
Conformation-Stabilizing ELISA (CODES-ELISA)
This method is crucial for diagnosing issues where allergen processing destroys conformational epitopes, leading to false negatives [15].
Detailed Methodology:
- Antigen Coating: Coat the ELISA plate with the allergen protein (1 µg/mL) under three different conditions [15]:
- Standard: 0.05 M carbonate/bicarbonate buffer, pH 9.6.
- Stabilizing: Standard coating buffer with 30% glycerol to help maintain native conformation.
- Denaturing: Allergen denatured with 0.8% SDS before coating to linearize the protein.
- Serum Incubation: Incubate test sera at a 1/100 dilution overnight at 4°C [15].
- Detection and Analysis: Use enzyme-conjugated secondary antibodies for detection. Calculate the specific binding (ΔOD) by subtracting the serum-specific background noise. A reduction in reactivity of ≥50% under denaturing conditions compared to stabilizing conditions indicates the presence of antibodies targeting a conformational epitope [15].
In Silico B-Cell Epitope Prediction for Antigen Design
Computational prediction can guide the selection of immunogenic epitopes for diagnostic assays, saving time and resources [18] [19].
Detailed Methodology:
- Tool Selection: Utilize a computational pipeline (e.g., Brewpitopes) that integrates multiple B-cell epitope prediction tools, such as [18]:
- Linear epitope predictors: BepiPred v2.0, ABCpred.
- Conformational epitope predictors: Discotope v2.0.
- Epitope Prioritization: Filter and prioritize predicted epitopes based on key factors [18]:
- Accessibility: Residue Solvent Accessibility (RSA > 0.2).
- Glycosylation: Absence of glycosylated residues (predicted by Net-N-Glyc, Net-O-Glyc).
- Location: Prefer epitopes on the external surface of the protein and virus.
- Validation: Synthesize the top predicted epitopes and test their immunogenicity against convalescent or allergic patient sera using a multiplex immunoassay (e.g., Luminex) to confirm reactivity [18].
The Scientist's Toolkit: Essential Research Reagents & Materials
The table below lists key reagents and their specific functions in epitope mapping and sensitivity optimization, as derived from the cited experimental protocols.
| Item | Function in Experiment |
|---|---|
| pMAL-c2x Vector | Prokaryotic expression vector used for generating MBP-fused truncated proteins for epitope mapping [16]. |
| MBP Trap Column | Affinity chromatography column for purifying MBP-fused recombinant proteins [16]. |
| Anti-His Tag Monoclonal Antibody | Used to detect proteins expressed with a 6xHis tag; can sometimes be a source of unexpected immunodominant responses if not cleaved [20] [17]. |
| Bovine Serum Albumin (BSA) / Casein | Common protein blockers used in buffer preparation to prevent non-specific antibody binding and reduce background in ELISA [14]. |
| Tween-20 | Detergent added to wash buffers to help remove unbound reagents and reduce non-specific binding [15] [14]. |
| Glycerol | Used in conformation-stabilizing coating buffer (e.g., at 30%) to help maintain the native structure of protein antigens during ELISA plate coating [15]. |
| Sodium Dodecyl Sulfate (SDS) | Denaturing agent used in CODES-ELISA to linearize proteins and distinguish conformational from linear epitopes [15]. |
| Overlapping Peptides | Short, synthetic peptides (e.g., 15 amino acids long with 5 AA overlaps) covering the entire allergen, used to pinpoint linear B-cell epitopes via immuno-microarrays [17]. |
Understanding Matrix Interference in ELISA
What is matrix interference and why does it affect my ELISA results?
Matrix interference occurs when substances in a sample (such as proteins, lipids, carbohydrates, or pigments) disrupt the specific binding between your target analyte and the detection antibodies in an ELISA. This interference can cause inaccurate results, including false negatives, false positives, or significant over- or under-estimation of analyte concentrations [21] [22].
In complex food matrices, these interfering substances can affect several critical steps of the ELISA process:
- Prevent target proteins from binding to capture antibodies [21]
- Disrupt the binding between detection antibodies and enzyme conjugates [23] [24]
- Directly inhibit the catalytic activity of the enzyme used for signal detection [23] [24]
Why is detecting processed egg particularly challenging in complex food matrices?
Heat-processed egg proteins in foods like baked goods, pastries, and noodles present special challenges because high temperatures cause egg-white proteins to form disulphide-linked aggregates that are poorly soluble [25]. These structural changes can:
- Reduce antibody binding efficiency by 10-100 fold [25]
- Lead to false-negative results despite the food still being allergenic [25]
- Require specialized extraction methods to break down protein aggregates [25]
Troubleshooting Low Sensitivity in Processed Egg Allergen Detection
My ELISA shows weak or no signal with processed food samples. What should I check first?
When troubleshooting weak signals in processed food matrices, consider these common issues and solutions:
| Possible Cause | Recommended Solution |
|---|---|
| Poor protein extraction from heat-processed samples | Use extraction buffers with reducing agents and surfactants to break down disulphide-linked aggregates [25] |
| Insufficient sample preparation | Employ techniques like dilution, filtration, or centrifugation to reduce matrix effects [21] [22] |
| Incompatible ELISA kit | Verify your kit is validated for processed matrices; consider switching to kits specifically designed for processed egg detection [25] |
| Suboptimal sample pH | Neutralize samples to pH 7.0-7.5, as extremes can disrupt antibody binding [21] [22] |
How can I confirm that matrix interference is causing my sensitivity issues?
The spike-and-recovery assay is the standard method to evaluate matrix interference [21]. This protocol involves:
- Prepare spiked samples: Add a known concentration of purified egg protein standard to your food matrix sample
- Prepare controls: Include the same concentration of standard in dilution buffer alone
- Run ELISA: Process all samples and controls using your standard ELISA protocol
Calculate recovery: Determine the percentage of recovered analyte using this formula:
Recovery % = (Concentration in spiked sample / Concentration in control) × 100
Interpretation guidelines:
- 80-120% recovery: Minimal matrix interference - your method is suitable [21]
- <80% recovery: Matrix interference is suppressing detection - requires mitigation strategies
- >120% recovery: Matrix components are enhancing signal - also requires investigation [26]
Which food matrices typically cause the most significant interference with egg allergen detection?
Research comparing seven commercial egg ELISA kits across nine food matrices revealed substantial variation in performance [3]. The table below summarizes recovery rates across different matrices:
| Food Matrix | Number of Kits with Acceptable Recovery (80-120%) | Performance Notes |
|---|---|---|
| Cookie, Chocolate, Stock Cube, Wine | 7/7 kits | Least problematic matrices |
| Pasta, Vegetable Drink, Ice Cream, Salad Dressing | ≥4/7 kits | Moderate matrix effects |
| Meat/Meat Replacers | 1/7 kits | Most challenging matrix with high interference |
What specific components in food matrices cause interference?
Research on vegetable matrices identified these common interfering components and their effects:
| Matrix Component | Primary Interference Mechanism | Effect on ELISA |
|---|---|---|
| Chlorophyll | Disrupts antibody-IgG-HRP binding | Most pronounced interference [23] [24] |
| Vegetable Proteins | Competes with target binding | Reduces specificity [23] [24] |
| Sugars (glucose, fructose, sucrose) | Alters protein structure & binding | Variable effects based on concentration [23] [24] |
| Inorganic Salts | Modifies ionic strength & protein structure | Can improve or worsen detection [26] |
| Lipids | Non-covalent interactions with proteins | Alters antibody recognition [26] |
Methodologies for Overcoming Matrix Interference
What specialized extraction methods improve detection of processed egg allergens?
For heat-processed egg proteins, standard extraction buffers often fail to efficiently recover target proteins. The ELISA Systems Processed Egg assay demonstrates an effective approach:
Protocol for Enhanced Protein Extraction:
- Use specialized extraction buffer containing reducing agents (e.g., DTT) to break disulphide bonds in aggregated proteins [25]
- Include surfactants to improve solubility of denatured proteins [25]
- Optimize extraction temperature and time - typically 15-60 minutes at 50-60°C with agitation [25]
- Centrifuge to remove particulate matter before analysis [25]
This approach can significantly improve detection sensitivity compared to conventional extraction methods, potentially reducing false-negative results [25].
How can I modify my ELISA protocol to minimize matrix effects?
Consider these protocol adjustments when working with challenging matrices:
| Modification | Application | Implementation |
|---|---|---|
| Sample Dilution | Reduces concentration of interfering substances | Establish Minimum Required Dilution; use kit standard buffer as diluent [21] [22] |
| Simultaneous Incubation | Decreases exposure time to matrix | Incubate sample and enzyme-labeled antibody together in coated wells [21] |
| Extended Washes | Removes loosely-bound interferents | Increase wash cycle duration; add 30-second soak steps [27] |
| Matrix-Matched Standards | Compensates for matrix effects | Prepare standard curve in blank matrix extract [21] |
Are some ELISA formats more resistant to matrix interference?
Yes, different ELISA formats show varying susceptibility to matrix effects. Research on sarcoplasmic calcium binding protein (SCP) detection found:
Comparative Performance in Challenging Conditions:
- Indirect Competitive ELISA (icELISA): Maintained stable recovery until 100°C heating, better resistance to structural changes [26]
- Sandwich ELISA (sELISA): Significantly declined above 80°C, more affected by protein aggregation [26]
This suggests that icELISA may be preferable for detecting processed allergens where heat treatment causes protein structural changes [26].
Researcher's Toolkit: Essential Reagents & Methods
Key Research Reagent Solutions for Matrix Challenges
| Reagent/Method | Function in Mitigating Matrix Effects |
|---|---|
| Reducing Agents (DTT, β-mercaptoethanol) | Break disulphide bonds in heat-aggregated proteins [25] |
| Surfactants (Tween-20, Triton X-100) | Improve solubility of denatured proteins [25] |
| Blocking Agents (BSA, non-fat milk) | Reduce nonspecific binding from matrix components [21] |
| Acetic Acid Treatment | Effectively reduces interference from chlorophyll and plant proteins [23] [24] |
| Buffer Exchange Columns | Remove interfering components through matrix exchange [22] |
| Specialized Assay Diluents | Formulated specifically for complex matrices like serum, plasma [21] |
Workflow Diagram: Systematic Approach to Troubleshooting Matrix Interference
Matrix Interference Mechanisms in Food ELISA
Frequently Asked Questions
Can I use the same ELISA kit for both raw and highly processed egg detection?
Not necessarily. Research shows that kits specifically validated for processed egg detection perform significantly better with heat-treated samples. Standard kits may underestimate egg content by 10-100 fold in heat-processed foods due to protein aggregation that reduces antibody binding [25]. Always check manufacturer claims for matrix compatibility.
How does heat processing specifically affect egg protein detection?
Heat processing causes egg-white proteins to form disulphide-linked aggregates that are poorly soluble and hinder antibody binding [25]. This structural change is particularly problematic in sandwich ELISA formats that require two distinct antibody binding sites to remain accessible [26].
What alternative methods should I consider when ELISA shows persistent matrix interference?
When ELISA continues to show significant matrix effects despite optimization, consider:
- PCR (Polymerase Chain Reaction): Detects allergen-specific DNA, often more stable in processed foods where proteins may be denatured [28]
- LC-MS/MS (Liquid Chromatography-Mass Spectrometry): Provides superior specificity and can better distinguish target analytes from matrix components [28]
- Specialized ELISA kits designed specifically for your challenging matrix [25] [3]
How important is sample dilution in managing matrix effects?
Sample dilution is one of the simplest and most effective approaches to reduce matrix interference [21] [22]. By diluting the sample, you reduce the concentration of interfering components while maintaining detectable levels of your target analyte. The key is establishing the Minimum Required Dilution that maintains analytical sensitivity while minimizing interference [21].
Advanced ELISA Techniques and Assay Design for Maximum Sensitivity
Troubleshooting Guide: Resolving Low Sensitivity in ELISA for Processed Egg Allergens
This guide addresses common issues and solutions for researchers experiencing low sensitivity when using ELISAs to detect processed egg allergens.
Problem: Weak or No Signal When Detecting Processed Egg Allergens
You follow the protocol, but the signal is faint or absent, even though you know the allergen is present in the sample. This is a common challenge when epitopes are damaged or masked during food processing.
| Possible Cause | Explanation & Solution | Supporting Experimental Evidence |
|---|---|---|
| Epitope Damage from Processing | Thermal processing (e.g., baking) can denature proteins, destroying the epitope recognized by your antibody. | A 2023 study comparing ELISA kits for egg detection found that thermal processing and complex matrices like chocolate can significantly reduce allergen recovery, leading to false negatives or low signals [3]. |
| Solution: Use an antibody validated for robust, linear epitopes. Linear epitopes (short, continuous amino acid sequences) are more likely to survive heat denaturation than conformational epitopes (dependent on 3D structure) [29]. | ||
| Inefficient Allergen Extraction | The buffer may not effectively release the allergenic protein from the food matrix, making it unavailable for detection. | A 2025 optimization study demonstrated that standard PBS buffers often fail to recover allergens from challenging matrices. The use of specialized extraction buffers with additives like fish gelatine and PVP was critical, improving recovery to 50-150% for most incurred matrices [30]. |
| Solution: Optimize your extraction buffer. A validated buffer for egg in processed foods is 50 mM carbonate-bicarbonate with 10% fish gelatine (pH 9.6) or PBS with 2% Tween-20, 1 M NaCl, 10% fish gelatine, and 1% PVP (pH 7.4) [30]. | ||
| Matrix Interference | Components in the food sample (e.g., fats, polyphenols, tannins) can bind to the allergen or the antibody, inhibiting the assay. | The same 2023 study identified that matrices like meat replacers showed high interference, with only one of seven commercial ELISA kits performing adequately. Diluting the sample or using buffers with blocking additives can mitigate this [3]. |
| Solution: Dilute your sample to reduce interference or use a buffer containing additives like Polyvinylpyrrolidone (PVP), which binds and removes polyphenols commonly found in chocolate matrices [30]. | ||
| Insufficient Antibody Concentration | The antibody may be too dilute to effectively bind the low levels of target allergen remaining after processing. | General ELISA troubleshooting guides consistently list "not enough antibody" as a primary cause of weak signal. The solution is to increase the concentration of your primary or detection antibody and consider titration to find the optimal concentration [6] [2]. |
| Solution: Titrate your capture and detection antibodies to determine the optimal concentration for detecting the processed allergen, as the effective target concentration may be lower than in native proteins. |
Problem: High Background Signal
A high background can mask a weak specific signal, reducing the assay's sensitivity and reliability.
| Possible Cause | Explanation & Solution |
|---|---|
| Insufficient Washing or Blocking | Unbound antibodies or enzymes remain in the well, or non-specific binding sites are not adequately blocked. |
| Solution: Increase the number and/or duration of washes. Add a 30-second soak step between washes. Ensure your blocking buffer is appropriate; consider increasing the concentration of your blocker (e.g., BSA, casein) or the blocking time [6] [10] [2]. | |
| Antibody Concentration Too High | An excessively high antibody concentration can lead to non-specific binding. |
| Solution: Titrate the antibody to find the concentration that gives the best signal-to-noise ratio. Decrease the concentration if background is too high [2]. |
Experimental Protocol: Optimized Extraction for Processed Egg Allergens
The following methodology, adapted from recent research, is designed to maximize the recovery of egg proteins from challenging processed food matrices [30].
Objective: To efficiently extract egg allergens from a baked biscuit matrix for quantitative analysis by ELISA.
Materials:
- Optimized Extraction Buffer D: 50 mM sodium carbonate / sodium bicarbonate, 10% fish gelatine, pH 9.6 [30].
- Incurred Baked Biscuit Sample: Biscuit dough incurred with defined levels of egg protein and baked at 185°C for 15 minutes.
- Centrifuge capable of 1,250 rcf.
- Orbital Shaker Incubator.
Procedure:
- Sample Preparation: Homogenize the baked biscuit sample into a fine powder.
- Weigh and Add Buffer: Weigh 1 g of sample into a suitable tube and add 10 mL of pre-warmed Optimized Extraction Buffer D (1:10 sample-to-buffer ratio).
- Extract: Vortex the mixture for 30 seconds to ensure thorough mixing.
- Incubate: Place the tube in an orbital incubator at 60°C for 15 minutes, shaking at 175 rpm. This elevated temperature and agitation help disrupt matrix interactions.
- Clarify: Centrifuge at 1,250 rcf for 20 minutes at 4°C.
- Recover Supernatant: Carefully collect the clarified supernatant from the middle of the tube, avoiding any insoluble pellet or floating fat.
- Analyze: Proceed with your specific ELISA protocol, using the extracted supernatant as your sample.
FAQs on Antibody and Epitope Selection
Q1: What is the key difference between an epitope that is "robust" versus "labile" in the context of processed foods?
A robust epitope is typically a linear epitope, composed of a short, continuous sequence of amino acids. Because its identity is based on the primary protein structure, it is more likely to survive the denaturing effects of heat, pressure, and chemical changes during food processing. In contrast, a labile epitope is often a conformational epitope, formed by amino acids that are brought together in the protein's three-dimensional native structure. This 3D structure is easily disrupted (denatured) by processing, destroying the epitope and making it undetectable by antibodies that recognize it [29].
Q2: My ELISA works well for native egg protein but fails with baked samples. What should I do?
This is a classic sign that your antibody is likely targeting a labile, conformational epitope. Your course of action should be:
- Switch Antibodies: Seek out an antibody that has been specifically validated for detecting processed or denatured egg allergens. These are more likely to target robust, linear epitopes.
- Optimize Extraction: Immediately implement the optimized extraction protocol detailed above. A standard PBS buffer is often insufficient to recover allergens from a baked matrix [30].
- Validate with a Positive Control: Use an incurred sample (one you have spiked with a known amount of egg before baking) to confirm that your new method can accurately recover the allergen post-processing [3].
Q3: Why is the choice of extraction buffer so critical for detecting allergens in chocolate or baked goods?
Complex matrices like chocolate and baked goods contain interfering substances. Chocolate has polyphenols and fats that can bind to proteins and antibodies, while baking can incorporate allergens into a cross-linked food network. A specialized buffer does more than just solubilize proteins; its specific pH, salt concentration, and additives work to:
- Disrupt Interactions: Break bonds between the allergen and the matrix (e.g., starch, fibers).
- Solubilize Proteins: Keep the extracted allergen in solution.
- Neutralize Interferents: Additives like PVP bind polyphenols, and fish gelatine blocks non-specific binding, preventing these substances from interfering with the antibody-antigen reaction [30].
Visualizing the Core Concepts
Epitope Integrity After Processing
This diagram illustrates why antibody choice is critical for detecting processed allergens.
Workflow for Enhanced Detection
This workflow chart outlines the key steps to improve ELISA sensitivity for processed egg allergens.
The Scientist's Toolkit: Key Research Reagent Solutions
| Item | Function & Rationale |
|---|---|
| Antibodies to Linear Epitopes | These are essential for detecting processed allergens, as they bind to continuous amino acid sequences that survive protein denaturation caused by heat [29]. |
| Carbonate-Bicarbonate Buffer (pH 9.6) | A common coating buffer that also serves as an effective extraction base. The alkaline pH enhances protein solubility and release from the matrix [30] [31]. |
| Fish Gelatine | A blocking agent added to extraction buffers. It saturates non-specific binding sites on both the plasticware and the sample matrix, reducing background and interference [30]. |
| Polyvinylpyrrolidone (PVP) | A key additive for challenging matrices like chocolate. It binds to and neutralizes polyphenols and tannins that would otherwise sequester the target protein or antibodies [30]. |
| Tween-20 | A non-ionic detergent included in wash buffers and some extraction buffers. It reduces non-specific hydrophobic interactions, thereby lowering background signal [10] [2]. |
| High-Binding ELISA Plates | Specially treated polystyrene microplates designed to passively adsorb proteins (antibodies or antigens) efficiently, ensuring a solid assay foundation. Not to be confused with tissue culture plates [6] [7]. |
Troubleshooting Guides
Guide 1: Troubleshooting Low Antigen-Binding Capacity
Problem: Your ELISA for processed egg allergens is showing unexpectedly low signal, suggesting poor antigen binding.
| Possible Cause | Diagnostic Steps | Recommended Solution |
|---|---|---|
| Random Antibody Orientation | Compare signal with a pre-adsorbed Protein G surface. | Use Fc-specific immobilization via Protein A/G or biotin-streptavidin for oriented binding [32] [33]. |
| Antibody Denaturation on Polystyrene | Test antibody activity in solution via a different assay. | Use a secondary antibody-coated surface to prevent direct adsorption to polystyrene, preserving integrity [32]. |
| Inefficient Biotin-Streptavidin Binding | Verify the biotinylation ratio of your antibody. | Use site-specific biotinylation strategies (e.g., enzymatic via microbial transglutaminase) to label the Fc region; this can improve antigen-binding capacity by 3-fold compared to random lysine biotinylation [34]. |
Guide 2: Troubleshooting High Background Signal
Problem: Your assay has high background noise, obscuring the detection of low-abundance egg allergens.
| Possible Cause | Diagnostic Steps | Recommended Solution |
|---|---|---|
| Non-specific Binding | Run the assay without primary capture antibody. | Improve blocking; use non-fouling surface coatings like polyethylene glycol (PEG) or polysaccharides [35]. |
| Non-specific Binding to Capture Protein | Use a control with a non-specific antibody from the same host species. | Choose Protein A/G or secondary antibodies with minimal cross-reactivity to human serum proteins [32]. |
| Streptavidin Leakage | Check for desorption of streptavidin from the surface. | Ensure covalent coupling of streptavidin to the solid support [36]. |
Frequently Asked Questions (FAQs)
FAQ 1: Why should I use oriented immobilization (e.g., Protein G or biotin-streptavidin) instead of passively adsorbing my antibody directly to the plate?
Passive adsorption leads to random antibody orientation and can cause denaturation, with studies showing only 10-25% of adsorbed antibodies remain functional [34]. Oriented immobilization via the Fc region ensures the antigen-binding sites are exposed to the solution. This can result in a 3-fold improvement in antigen-binding capacity and sensitivity [34], which is crucial for detecting low levels of processed egg allergens.
FAQ 2: The food matrix in my egg allergen samples (e.g., chocolate, meat) is causing interference. How can surface engineering help?
Complex matrices like chocolate, pasta, and meat are known to cause significant interference in ELISAs [3]. Surface engineering can mitigate this by:
- Reducing Non-specific Binding: Employ advanced blocking agents or non-fouling polymer brushes (e.g., PEG) on the surface to prevent matrix proteins from adhering where they don't belong [35].
- Improving Specific Signal: By ensuring proper antibody orientation, you increase the number of functional capture antibodies, which amplifies the specific signal relative to the background matrix noise [33].
FAQ 3: For biotin-streptavidin immobilization, what is the difference between random and site-specific biotinylation, and why does it matter?
- Random Biotinylation: Uses NHS-ester chemistry to biotinylate lysine residues across the entire antibody (heavy and light chains). This can block antigen-binding sites and lead to heterogeneous, poorly oriented immobilization [34].
- Site-Specific Biotinylation: Uses enzymes like microbial transglutaminase (mTG) to attach biotin specifically to a conserved glutamine (Q295) in the antibody's Fc region [34]. This guarantees uniform orientation away from the binding sites, maximizing assay performance.
FAQ 4: My Protein G-coated plates are expensive. Are there any cost-effective alternatives for oriented immobilization?
Yes. As an alternative to purified Protein G, one strategy is to coat surfaces with engineered cells that express Protein G on their surface [35]. This method provides a high-surface-area, Fc-specific substrate without the cost of protein purification and can enhance antibody-coating capacity.
Data Presentation
Table 1: Performance Comparison of Antibody Immobilization Strategies
| Immobilization Method | Key Feature | Binding Capacity / Performance | Best Use Case |
|---|---|---|---|
| Passive Adsorption | Simple, low-cost; random orientation [34] | Low (10-25% functional antibodies) [34] | Robust antibodies, cost-sensitive screening |
| Protein A/G Coating | Fc-specific, oriented; commercial plates available [32] [33] | High, species/subclass-dependent affinity [32] | General oriented immobilization for mouse/rabbit IgG |
| Random Biotin-Streptavidin | Strong binding; requires biotinylation [35] | Moderate (risk of binding site occlusion) [34] | When covalent attachment is needed |
| Site-Specific Biotin-Streptavidin | Uniform orientation via Fc-biotinylation [34] | High (~3x improvement vs. random) [34] | Maximal sensitivity assays, low-abundance targets |
| Secondary Antibody Coating | Prevents denaturation, captures specific species IgG [32] | ~0.625 pmol/well of mouse IgG [32] | When primary antibodies are prone to denaturation |
Table 2: Egg Allergen Recovery in Challenging Food Matrices
This table summarizes the performance of different commercial egg allergen ELISA kits in various matrices, highlighting the challenge of matrix effects [3].
| Food Matrix | Number of Kits with Satisfactory Recovery (out of 7) | Notes on Matrix Interference |
|---|---|---|
| Cookie, Chocolate, Wine | 7 | Low interference; most kits perform well. |
| Pasta, Salad Dressing, Ice Cream | 4 | Moderate interference; kit selection is critical. |
| Meat/Meat Replacers | 1 | High interference; the most challenging matrix. |
Experimental Protocols
Protocol: Evaluating Immobilization Strategies for Egg Allergen Capture
Objective: To compare the performance of passive adsorption versus oriented immobilization for capturing processed egg allergens in a complex matrix.
Materials:
- Surfaces: Polystyrene ELISA plate (for passive adsorption), Protein G-coated plate, Streptavidin-coated plate.
- Antibodies: Specific mouse anti-egg allergen IgG, Biotinylated version of the same antibody (both random and site-specific if available).
- Reagents: Blocking buffer (e.g., BSA or casein), processed egg allergen standard, food sample extracts, standard ELISA detection reagents.
Procedure:
- Coating: Immobilize the capture antibody on the different surfaces.
- Passive Adsorption: Dilute anti-egg allergen IgG in coating buffer and add to the polystyrene plate. Incubate overnight at 4°C.
- Protein G Orientation: Dilute the same IgG and add to the Protein G plate. Incubate 1-2 hours at room temperature.
- Biotin-Streptavidin Orientation: Dilute the biotinylated anti-egg allergen IgG and add to the Streptavidin plate. Incubate 1 hour at room temperature.
- Blocking: Wash all plates and block with an appropriate blocking agent for 1-2 hours.
- Antigen Binding: Add a dilution series of the egg allergen standard and your food sample extracts to the plates. Incubate for the required time.
- Detection and Analysis: Complete the ELISA with your chosen detection antibody and substrate. Compare the sensitivity, signal-to-noise ratio, and recovery of the egg allergen from the food matrix across the different surfaces.
Workflow: Comparing Antibody Immobilization Strategies
The Scientist's Toolkit
Research Reagent Solutions
| Item | Function in Surface Engineering | Example Application |
|---|---|---|
| Protein G-coated Plates | Oriented immobilization of antibodies from many species via Fc region binding [32]. | General capture antibody coating for sandwich ELISA. |
| Secondary Antibody-coated Surfaces | Pre-adsorbed surface that binds a specific antibody isotype, preventing its denaturation on polystyrene [32]. | Ideal when primary antibodies are limited in quantity or prone to denaturation. |
| Streptavidin-Coated Plates | Provides a surface for immobilizing any biotinylated molecule with high affinity and stability [34] [35]. | Versatile platform for oriented immobilization of biotinylated capture antibodies. |
| Microbial Transglutaminase (mTG) | Enzyme for site-specific biotinylation of antibodies at a conserved glutamine in the Fc region (Q295) [34]. | Creating optimally oriented biotinylated antibodies for maximum assay sensitivity. |
| Non-fouling Polymers (e.g., PEG) | Synthetic polymers used to modify surfaces to minimize non-specific protein adsorption [35]. | Reducing background noise in complex matrices like food samples. |
Frequently Asked Questions (FAQs) on ELISA Blocking
1. What is the primary purpose of a blocking step in an ELISA? The blocking step is critical to prevent non-specific binding of detection antibodies or other assay components to the multi-well plate surface itself. When a plate is fully blocked, assay sensitivity is enhanced because non-specific background signal is significantly reduced [37].
2. Why might my ELISA have a high background despite using a blocking buffer? High background is commonly caused by an ineffective blocking strategy. Potential reasons include:
- Insufficient Blocking: The blocking time may be too short, the concentration of the blocking agent too low, or the blocking buffer itself may be incompatible with your antibody-sample pair [37] [2].
- Cross-Reactivity: The detection antibody may be cross-reacting with the blocking agent itself. For instance, if you are using a secondary antibody raised in goat, a blocking buffer containing normal goat serum could cause high background [38].
- Insufficient Washing: Inadequate washing after the blocking step can leave unbound proteins that contribute to background [10].
3. How do I choose the right blocking agent for my experiment? The optimal blocking agent depends on your specific assay components and sample type. Common agents include proteins like BSA, casein, gelatin, or serum [2]. The key is to select a blocking protein that is immunologically inert to your antibodies and sample. A checkerboard titration is the best method to compare different blocking solutions and identify the one that delivers the highest signal-to-noise ratio for your assay [39].
4. Can the sample matrix affect my blocking strategy? Yes. The sample matrix (e.g., serum, cell lysate) can introduce its own proteins and factors that lead to non-specific binding. It is recommended to use a standard diluent that matches your sample matrix as closely as possible. If the sample shows poor linearity, spike-and-recovery experiments should be performed to ensure the matrix is not interfering with detection [37].
Troubleshooting Guide: High Background and Non-Specific Binding
| Problem Phenomenon | Potential Root Cause | Recommended Troubleshooting Action |
|---|---|---|
| High Uniform Background | Ineffective blocking buffer or insufficient blocking time [37] [2]. | Increase blocking time and/or concentration of the blocker. Try a different blocking reagent (e.g., switch from BSA to casein) [38] [2]. |
| Antibody concentration is too high [2]. | Titrate the primary and secondary antibodies to find the optimal working concentration that minimizes background. | |
| Insufficient washing after blocking or between antibody steps [10] [6]. | Increase the number and/or duration of washes. Add a 30-second soak step between washes to ensure unbound components are fully removed [10]. | |
| High Spotty Background | Non-specific binding of antibodies [38]. | Ensure a block step is included. Use an affinity-purified antibody, and consider using a serum-based blocker from the same species as the secondary antibody [38]. |
| Contaminated buffers or reusable plastics introducing HRP [38] [6]. | Always prepare fresh buffers. Use fresh plate sealers and reagent reservoirs for each step to avoid residual enzyme contamination [10]. | |
| Poor Sensitivity with Background | Blocking agent interfering with antigen-antibody binding. | Test different types of blocking agents (e.g., non-fat dry milk, BSA, fish gelatin) to find one that does not mask the epitope of your target allergen. |
Experimental Protocol: Systematic Optimization of Blocking Conditions
A checkerboard titration is the most effective method for optimizing multiple ELISA parameters simultaneously, including the blocking buffer [37] [39]. The following protocol outlines this process.
Objective: To identify the blocking agent and concentration that minimizes background while maximizing specific signal in an ELISA for detecting processed egg allergens.
Materials:
- ELISA plates
- Coating antibody (specific to your target allergen)
- Target allergen standard
- Detection antibody (specific to your target allergen)
- Enzyme-conjugated secondary antibody (if using indirect detection)
- Candidate blocking buffers (e.g., 1%, 3%, and 5% BSA in PBS; 1%, 3%, and 5% Casein in PBS; 5% non-fat dry milk in PBS)
- Wash buffer (e.g., PBS with 0.05% Tween-20)
- Substrate solution
- Stop solution
- Plate reader
Methodology:
- Plate Coating: Coat the plate with a fixed, optimal concentration of the capture antibody. Incubate overnight, then wash.
- Checkerboard Blocking: Apply different blocking buffers to the plate in a grid pattern. For example, use different columns for different blocking agents (BSA, Casein, Milk) and different rows for different concentrations (1%, 3%, 5%). Incubate for 1-2 hours at room temperature.
- Allergen and Detection: After washing, add your target allergen standard at a known concentration, followed by the detection antibody and enzyme conjugate as per your standard protocol.
- Signal Detection: Add substrate, stop the reaction, and read the absorbance.
Data Analysis: Calculate the signal-to-noise ratio for each well: Signal-to-Noise Ratio = (Mean Absorbance of Test Well) / (Mean Absorbance of Negative Control Well) The blocking condition that yields the highest signal for the positive control and the lowest signal for the negative control (highest signal-to-noise ratio) is the optimal condition.
Workflow for Blocking Strategy Optimization
Research Reagent Solutions for Blocking Optimization
The following table lists key reagents essential for developing and optimizing an effective ELISA blocking strategy.
| Reagent | Function in Blocking Optimization |
|---|---|
| Bovine Serum Albumin (BSA) | A common protein blocker that binds to unsaturated binding sites on the polystyrene plate. It is defined and pure, but may not be suitable for all assay systems due to potential cross-reactivity [2]. |
| Casein | A protein derived from milk. Its non-immunogenic nature often makes it a highly effective blocking agent, especially for immunoassays, as it is less likely to interact with antibodies. |
| Non-Fat Dry Milk | A complex and inexpensive blocking agent containing caseins and other proteins. However, it can contain biotin and immunoglobulins that may cause interference in some assays [38]. |
| Normal Sera (e.g., Goat, Horse) | Serum from a non-immune animal is used to block against non-specific binding, particularly when it matches the species of the secondary antibody. It is complex and can be highly effective. |
| Fish Skin Gelatin | A alternative blocking protein that is immunologically distant from mammalian proteins, reducing the chance of cross-reactivity in assays detecting mammalian allergens or analytes. |
| Tween-20 | A non-ionic detergent added to wash buffers. It helps reduce non-specific hydrophobic interactions, thereby lowering background. Typical concentrations range from 0.01% to 0.1% [2]. |
Detecting egg allergens in processed foods presents a significant analytical challenge. During thermal processing, egg proteins can denature, aggregate, and undergo structural changes that mask antibody-binding epitopes, dramatically reducing detection sensitivity in conventional Enzyme-Linked Immunosorbent Assays (ELISAs) [40] [28]. This limitation is particularly critical given that for egg-allergic individuals, the eliciting dose (ED01) for an objective reaction can be as low as 0.2 mg of total egg protein [40]. Bridging this sensitivity gap requires moving beyond traditional ELISA formats to advanced signal amplification strategies that can detect trace amounts of altered allergens. This technical guide explores cutting-edge enzymatic and synthetic biology approaches—including CRISPR-linked immunoassays (CLISA) and T7 RNA polymerase–linked immunosensing assays (TLISA)—to overcome these limitations, providing researchers with practical troubleshooting advice and optimized protocols for enhanced egg allergen detection.
Advanced Signal Amplification Technologies
Traditional Enzymatic Amplification Systems
Traditional ELISA relies on enzyme conjugates such as Horseradish Peroxidase (HRP) and Alkaline Phosphatase (AP) to generate a detectable signal [7]. While these systems remain fundamental, their sensitivity is often insufficient for detecting low-abundance allergens in complex matrices. The biotin-streptavidin system provides a significant amplification advantage by exploiting the high-affinity interaction between biotin and streptavidin. Since each streptavidin molecule contains four biotin-binding sites and multiple biotins can be conjugated to a single secondary antibody, this system allows for the incorporation of more enzyme molecules per detection event, substantially enhancing signal intensity [41].
Synthetic Biology-Enhanced Immunoassays
CRISPR-Linked Immunoassays (CLISA) and T7 RNA Polymerase–Linked Immunosensing Assays (TLISA) represent a paradigm shift in immunoassay sensitivity. These approaches marry the specificity of antibody-antigen recognition with the powerful amplification capabilities of nucleic acid detection.
In CLISA, the traditional enzyme label is replaced with a CRISPR-Cas system. Once the antibody-antigen binding occurs, a triggered Cas enzyme (such as Cas12a or Cas13a) cleaves reporter molecules, creating an amplified, detectable signal [42]. Similarly, TLISA employs a T7 RNA polymerase system linked to the detection antibody, enabling programmed synthesis of numerous RNA reporters following antigen recognition [42]. These cell-free synthetic biology approaches can achieve detection limits in the atto- to femtomolar range, bridging the sensitivity gap that has traditionally separated protein detection from nucleic acid-based tests like PCR [42].
Table 1: Comparison of Signal Amplification Approaches for Allergen Detection
| Amplification Method | Mechanism | Approximate Detection Limit | Suitability for Processed Egg Allergens |
|---|---|---|---|
| Traditional ELISA | HRP/AP enzyme-substrate reaction | Pico- to nanomolar [42] | Limited - epitopes may be denatured [28] |
| Biotin-Streptavidin | Multi-enzyme loading via high-affinity binding | Low picomolar [41] | Moderate - improved but still epitope-dependent |
| CLISA | CRISPR-Cas mediated nucleic acid amplification | Atto- to femtomolar [42] | High - detects trace amounts despite denaturation |
| TLISA | T7 RNA polymerase-driven RNA reporter synthesis | Atto- to femtomolar [42] | High - exceptional for low-abundance targets |
Troubleshooting Guide: Low Sensitivity in Egg Allergen Detection
Frequently Asked Questions
Q1: My ELISA shows weak or no signal when testing processed food samples for egg allergens, despite using a high-quality commercial kit. What are the primary causes?
- Epitope Denaturation: Thermal processing can alter egg protein structures, hiding the antibody-binding sites recognized by your ELISA [28]. Consider using kits specifically validated for processed foods or switching to synthetic biology approaches less dependent on native protein structure.
- Matrix Effects: Complex food matrices (especially meat replacers, chocolate, and dressings) can interfere with antibody binding [40]. Only 1 of 7 commercial egg ELISA kits performed satisfactorily in meat/meat replacer matrices in a recent study.
- Insufficient Signal Amplification: Traditional enzymatic detection may be inadequate for trace allergen levels. Implement biotin-streptavidin amplification or transition to CLISA/TLISA formats [41] [42].
- Suboptimal Reagent Conditions: Ensure all reagents are at room temperature before use, use fresh substrates protected from light, and verify expiration dates [10].
Q2: How can I improve the sensitivity of my current ELISA without completely changing platforms?
- Optimize Antibody Orientation: Use Protein A, Protein G, or biotin-streptavidin systems to ensure uniform antibody orientation, enhancing binding efficiency [42].
- Enhance Washing Efficiency: Improve signal-to-noise ratio by increasing wash buffer soak time (add 30-second increments) and ensure complete drainage after each wash step [10].
- Extend Incubation Times: Gradually increase incubation times with the detection antibody, but be consistent across assays to maintain reproducibility [10].
- Implement Signal Enhancement: Switch to a chemiluminescent substrate system if using colorimetric detection, or incorporate biotin-streptavidin amplification [41] [7].
Q3: What are the key considerations when transitioning to synthetic biology approaches like CLISA for egg allergen detection?
- Reagent Compatibility: Ensure your detection antibodies can be effectively conjugated to the nucleic acid triggers without compromising specificity.
- Matrix Interference Testing: Validate that food matrix components don't inhibit the CRISPR-Cas or T7 polymerase enzymes, which may be more sensitive to inhibitors than traditional HRP/AP [42].
- Standard Curve Establishment: Develop a new standard curve using purified egg allergen proteins that have undergone similar processing to your test samples [40].
- Controls Implementation: Include additional negative controls to detect nonspecific nucleic acid amplification.
Advanced Troubleshooting Flowchart
The following diagram outlines a systematic approach to diagnosing and resolving low sensitivity in egg allergen detection assays:
Experimental Protocols for Enhanced Sensitivity
Protocol: Biotin-Streptavidin Amplification for Egg Allergen ELISA
This protocol enhances traditional ELISA sensitivity through biotin-streptavidin amplification, particularly useful for detecting trace amounts of processed egg allergens.
Materials:
- Coated and blocked ELISA plate with captured egg allergens
- Biotinylated detection antibody (specific to egg proteins)
- Streptavidin-HRP conjugate (e.g., 1:30,000 dilution)
- Appropriate wash buffer (PBS with 0.05% Tween-20 recommended)
- Chemiluminescent or colorimetric HRP substrate
Procedure:
- After sample incubation and washing, add biotinylated detection antibody diluted in standard diluent (0.5-5 µg/mL for affinity-purified antibodies) [43].
- Incubate for 2 hours at room temperature with gentle shaking.
- Wash plate 5 times with wash buffer, ensuring complete drainage.
- Add streptavidin-HRP conjugate at optimized concentration (20-200 ng/mL for colorimetric systems) [43].
- Incubate for 30 minutes at room temperature.
- Wash plate 5 times as before.
- Add substrate and measure signal following manufacturer's instructions.
Troubleshooting Notes:
- If background is high, titrate down the concentration of biotinylated antibody and streptavidin-HRP.
- For processed samples with suspected epitope damage, try increasing the detection antibody concentration within the recommended range.
- Test different standard diluents to better match your sample matrix [43].
Protocol: Checkerboard Titration for Antibody Optimization
Systematically optimize capture and detection antibody concentrations using checkerboard titration.
Table 2: Checkerboard Titration Scheme for Egg Allergen Antibodies
| Capture Antibody (µg/mL) | Detection Antibody (µg/mL) | Resulting Signal | Background | Optimal? |
|---|---|---|---|---|
| 1.0 | 0.5 | Low | Low | No |
| 1.0 | 2.5 | Medium | Low | Possible |
| 1.0 | 5.0 | High | Medium | No |
| 5.0 | 0.5 | Medium | Low | Possible |
| 5.0 | 2.5 | High | Low | Yes |
| 5.0 | 5.0 | High | High | No |
| 10.0 | 0.5 | High | Medium | No |
| 10.0 | 2.5 | High | High | No |
| 10.0 | 5.0 | Saturated | High | No |
Procedure:
- Prepare three concentrations of capture antibody in coating buffer (e.g., 1, 5, and 10 µg/mL for affinity-purified antibodies) [43].
- Coat separate plate rows with each concentration (100 µL/well), incubate overnight at 4°C.
- Block plate with appropriate blocking buffer (BSA or casein-based).
- Prepare three concentrations of detection antibody in standard diluent.
- Add egg allergen standard to all wells, then add detection antibody concentrations to different columns.
- Complete ELISA protocol with your standard detection system.
- Identify the combination that provides strong specific signal with minimal background.
The Scientist's Toolkit: Research Reagent Solutions
Table 3: Essential Reagents for Enhanced Egg Allergen Detection
| Reagent/Category | Function | Specific Examples & Notes |
|---|---|---|
| High-Affinity Antibody Pairs | Specific capture and detection of target egg proteins (e.g., ovalbumin, ovomucoid) | Select pairs validated for processed foods; ensure different epitope recognition [40] |
| Biotin-Streptavidin System | Signal amplification through multi-enzyme loading | Biotinylated secondary antibodies + Streptavidin-HRP; enhances sensitivity 5-10x [41] |
| Chemiluminescent Substrates | High-sensitivity signal generation | Superior to colorimetric for low-abundance targets; provides broader dynamic range [7] |
| Matrix-Tolerant Buffers | Reduce food matrix interference | Casein-based blockers perform better for dairy/egg matrices [42] |
| CRISPR-Cas Components (CLISA) | Nucleic acid-based signal amplification | Cas12a/Cas13a enzymes with reporter probes; enables attomolar sensitivity [42] |
| T7 RNA Polymerase System (TLISA) | RNA reporter amplification | Programmable RNA synthesis for signal multiplication [42] |
| Reference Materials | Quantification and standardization | Certified reference materials (e.g., NIST 8445-spray dried whole egg) [40] |
| Methylation-Free Reagents | Prevent enzymatic inhibition | Important for synthetic biology approaches [42] |
Workflow Integration of Advanced Amplification Methods
The following diagram compares the workflow of traditional ELISA with advanced synthetic biology approaches, highlighting key sensitivity enhancement points:
The detection of processed egg allergens demands increasingly sensitive methods to protect allergic consumers effectively. While traditional enzymatic amplification like biotin-streptavidin systems can enhance conventional ELISA sensitivity, synthetic biology approaches such as CLISA and TLISA represent the future of ultrasensitive allergen detection. These methods bridge the sensitivity gap between protein and nucleic acid detection, enabling quantification of trace allergens even in highly processed food matrices where proteins may be denatured or fragmented.
Successful implementation requires systematic optimization of existing protocols and thoughtful transition to next-generation platforms. By applying the troubleshooting strategies and experimental protocols outlined in this guide, researchers can significantly improve their detection capabilities for egg allergens, contributing to safer food products for allergic consumers worldwide. As these technologies evolve, we anticipate further integration of cell-free synthetic biology systems into mainstream food safety testing, potentially enabling multiplexed detection of multiple allergens at unprecedented sensitivity levels.
This technical support guide addresses a critical challenge in food safety and clinical research: troubleshooting low sensitivity in ELISA when detecting processed egg allergens. Efficient extraction of allergens from complex, processed food matrices is paramount, as processing can denature proteins, mask epitopes, and significantly reduce detectability. The following FAQs and troubleshooting guides are designed to help researchers identify and overcome these obstacles to achieve reliable, sensitive, and reproducible results.
Frequently Asked Questions (FAQs)
1. Why is my ELISA sensitivity low for heat-processed egg samples? Heat processing can cause egg proteins to denature and aggregate, burying the antibody-binding epitopes. Furthermore, matrix components like fats and sugars in baked goods can interfere with antibody binding or protein extraction. To overcome this, use an extraction buffer containing SDS (e.g., 1-2%) to solubilize denatured and aggregated proteins, followed by sufficient dilution to mitigate SDS interference with antibody binding [44] [45]. Consider using a competitive ELISA format, which is often better at detecting fragmented or denatured proteins, as it relies on the competition for a single antibody binding site [44].
2. How does food processing affect allergen detection in ELISA? Processing techniques (e.g., baking, fermentation, high-pressure treatment) induce structural changes in proteins. This can destroy conformational epitopes (leading to false negatives) or create new ones (leading to false positives). The effectiveness of any extraction method is therefore highly dependent on both the specific protein and the processing conditions used [46].
3. What is the best way to handle high-fat matrices like chocolate for egg allergen testing? High-fat matrices can cause interference by non-specifically binding antibodies or trapping proteins. To mitigate this, use a protein-based binding agent, such as fish gelatin, in your extraction buffer to block non-specific sites. Furthermore, ensure you use an ELISA kit that has been specifically validated for high-fat, complex matrices [44].
4. My replicates show high variability. What could be the cause? High variability between replicates often stems from inconsistent sample preparation. This includes inadequate homogenization of the food sample, which fails to ensure a uniform distribution of the allergen. Pipetting errors and insufficient or inconsistent washing of the ELISA plate wells are also common causes [2] [10]. Always homogenize samples thoroughly and calibrate pipettes regularly.
5. What is the "hook effect" and how can I avoid it in my allergen assay? The "hook effect" is a phenomenon where an extremely high concentration of the analyte saturates both the capture and detection antibodies, preventing the formation of the "sandwich" complex and leading to a falsely low or negative signal. While this typically occurs at concentrations far above regulatory thresholds (often >1000 ppm), it can be avoided by performing a 1:10 dilution of the sample, which is usually sufficient to restore a linear response [44].
Troubleshooting Guide: Common ELISA Issues and Solutions
| Problem | Possible Cause | Recommended Solution |
|---|---|---|
| Weak or No Signal | Epitope damage from processing. | Use denaturing extraction buffer (e.g., with 1-2% SDS) and a competitive ELISA format [44] [45]. |
| Allergen concentration below detection limit. | Concentrate the sample or use a more sensitive ELISA kit or detection method (e.g., fluorescence) [47]. | |
| Sodium azide in buffer inhibiting HRP enzyme. | Use azide-free buffers or ensure sufficient washing [2]. | |
| High Background | Inefficient blocking or washing. | Increase blocking time/concentration; add Tween-20 (0.01-0.1%) to wash buffer; increase wash number/duration [2] [10]. |
| Matrix interference (e.g., polyphenols). | Add a protein-based blocking agent (e.g., fish gelatin) to the extraction buffer [44]. | |
| Antibody concentration too high. | Titrate antibodies to determine the optimal concentration [2]. | |
| High Variability Between Replicates | Inhomogeneous sample. | Thoroughly homogenize the food sample before extraction [2] [44]. |
| Inconsistent pipetting. | Calibrate pipettes and use proper technique [2] [10]. | |
| Inadequate or inconsistent washing. | Follow a strict washing protocol; consider using an automated plate washer [2] [10]. |
Experimental Protocols for Enhanced Extraction
Protocol 1: Standard Extraction from Complex Matrices
This protocol is designed to maximize protein recovery from challenging, processed foods.
- Homogenization: Weigh 2 g of the finely ground food sample. Add 20 mL of extraction buffer (e.g., PBS or a commercial extraction buffer). For difficult matrices, a buffer containing 1% SDS is recommended.
- Incubation: Mix vigorously on a vortex mixer for 10 minutes, then incubate with shaking for 15-30 minutes at room temperature or 60°C for challenging matrices (if compatible with the downstream ELISA).
- Clarification: Centrifuge the mixture at 4,500 x g for 15 minutes at room temperature.
- Collection & Dilution: Carefully collect the supernatant. If SDS was used, perform a necessary dilution (e.g., 1:50 or greater) in a neutral buffer to prevent interference with the immunoassay [44] [45].
- Analysis: Proceed with the ELISA according to the kit instructions, using the diluted extract.
Protocol 2: Immunoaffinity Enrichment for LC-MS/MS Detection
For cases where ELISA sensitivity is insufficient, coupling immunoaffinity with mass spectrometry provides a powerful alternative.
- Extraction: Perform extraction as in Protocol 1.
- Enrichment: Incubate the extracted sample with magnetic beads coated with an antibody specific to your target allergen (e.g., Gal d 2). This selectively captures the allergen from the complex matrix.
- Washing: Wash the beads thoroughly to remove non-specifically bound contaminants.
- Elution: Elute the purified allergen from the beads using a low-pH buffer or a solution compatible with mass spectrometry.
- Digestion & Analysis: Digest the eluted protein with trypsin and analyze the resulting peptides by LC-MS/MS. This method is less affected by protein denaturation from processing, as it targets specific peptide sequences [45].
Research Reagent Solutions
The following table details key reagents and their functions for optimizing allergen extraction and detection.
| Item | Function & Application |
|---|---|
| SDS (Sodium Dodecyl Sulfate) | A strong ionic detergent used in extraction buffers to solubilize denatured and aggregated proteins from processed foods, helping to expose hidden epitopes [45]. |
| Tween-20 | A non-ionic detergent added to wash buffers (typically at 0.01-0.1%) to reduce non-specific binding and lower background signal in ELISA [2]. |
| Competitive ELISA Kit | An assay format where the analyte in the sample competes with a labeled analyte for a limited amount of antibody. It is particularly effective for detecting small, fragmented, or denatured proteins found in hydrolyzed or heavily processed foods [44]. |
| Fish Gelatin | A protein-based blocking agent used during sample extraction to mitigate interference from polyphenols and other compounds in complex matrices like chocolate or wine [44]. |
| Monoclonal Antibodies | Antibodies that bind to a single, specific epitope. They offer high specificity and reduce the risk of cross-reactivity with non-target proteins in the food matrix compared to polyclonal antibodies [44] [45]. |
Workflow Visualization
Sample Extraction and Analysis Workflow
Factors Affecting ELISA Sensitivity
Systematic Troubleshooting: Identifying and Correcting Causes of Low Sensitivity
Why is a Checkerboard Assay fundamental for optimizing my ELISA?
The checkerboard assay is a systematic titration method used to simultaneously optimize the concentrations of two key reagents in an ELISA, most commonly the capture antibody and the detection antibody, or the antibody and the sample/antigen [48] [49]. This is critical because:
- Too concentrated reagents risk saturating the assay, leading to high background and poor dynamic range [48] [49].
- Too dilute reagents result in a weak, difficult-to-detect signal and low assay sensitivity [48] [49]. By testing various combinations, you can identify the optimal ratio that provides a strong, quantifiable signal with low background, ultimately enhancing the sensitivity and reliability of your ELISA [49].
How do I perform a Checkerboard Titration for ELISA optimization?
This protocol is designed to optimize a sandwich ELISA for critical reagents.
Materials Needed
- Coating Buffer: (e.g., carbonate-bicarbonate buffer, pH 9.6)
- Blocking Buffer: (e.g., BSA, skim milk, or casein in PBS-Tween) [42]
- Wash Buffer: (e.g., PBS with Tween-20)
- Capture Antibody: In a purified form [43].
- Detection Antibody: Often biotinylated or conjugated.
- Antigen/Sample: A known positive control or sample.
- Enzyme Conjugate: (e.g., Streptavidin-HRP if using a biotinylated detection antibody).
- Substrate: Appropriate colorimetric, chemiluminescent, or fluorescent substrate for the enzyme.
- Microplate Reader
Step-by-Step Procedure
- Prepare the Plate: Dilute your capture antibody in a coating buffer. The recommended starting concentration range is typically 1–15 µg/mL, with affinity-purified antibodies often working best at 1–12 µg/mL [43].
- Set Up the Checkerboard: In a 96-well microplate, you will titrate one variable along the rows and the other along the columns. A common setup is to titrate the capture antibody across the columns and the antigen/sample down the rows [48] [49].
- Add different concentrations of capture antibody to the columns.
- Add different concentrations of the antigen to the rows.
- Include control wells with no antigen and no capture antibody to assess background.
- Incubate and Wash: Incubate the plate to allow the capture antibody to adsorb to the well surface, then wash to remove unbound antibody.
- Block: Add a blocking buffer to all wells to cover any uncovered surface and prevent non-specific binding [42] [43].
- Add Antigen: Apply the different concentrations of your antigen/sample to the corresponding rows and incubate.
- Add Detection Antibody: After washing, add a single, pre-determined concentration of your detection antibody to all wells. Alternatively, you can perform a second checkerboard to optimize the detection antibody simultaneously. The recommended range is 0.5–10 µg/mL [43].
- Add Enzyme Conjugate and Substrate: Proceed with the addition of the enzyme conjugate and a suitable substrate according to your detection system.
- Measure and Analyze: Read the plate using a microplate reader. The optimal combination is the one that yields the strongest signal with the lowest background (i.e., the best signal-to-noise ratio).
Table: Recommended Antibody Concentration Ranges for ELISA Optimization [43]
| Antibody Source | Coating Antibody Concentration | Detection Antibody Concentration |
|---|---|---|
| Polyclonal Serum | 5–15 µg/mL | 1–10 µg/mL |
| Crude Ascites | 5–15 µg/mL | 1–10 µg/mL |
| Affinity-Purified Polyclonal | 1–12 µg/mL | 0.5–5 µg/mL |
| Affinity-Purified Monoclonal | 1–12 µg/mL | 0.5–5 µg/mL |
How do I interpret the results from a Checkerboard Assay?
After running the assay, you will generate a grid of data. The goal is to visually identify the well(s) with the optimal result.
- Look for the well that produces a high positive signal (e.g., high absorbance) but where the signal begins to plateau or where a further increase in reagent concentration does not yield a significant signal increase. This indicates you are in the saturating range.
- Compare this signal to your background wells (no antigen). The optimal condition should have a signal significantly higher than the background.
- The combination of reagent concentrations in this well represents your optimal starting point for the assay.
Table: Example Results from a Hypothetical Checkerboard Assay
| Capture Ab: 1 µg/mL | Capture Ab: 2 µg/mL | Capture Ab: 4 µg/mL | Capture Ab: 8 µg/mL | |
|---|---|---|---|---|
| Antigen: 100 pg/mL | 0.15 | 0.25 | 0.40 | 0.55 |
| Antigen: 50 pg/mL | 0.08 | 0.15 | 0.28 | 0.45 |
| Antigen: 25 pg/mL | 0.05 | 0.09 | 0.18 | 0.32 |
| No Antigen (Background) | 0.04 | 0.05 | 0.06 | 0.07 |
In this example, using 4 µg/mL Capture Ab with 100 pg/mL Antigen provides a good signal (0.40) that is much higher than its corresponding background (0.06).
How can I apply the Checkerboard Assay to my research on processed egg allergens?
When working with processed egg allergens, which can be denatured or have altered epitopes, assay optimization is paramount.
- Focus on Epitope Integrity: Processing can destroy or mask epitopes. A checkerboard assay helps you identify antibody pairs (capture and detection) that bind to different, accessible epitopes on the processed allergen, ensuring robust detection [50].
- Optimize for Complex Matrices: Processed foods are complex mixtures. Use a checkerboard to find antibody and sample dilutions that minimize matrix interference (high background) while maintaining a strong, specific signal for the target allergen.
- Maximize Sensitivity for Trace Detection: Processing may fragment allergens, reducing their concentration. The checkerboard assay allows you to push the limits of your ELISA's sensitivity by finding the reagent concentrations that can detect the lowest possible levels of the allergen [50].
The Scientist's Toolkit: Essential Reagents for Checkerboard Assay
Table: Key Research Reagent Solutions for ELISA and Checkerboard Assays
| Item | Function |
|---|---|
| High-Affinity, Matched Antibody Pairs | The core of a sandwich ELISA. Antibodies must recognize different epitopes on the target allergen for specific capture and detection [43]. |
| Biotin-Streptavidin System | A common signal amplification method. Biotinylated detection antibodies are bound by enzyme-conjugated streptavidin, increasing assay sensitivity [42] [50]. |
| Chemiluminescent Substrate | Offers higher sensitivity than colorimetric substrates for detecting low-abundance targets [43]. |
| Nonfouling Surface Blockers | Agents like BSA, casein, or synthetic polymers (e.g., PEG) reduce non-specific binding, improving the signal-to-noise ratio [42]. |
| Protein A/G | Bacterial proteins that bind the Fc region of antibodies, helping to orient capture antibodies correctly on the plate surface for improved antigen binding efficiency [42]. |
ELISA Checkerboard Optimization Workflow
This diagram outlines the logical sequence for planning and executing a checkerboard assay to troubleshoot low sensitivity in your ELISA.
Beyond the Checkerboard: Integrated Strategies for Enhanced Sensitivity
While the checkerboard assay optimizes reagent concentrations, consider these additional strategies to further improve your ELISA's sensitivity, particularly for challenging targets like processed allergens [42]:
- Advanced Surface Engineering: Use plates with engineered polymer brushes (e.g., PEG) or polysaccharide coatings (e.g., chitosan) to minimize non-specific binding and create a more favorable environment for antibody immobilization [42].
- Improved Antibody Orientation: Immobilize your capture antibody via Protein A/G or biotin-streptavidin systems. This ensures the antigen-binding sites are uniformly exposed to the solution, enhancing capture efficiency [42].
- Advanced Signal Amplification: Move beyond standard HRP substrates. Consider multi-enzyme labels or signal amplification systems that can increase sensitivity by up to 50-fold [50]. Integrating cell-free synthetic biology systems, such as CRISPR-linked immunoassays (CLISA), is an emerging frontier for ultra-sensitive protein detection [42].
Frequently Asked Questions (FAQs)
Q1: What are the most common causes of high background signal in ELISA? High background is frequently caused by insufficient washing, which fails to remove unbound reagents, or an ineffective blocking step, which allows non-specific binding of antibodies to the plate [14]. Other common reasons include using an overly concentrated primary or secondary antibody, contaminated reagents, stale substrate solutions, or incubating at an incorrect temperature [14] [51].
Q2: How can I optimize my washing protocol to reduce background? Increase both the number and duration of washing steps [14]. Ensure that your wash buffer contains a detergent like Tween-20 to aid in the complete removal of unbound reagents [14]. Visually inspect the plate during washing to confirm that all liquid is aspirated between steps, and ensure that the wash buffer is freshly prepared to avoid contamination [14].
Q3: What should I do if I suspect my blocking buffer is ineffective? First, ensure you are using a fresh, appropriate blocking agent at a sufficient concentration. If high background persists, consider switching to a different type of blocker. Studies have shown that protein-based blockers like BSA or casein are generally effective, but for specific applications like food allergen detection, non-proteinaceous alternatives such as Ficoll or polyvinylalcohol (PVA) can outperform them by reducing interference [52]. A recent 2025 study confirmed that a 3% casein-based blocking buffer delivered excellent results with minimal background and high diagnostic accuracy [53].
Q4: Why might my assay have low sensitivity when detecting processed egg allergens? Processed foods are a challenging matrix. The target proteins may be denatured or fragmented, which can hide the epitopes that your antibodies recognize [40]. To address this, use an ELISA kit that has been validated for your specific food matrix (e.g., pasta, chocolate, meat) [40]. Sample preparation is also critical; using a suitable extraction buffer and ensuring a sufficient sample-to-buffer ratio can improve antigen recovery [54].
Troubleshooting Guide: Key Strategies
Optimizing the Washing Step
The washing step is critical for removing unbound molecules and reducing background. Here is a detailed protocol:
- Wash Buffer Composition: Use a phosphate-buffered saline (PBS) or Tris-buffered saline (TBS) solution containing 0.05% Tween-20 [14]. The detergent helps dislodge and solubilize non-specifically bound proteins.
- Washing Technique:
- Fill each well completely with wash buffer.
- Soak the plate for 30 seconds to 1 minute on a gentle shaker to ensure adequate interaction with the well surface [14].
- Aspirate the buffer completely by inverting the plate and tapping it firmly on absorbent paper. For automated plate washers, ensure the machine is calibrated to avoid clogging and ensure complete fluid removal.
- Repeat the process for at least 3-5 washes after each incubation step [14].
- Troubleshooting: Visually confirm that no residual liquid remains in wells after aspiration. If using a multichannel pipette, ensure all tips are securely attached to avoid uneven washing across the plate [14].
Selecting and Validating a Blocking Buffer
Blocking saturates the remaining protein-binding sites on the microplate after coating. The choice of blocker can significantly impact your signal-to-noise ratio. The table below summarizes the performance of various blocking agents as reported in recent studies.
Table 1: Efficacy of Blocking Agents in ELISA
| Blocking Agent | Reported Concentration | Key Findings / Performance | Cost Consideration | Best For / Context |
|---|---|---|---|---|
| Casein (Purified) | 3% | Achieved 100% sensitivity & specificity; excellent at reducing non-specific binding [53]. | Very low (cost-effective) [53]. | General use; resource-limited settings; high-sensitivity diagnostics [53]. |
| Bovine Serum Albumin (BSA) | 1-5% | Common and generally effective, but can sometimes show residual non-specific binding [53]. | Moderate | General use; routine assays. |
| Non-Fat Dry Milk | 1-5% | A common and inexpensive protein-based blocker. | Low | General use; can contain background biotin which may interfere with streptavidin systems. |
| Ficoll | Information Missing | Performed as well as BSA; effective non-proteinaceous alternative [52]. | Information Missing | Detecting food allergens to avoid cross-reactivity with blocker proteins [52]. |
| Polyvinylalcohol (PVA) | Information Missing | Effective synthetic, non-proteinaceous blocker [52]. | Information Missing | Situations where protein-based blockers cause interference [52]. |
| Fish Gelatin | 1-5% | Another non-mammalian protein alternative to BSA. | Moderate | Reducing interference when detecting mammalian allergens. |
Experimental Protocol: Comparing Blocking Buffers You can systematically evaluate blockers in your own assay with this protocol:
- Coat the plate with your target antigen (e.g., processed egg protein extract) using a standard coating buffer.
- Divide the plate and apply different blocking buffers to separate rows or columns. Include a negative control (e.g., no blocker) for comparison.
- Block for 1-2 hours at room temperature or overnight at 4°C.
- Proceed with your standard ELISA protocol (primary antibody, secondary antibody, substrate).
- Analyze the results by comparing the signal-to-noise ratio. A good blocker will yield a high positive signal (from a known positive control) and a very low background signal (from a blank or negative control) [52] [53].
Addressing Matrix Effects in Processed Egg Allergen Detection
The food matrix can profoundly affect ELISA performance. A 2023 study compared seven commercial egg ELISA kits across nine food matrices and found significant variation in performance [40].
Table 2: Egg ELISA Kit Performance in Challenging Food Matrices
| Food Matrix | Number of Kits (out of 7) with Satisfactory Recovery | Notes on Matrix Interference |
|---|---|---|
| Cookie, Chocolate, Stock Cube, Wine | 7 | All kits performed within set recovery criteria. |
| Pasta, Vegetable Drink & Milk, Ice Cream, Salad Dressing | 4 | Moderate matrix effects observed in some kits. |
| Meat / Meat Replacers | 1 | This matrix was the most challenging, with high matrix effects that could not be fully explained by the blank [40]. |
Protocol for Mitigating Matrix Effects:
- Sample Dilution: Perform serial dilutions of your sample extract. If the measured concentration increases linearly with dilution, it suggests that matrix interference is being overcome [51] [40].
- Spike-and-Recovery Experiment: This is the gold standard for validating an assay in a complex matrix.
- Prepare a sample of your matrix that is known to be free of the allergen (blank).
- Spike a known amount of purified standard (e.g., egg protein) into the blank matrix extract.
- Process the spiked sample and the unspiked blank through your ELISA.
- Calculate the percent recovery:
(Measured concentration in spiked sample - Measured concentration in blank) / Known spiked concentration * 100%. A recovery of 80-120% is generally considered acceptable [40].
Experimental Workflow and Signaling Pathways
The following diagram illustrates the core workflow of a Sandwich ELISA and pinpoints where key troubleshooting steps for background and sensitivity apply.
The Scientist's Toolkit: Essential Research Reagents
Table 3: Key Reagents for Troubleshooting ELISA Background and Sensitivity
| Reagent / Solution | Function / Purpose | Troubleshooting Notes |
|---|---|---|
| Wash Buffer (PBS/TBS + Tween-20) | Removes unbound reagents; critical for minimizing background. | Always prepare fresh. The detergent (Tween-20) is essential. Confirm concentration (typically 0.05%) [14]. |
| Blocking Agents (e.g., Casein, BSA) | Saturates non-specific binding sites on the plate surface. | No universal blocker exists. Validate for your specific assay. Casein is a highly effective, low-cost option [53]. |
| Primary Antibody | Binds specifically to the target antigen. | Titrate for optimal concentration. Too high causes background; too low causes weak signal [14] [51]. |
| Enzyme-Conjugated Secondary Antibody | Binds to the primary antibody and produces a detectable signal. | Ensure it is specific to the host species of your primary antibody to avoid cross-reaction [54]. |
| Positive Control Sample | A known source of the target antigen. | Essential for benchmarking signal strength and confirming the assay is working [51] [40]. |
| Negative Control / Blank | A sample known to lack the target antigen. | Used to measure background signal and calculate the signal-to-noise ratio [14]. |
| Fresh Substrate Solution | Reacts with the enzyme to produce a colorimetric, chemiluminescent, or fluorescent signal. | Mix immediately before use. Degraded or contaminated substrate is a common cause of weak or no signal [14] [51]. |
Frequently Asked Questions
FAQ 1: How do incubation time and temperature specifically affect my ELISA results? Incubation time and temperature are critical for the binding kinetics between antibodies and antigens. Insufficient time or incorrect temperature can lead to incomplete binding, resulting in weak signal and low sensitivity. Excessive incubation can increase non-specific binding, leading to high background [10] [55]. Consistent parameters are vital for assay-to-assay reproducibility [56] [6].
FAQ 2: Why might my assay for processed egg allergens show low sensitivity, and how can incubation optimization help? Food processing can alter protein structures. For example, in eggs, thermal processing can make the allergen ovalbumin undetectable while ovomucoid remains stable [57]. If your detection antibody targets a labile epitope, signal loss may occur. Optimizing incubation time and temperature can help the antibody find its target by allowing more time for binding or using a slightly higher temperature to facilitate interaction with altered epitopes [39] [55].
FAQ 3: What is a systematic method to optimize incubation time and temperature simultaneously? The most efficient approach is a checkerboard titration assay, where you test different combinations of parameters in parallel [39] [43]. For instance, you can test multiple incubation times across the plate and multiple temperatures down the plate while keeping other variables constant.
Troubleshooting Guide: Low Sensitivity
| Problem & Phenomenon | Possible Root Cause | Diagnostic Experiment | Corrective Action |
|---|---|---|---|
| Weak or No SignalLow signal even when analyte is expected to be present. | • Reagents not at room temperature [10].• Incubation time too short for binding equilibrium [55].• Incubation temperature too low, slowing kinetics [39]. | Run a spike-and-recovery experiment [39] [58]. If recovery is poor, matrix effects or suboptimal binding may be the issue. | • Allow all reagents to equilibrate at room temperature for 15-20 minutes before the assay [10] [6].• Systematically increase incubation times in 15-30 minute increments. |
| High BackgroundHigh signal in negative controls and sample wells. | • Incubation time too long, increasing non-specific binding [10] [55].• Incubation temperature too high, accelerating undesired reactions. | Include a non-specific binding control (a well with all components except the analyte) [39]. If signal is high, background is a problem. | • Adhere strictly to recommended incubation times [10].• Ensure consistent incubation temperature; avoid stacking plates [10] [56]. |
| Poor Replicate DataHigh variation between duplicate or triplicate wells. | • Uneven incubation temperature across the plate ("edge effects") [10] [56].• Inconsistent timing between reagent additions to wells. | Check if wells on the plate's edge show a different signal pattern than central wells. | • Use plate sealers during all incubations to prevent evaporation and ensure even temperature [10] [56].• Ensure assay setup is continuous, with all reagents prepared beforehand [6]. |
Experimental Protocol: Optimizing Incubation with Checkerboard Titration
This protocol provides a detailed methodology for simultaneously optimizing incubation time and temperature to maximize assay sensitivity.
1. Principle and Objective The checkerboard titration allows for the efficient testing of two variables (e.g., time and temperature) across a range of values in a single experiment. The objective is to identify the combination that yields the highest signal-to-noise ratio for your specific assay conditions [39] [43].
2. Reagents and Equipment
- Coated ELISA plate (e.g., coated with capture antibody for your target egg allergen).
- Sample containing the target analyte (e.g., a processed egg sample with a known concentration of ovomucoid).
- Detection antibody, enzyme conjugate, and substrate.
- Plate sealer.
- Microplate reader.
- Thermally controlled incubators or water baths set to 4°C, 25°C (room temperature), and 37°C.
3. Step-by-Step Procedure
- Step 1: Plate Layout. Design a plate map where different incubation times are assigned to columns and different temperatures are assigned to rows.
- Step 2: Sample Addition. Add your standard or sample to all wells according to the plate layout.
- Step 3: Incubation. Place the sealed plate in the first temperature environment. After the shortest incubation time, remove the plate and immediately stop the reaction in the corresponding column by washing. Repeat this for each time point within that temperature group.
- Step 4: Repeat. Repeat Step 3 for each of the pre-set temperatures.
- Step 5: Detection. Complete the rest of the ELISA protocol (detection antibody, conjugate, and substrate addition) uniformly for the entire plate.
- Step 6: Data Analysis. Read the plate and plot the signal for each time-temperature combination. The optimal condition is the one that gives the strongest specific signal with the lowest background.
4. Data Interpretation A successful optimization will show a clear increase in signal with time until a plateau is reached. The temperature that achieves this plateau fastest and with the highest signal is optimal.
The Scientist's Toolkit: Key Research Reagent Solutions
For reliable ELISA results, especially in challenging applications like detecting processed allergens, the choice of reagents is paramount.
| Item | Function & Importance in Optimization |
|---|---|
| Matched Antibody Pairs | Pairs of antibodies that bind to distinct, non-overlapping epitopes on the target protein. Critical for sandwich ELISA. Monoclonal antibodies offer high specificity, while polyclonal can provide robust signals and are less susceptible to epitope damage from processing [59] [55]. |
| Appropriate Blocking Buffer | A protein solution (e.g., BSA) used to cover unsaturated surface sites on the microplate. Optimizing its concentration is essential to prevent non-specific binding, which causes high background [59] [43] [55]. |
| Matrix-Matched Standard Diluent | The solution used to dilute your standards. Its composition should mimic the sample matrix as closely as possible to ensure antibody binding affinity is equivalent in both, which is critical for accurate quantification [39] [43]. |
| Validated ELISA Plates | Specialized plates with high protein-binding capacity. It is crucial to use ELISA plates, not tissue culture plates, to ensure the capture antibody binds effectively and evenly [10] [56] [6]. |
Optimization Workflow and Allergen Detection Challenge
This diagram illustrates the logical workflow for troubleshooting and optimizing incubation parameters to address low sensitivity, particularly in the context of processed food allergens.
The diagram below visualizes the core challenge in detecting processed egg allergens: thermal processing can destroy some epitopes while leaving others intact.
For researchers troubleshooting low sensitivity in ELISA for processed egg allergens, matrix effects represent a significant analytical challenge. Complex food compositions can interfere with antibody binding, leading to false negatives or inaccurate quantitation. This is especially critical for egg allergen detection, where trace amounts can provoke severe reactions in sensitized individuals. This guide provides targeted strategies to overcome these hurdles in the most challenging matrices, including meat products and high-fat foods like chocolate.
FAQ: Understanding Matrix Effects
What are matrix effects and why do they impact ELISA sensitivity?
Matrix effects are interferences caused by other components in a food sample that alter the accuracy of your allergen assay. In the context of your research on processed egg allergens, this can mean:
- Lipids and fats in chocolate or meat non-specifically binding to antibodies or forming complexes with allergen proteins, hindering antibody binding [60].
- Proteins from other sources (e.g., meat or milk) cross-reacting with your detection antibodies, causing false positives [54].
- Polyphenols and pigments in certain matrices interfering with the antigen-antibody interaction.
- Food processing (e.g., heating) can alter protein structures, mask epitopes, or embed allergens within a food matrix, making them less extractable [61] [62].
Which food matrices are most problematic for egg allergen detection?
Comparative studies have identified that the recovery rate of allergens varies significantly across different matrices. The table below summarizes findings from a study comparing seven commercial egg ELISA kits in various foods [3].
Table 1: Matrix Challenges for Egg Allergen Detection
| Food Matrix | Level of Challenge | Key Interfering Components | Performance of Kits (out of 7 meeting criteria) |
|---|---|---|---|
| Cookie, Chocolate, Stock Cube, Wine | Moderate | Lipids, tannins, salts, spices | All 7 kits performed within set recovery criteria |
| Pasta, Vegetable Drink, Milk, Ice Cream, Salad Dressing | High | Proteins, emulsifiers, acids | At least 4 kits performed within set recovery criteria |
| Meat/Meat Replacers | Very High | High protein content, fats, myoglobin | Only 1 kit performed within set recovery criteria |
Troubleshooting Guide: Targeted Pretreatment Protocols
Protocol 1: Lipid-Rich Matrices (e.g., Chocolate, Ice Cream)
An optimized pretreatment method for high-fat foods can dramatically improve recovery. A study on milk allergens in chocolate demonstrated a method that extracted 2.29 times more allergen than standard commercial kit protocols [60].
Workflow: Lipid Matrix Pretreatment
Detailed Methodology:
- Ultrasound-Assisted Degreasing: Homogenize 1 g of sample with 5 mL of n-hexane. Sonicate for 15 minutes in an ice-water bath to prevent protein denaturation.
- Centrifugation: Centrifuge at 10,000 × g for 15 minutes at 4°C. Carefully discard the upper organic (lipid) layer.
- Weak Alkaline Extraction: Add 10 mL of a weakly alkaline extraction buffer (e.g., Phosphate-Buffered Saline, pH 8.2) to the defatted pellet. Vortex thoroughly to resuspend.
- Final Extraction: Sonicate again for 15 minutes, then centrifuge at 10,000 × g for 15 minutes at 4°C. The resulting supernatant is your clarified extract, ready for ELISA analysis.
This combined degreasing and alkaline buffer approach helps maintain protein structure and allergenicity, leading to more accurate detection [60].
Protocol 2: Complex Protein Matrices (e.g., Meat, Meat Replacers)
Meat products are among the most challenging matrices due to high background protein and potential for cross-reactivity.
Workflow: Analysis of Thermally Processed Meat Samples
Detailed Methodology:
- Sample Preparation: Trim 10 g of lean meat to remove visible fat and connective tissue.
- Thermal Treatment: Cook the sample (e.g., autoclave, steam, roast, or fry) to simulate processing conditions. For a standardized approach, heating at 100°C for 15 minutes in a water bath is effective.
- Extraction of Thermal Stable-Soluble Proteins (TSSP): Homogenize the cooked sample with 20 mL of 0.025 M Tris-buffered saline (TBS, pH 7.4) for 5 minutes.
- Clarification: Heat the homogenate at 100°C for 15 min, cool, and centrifuge at 3,220 × g for 15 min at 4°C. Filter the supernatant through Whatman No. 1 filter paper. This extract, enriched with TSSPs, is used for the subsequent iELISA [62].
This method leverages the stability of certain allergenic proteins to heat, helping to isolate them from the complex background of other meat proteins.
FAQ: General ELISA Optimization
My ELISA shows a weak signal. What could be wrong?
Weak or no signal is often related to reagent handling or assay execution [63] [64].
- Reagents not at room temperature: Always allow all reagents to sit on the bench for 15-20 minutes before starting the assay.
- Insufficient antibody or suboptimal dilutions: Re-optimize the concentration of your detection antibody and enzyme conjugate. Refer to Table 2 for guidelines.
- Target degradation: Ensure samples are properly stored at -80°C and avoid repeated freeze-thaw cycles.
- Incompatible sample buffer: Ensure your extraction buffer does not contain enzyme inhibitors (e.g., sodium azide inhibits HRP) [64].
My assay has high background. How can I reduce it?
High background is frequently caused by non-specific binding [63] [54].
- Insufficient washing: Increase wash volume, frequency, and duration. A typical regimen is 3-6 washes with a 5-minute soak using buffer containing 0.05% Tween 20 [65].
- Inadequate blocking: Optimize your blocking buffer. If cross-reactivity is observed with standard blockers like BSA or skim milk, try alternative blockers like fish gelatin or normal serum from an unrelated species [65] [54].
- Too much detection antibody: Titrate your detection antibody and enzyme conjugate to find the optimal concentration that maximizes signal-to-noise ratio.
- Cross-reactivity of secondary antibody: Validate that your enzyme-labeled secondary antibody does not bind non-specifically to other components in the sample [54].
The Scientist's Toolkit: Essential Reagents and Materials
Table 2: Key Research Reagent Solutions for Optimized Allergen ELISA
| Item | Function & Importance | Optimization Tips |
|---|---|---|
| Microplate | Solid phase for protein binding. | Use high-binding polystyrene plates for most applications. For difficult epitopes, pre-coated plates (e.g., with Protein A) can improve orientation and sensitivity [65] [62]. |
| Coating Buffer | Medium for immobilizing the capture antibody. | Carbonate-bicarbonate buffer (pH 9.4) is standard. Ensure high pH for efficient passive adsorption [65]. |
| Blocking Buffer | Saturates unused binding sites to prevent non-specific binding. | 1-5% BSA, casein, or non-fat dry milk in PBS. If cross-reactivity occurs, switch to a non-mammalian protein blocker (e.g., fish gelatin) [65] [54]. |
| Wash Buffer | Removes unbound reagents and reduces background. | PBS or TBS with 0.05% (v/v) Tween 20. Use ample volume (300-400 µL/well) for effective washing [65]. |
| Antibody Pairs | The core of sandwich ELISA for capture and detection. | Use validated "matched pairs" that recognize different, non-overlapping epitopes on the target allergen. Affinity-purified antibodies are recommended [65]. |
| Antibody Concentration | Critical for signal strength and signal-to-noise ratio. | Coating Antibody: 1-12 µg/mL (affinity purified). Detection Antibody: 0.5-5 µg/mL (affinity purified). Always titrate for your specific system [65]. |
By implementing these matrix-specific protocols and optimization strategies, researchers can significantly enhance the sensitivity, accuracy, and reliability of ELISA for detecting processed egg and other food allergens in even the most challenging food products.
The accurate detection of egg allergens in processed foods is critical for public health, as consumption of even low levels of egg protein can evoke harmful physiological responses in allergic individuals [40]. The eliciting dose for 1% of the egg-allergic population (ED01) is set at just 0.2 mg of egg protein [40]. However, research and diagnostic efforts are hampered by significant methodological challenges, particularly matrix effects from complex food products and the impact of food processing on allergen detection [40] [66].
Liquid handling systems have emerged as essential tools for addressing these challenges by reducing human-introduced variability and improving the reproducibility of sensitive ELISA workflows. This technical support center provides targeted guidance for researchers troubleshooting low sensitivity in ELISA for processed egg allergens, with a specific focus on optimizing automated liquid handling processes.
Understanding ELISA Performance for Egg Allergens
Performance Across Food Matrices
The performance of egg allergen ELISA kits varies significantly across different food matrices, as demonstrated in a comprehensive 2023 study comparing seven commercial kits [40]. The table below summarizes the key quantitative findings:
Table 1: Commercial Egg ELISA Kit Performance Metrics Across Matrices (2023 Study) [40]
| Matrix | Number of Kits with Satisfactory Recovery | Performance Notes |
|---|---|---|
| Cookie | 7/7 | All kits performed within set criteria |
| Chocolate | 7/7 | All kits performed within set criteria |
| Pasta | ≥4/7 | At least 4 kits showed satisfactory recovery |
| Salad Dressing | ≥4/7 | At least 4 kits showed satisfactory recovery |
| Vegetable Drink & Milk | ≥4/7 | At least 4 kits showed satisfactory recovery |
| Ice Cream | ≥4/7 | At least 4 kits showed satisfactory recovery |
| Meat/Meat Replacers | 1/7 | High matrix effects; most challenging matrix |
Recommended Workflow for Egg Allergen Detection
The UK Food Standards Agency recommends a specific workflow for egg allergen incident management that emphasizes orthogonal testing methods to avoid false negatives [66]. The following diagram illustrates this recommended approach:
Accuracy and Precision Fundamentals
In liquid handling, accuracy and precision have specific technical definitions that directly impact ELISA results [67]:
Accuracy (Systematic Error): The difference between the mean delivered volume and the target volume, expressed as a percentage [67]:
Systematic Error = (Delivered Volume - Target Volume) / Target Volume × 100%Precision (Random Error): The variation between replicate deliveries, expressed as the coefficient of variation (CV) [67]:
CV = (Standard Deviation / Mean Measured Volume) × 100%
Automated liquid handlers, while reducing human variability, introduce their own potential error sources that can affect ELISA sensitivity [68] [69]:
Table 2: Common Liquid Handling Error Sources and Impacts on ELISA
| Error Source | Impact on ELISA Sensitivity | Risk Reduction Strategy |
|---|---|---|
| Tip Quality & Type | Variable delivery volumes affecting standard curves and dilutions | Use vendor-approved tips; avoid cheap bulk tips with flash residue [68] [69] |
| Contamination | Carryover between samples causing false positives or elevated background | Implement effective tip washing; add trailing air gap; careful tip ejection planning [68] [69] |
| Sequential Dispensing | Inconsistent volumes across plates affecting well-to-well reproducibility | Validate equal volume in each dispense; first/last dispense often problematic [68] [69] |
| Serial Dilution Errors | Incorrect standard curve leading to quantification errors | Verify mixing efficiency between transfers; ensure homogeneity before transfer [68] [69] |
| Pipetting Method | Improper technique for reagent properties affecting delivery accuracy | Use forward mode for aqueous solutions; reverse mode for viscous liquids [68] [69] |
FAQs: Troubleshooting Low Sensitivity in Egg Allergen ELISA
Why is my egg allergen ELISA showing weak or no signal despite using automated liquid handling?
Weak signals can result from several factors unrelated to the liquid handler itself [10]:
- Reagents not equilibrated to room temperature before starting assay
- Incorrect storage of ELISA components or use of expired reagents
- Capture antibody not properly binding to plate
- Plate reading at incorrect wavelength
How can I verify my liquid handler is dispensing accurately for low-volume ELISA reagents?
Implement a regular calibration program using either gravimetric or photometric methods [67]. For volumes under 5 μL, gravimetric methods become unreliable due to evaporation, making fluorescence-based methods preferable [67]. Request test plans and results from your vendor to understand published specifications [67].
My ELISA results are inconsistent between runs despite using the same automated protocol. What should I check?
Inconsistent results often stem from [68] [10] [69]:
- Variable tip depth in reagent reservoirs (maintain 2-3 mm below liquid surface)
- Inconsistent incubation temperature across runs
- Insufficient washing or variation in washing efficiency
- Use of different tip lots with varying properties
Why does my egg allergen recovery vary significantly across different food matrices?
Matrix effects are well-documented challenges in allergen detection [40]. Meat/meat replacers show particularly high interference, with only 1 of 7 commercial ELISA kits demonstrating satisfactory recovery in this matrix [40]. Processing conditions also significantly impact allergen detectability, requiring specialized kits for hydrolyzed products [66].
How can I minimize background signal in my egg allergen ELISA when using automated systems?
High background often results from [10]:
- Insufficient washing - increase duration of soak steps
- Light exposure to substrate prior to use
- Longer incubation times than recommended
- Contamination from plate sealers or insufficient tip cleaning
Research Reagent Solutions for Egg Allergen Research
Table 3: Essential Materials for Egg Allergen ELISA Research
| Reagent/Material | Function | Specific Examples/Notes |
|---|---|---|
| Reference Materials | Quantification and method validation | NIST SRM 8445 (whole egg); ThRAll RMs (hen's egg in broth/chocolate); FSA RMs (egg white in chocolate) [66] |
| Commercial ELISA Kits | Detection and quantification of egg allergens | Morinaga kits recommended for hydrolyzed products; multiple kits needed for different egg white protein targets [66] |
| Vendor-Approved Tips | Ensure accurate and precise volume delivery | Critical for minimizing variation; cheap bulk tips may have flash residue and poor fit [68] [69] |
| Liquid Class-Specific Verification Tools | Volume transfer validation | Gravimetric for volumes >5μL; fluorescent methods for smaller volumes or positive displacement systems [67] |
| Appropriate Plate Sealers | Prevent evaporation and contamination | Use fresh sealers each time plate is opened; prevent well-to-well contamination [10] |
Experimental Protocol: Liquid Handler Performance Verification
Volumetric Performance Assessment
Regular verification of liquid handler performance is essential for maintaining ELISA reproducibility [67]. The following workflow outlines the recommended verification process:
Method Details
Gravimetric Measurement [67]:
- Suitable for volumes >5 μL
- Measure weight of dispensed liquid and convert to volume using density
- Account for evaporation effects, particularly critical with small volumes
- Perform multiple replicates for statistical significance
Photometric Measurement [67]:
- Suitable for all volumes, essential for ≤5 μL
- Use absorbance or fluorescence based on dye concentration
- For air-displacement systems: measure with liquid class-specific absorbance
- For positive-displacement systems: fluorescent dye reliably indicates performance
Advanced Solutions: Next-Generation ELISA Technologies
The field of allergen detection is evolving with new technologies that address sensitivity challenges. Key developments include [70]:
- Digital ELISA: Enables ultra-sensitive, single-molecule detection for low-abundance allergens
- Automation-Integrated ELISA: Provides completely automated solutions for high-throughput needs
- Microfluidic & Lab-on-Chip ELISA: Reduces reagent costs and enables miniaturization
- Alternative Detection Methods: Shift from colorimetric to chemiluminescent, fluorescent, and electrochemical detection for improved sensitivity
Major manufacturers including Thermo Fisher Scientific, Bio-Techne, and Tecan Group are introducing platforms with enhanced sensitivity and faster processing times to meet these challenges [70].
Ensuring Reliability: Validation, Commercial Kit Comparison, and Regulatory Considerations
FAQs on ELISA Validation for Egg Allergen Research
Q1: Why are spike/recovery, dilutional linearity, and parallelism experiments crucial for my egg allergen ELISA? These validation experiments are essential to confirm that your ELISA can accurately quantify processed egg allergens in complex sample matrices. They help you identify and correct for matrix effects—where components in processed food samples interfere with antibody binding—which is a common cause of low sensitivity and inaccurate results [71] [72] [73]. Without this validation, your data may be unreliable.
Q2: My spike/recovery results are outside the acceptable range. What does this mean and how can I fix it? Poor spike/recovery indicates that your sample matrix (e.g., extracted processed food) is interfering with the assay, leading to either over-estimation or under-estimation of the allergen [73]. To correct this:
- Alter the Sample Diluent: Further dilute your sample in the standard diluent provided with your kit. This often dilutes out interfering substances [72] [74].
- Alter the Standard Diluent: If your samples are in a unique matrix, you may need to reconstitute your standards in a diluent that more closely matches it (e.g., a control food matrix extract known to be free of the allergen) [72].
- Adjust pH or Add Protein: The pH of your sample or the lack of a carrier protein can cause analyte loss. Adjusting the pH or adding a protein like BSA to the diluent can stabilize the analyte and improve recovery [72].
Q3: What does a failure in the dilutional linearity experiment tell me about my assay? Failed dilutional linearity occurs when the measured concentration of your analyte does not change proportionally with dilution [71]. This non-linear response suggests that interference from the sample matrix is concentration-dependent. It confirms that the matrix is affecting the assay and indicates that you must work within an "optimal dilution range" where the sample does show linearity to obtain accurate, quantitative data [71] [74].
Q4: A parallelism experiment shows high %CV. What is the likely cause for my egg allergen samples? A high %CV in a parallelism experiment signals a significant difference in how the antibodies in your kit recognize the purified standard allergen versus the endogenous, native allergen extracted from your processed food sample [71] [39]. For egg allergen research, a likely cause is that food processing (e.g., heating, glycation) has altered the protein structure (denaturation, aggregation) or introduced post-translational modifications, changing the antibody's binding affinity [71]. This may require you to find an ELISA kit validated for detecting processed forms of the allergen.
Q5: I have followed all validation steps, but my sensitivity is still low. What are other common sources of low sensitivity? Validation experiments rule out sample-specific issues. If sensitivity remains low, the problem may lie with the core assay reagents or protocol [51] [12]:
- Insufficient Antigen Capture: Ensure the capture antibody is coated at an optimal concentration (typically 1-10 µg/mL) and that you are using a high-binding ELISA plate, not a tissue culture plate [51] [10].
- Suboptimal Antibody Concentration: The detection antibody may be too dilute. A checkerboard titration is needed to re-optimize both capture and detection antibody concentrations [39].
- Incompatible Reagents: Check that your buffers do not contain sodium azide (inhibits HRP) or phosphate (inhibits AP), as these can quench the signal [75] [12].
- Reagent Handling: Ensure all reagents are at room temperature before use and that the enzyme conjugate or substrate has not expired or degraded due to improper storage [10].
Experimental Protocols for Robust ELISA Validation
The following workflows and protocols are designed to systematically diagnose and resolve common issues affecting the accuracy and sensitivity of your egg allergen ELISA.
Spike-and-Recovery Experimental Workflow
This experiment tests whether your sample matrix affects the detection of a known amount of allergen.
Detailed Protocol:
- Spike Preparation: Prepare a known concentration of the purified egg allergen standard (the "spike") in the standard diluent. The concentration should be within the dynamic range of your standard curve [73].
- Sample Spiking: Spike this solution into your test sample matrix (e.g., extracted cookie dough). A common ratio is 1 part spike to 4 parts sample, ensuring the final concentration remains within the standard curve [73].
- Control Spiking: In parallel, spike the same amount of analyte into the standard diluent alone. This is your "diluent control."
- ELISA Run: Run both the spiked sample and the spiked diluent control in your ELISA, alongside an unspiked sample to account for any endogenous allergen.
- Calculation:
Recovery % = (Measured concentration in spiked sample - Measured concentration in unspiked sample) / Theoretical spike concentration × 100%[73].- Compare the recovery of the sample matrix to the recovery of the diluent control.
- Interpretation: Recovery of 80-120% is generally considered acceptable, indicating minimal matrix interference [71] [73]. Values outside this range indicate significant interference.
Dilutional Linearity Experimental Workflow
This test determines if your sample can be reliably diluted to fall within the assay's standard curve.
Detailed Protocol:
- Sample Selection: Identify a sample with a high endogenous concentration of the egg allergen, or spike a sample to a concentration above the upper limit of quantification (ULOQ) [71].
- Serial Dilution: Perform a 1:2 serial dilution of this sample using the recommended sample diluent. Continue until the predicted concentration is below the lower limit of quantification (LLOQ) [71] [72].
- ELISA Run: Run all dilutions in the ELISA.
- Calculation and Analysis:
- Calculate the observed concentration for each dilution from the standard curve.
- Calculate the expected concentration by multiplying the observed concentration of the neat (or starting) sample by its dilution factor.
- Determine the percent recovery for each dilution:
(Observed Concentration / Expected Concentration) × 100%.
- Interpretation: Dilutions that yield recoveries between 80-120% are considered to display linearity [71]. The highest dilution within this range is your functional Limit of Dilution.
Parallelism Experimental Workflow
Parallelism assesses whether the native allergen in your sample and the purified standard are recognized equally by the assay antibodies.
Detailed Protocol:
- Sample Selection: Identify at least three different samples with high endogenous levels of the egg allergen. The concentration should be within the standard curve but near the ULOQ [71].
- Serial Dilution: Perform 1:2 serial dilutions of each sample using the sample diluent until the predicted concentration falls below the LLOQ [71] [39].
- ELISA Run: Run all dilutions in the ELISA.
- Calculation and Analysis:
- Calculate the concentration for each dilution, factoring in the dilution factor.
- For each sample, calculate the mean concentration, standard deviation, and the coefficient of variation (%CV) across all linear dilutions.
%CV = (Standard Deviation / Mean Concentration) × 100%.
- Interpretation: A %CV within 20-30% generally indicates successful parallelism, meaning the antibody affinity for the native and standard allergen is comparable [71]. A higher %CV suggests a loss of parallelism, potentially due to structural differences in the native allergen caused by food processing [71].
The following tables consolidate key quantitative benchmarks for interpreting your validation data.
Table 1: Interpretation of Validation Experiment Results
| Experiment | Primary Goal | Acceptance Criterion | What a Failure Indicates |
|---|---|---|---|
| Spike/Recovery [71] [73] | Measure matrix interference | 80% - 120% Recovery | Components in the sample matrix are inhibiting or enhancing antibody binding. |
| Dilutional Linearity [71] | Confirm accuracy across dilutions | 80% - 120% Recovery | Matrix interference is concentration-dependent; an optimal dilution factor must be established and used. |
| Parallelism [71] | Confirm comparable immunoreactivity | ~20-30% CV | The native allergen (e.g., from processed food) is immunologically different from the purified standard. |
Table 2: Example Data from a Spike/Recovery Experiment
| Sample Type | Spike Concentration | Expected Concentration | Observed Concentration | Recovery (%) | Interpretation |
|---|---|---|---|---|---|
| Standard Diluent (Control) | 20 pg/mL | 20 pg/mL | 19.8 pg/mL | 99% | Valid / No interference |
| Final Product Extract | 20 pg/mL | 20 pg/mL | 16.2 pg/mL | 81% | Acceptable (within 80-120%) |
| In-Process Sample | 20 pg/mL | 20 pg/mL | 25.5 pg/mL | 128% | Unacceptable - Over-recovery detected |
Research Reagent Solutions for ELISA Validation
A successful validation workflow relies on the consistent use of high-quality, appropriate reagents.
Table 3: Essential Reagents and Materials for Validation Experiments
| Reagent / Material | Function in Validation | Key Considerations |
|---|---|---|
| Purified Allergen Standard | Serves as the "spike" and for the standard curve. | Must be highly characterized and stable. Using the same batch across experiments is critical [39]. |
| Assay-Specific Diluent | Dilutes samples and standards while minimizing matrix effects. | The preferred diluent for samples; using a different one requires validation [74]. |
| High-Binding ELISA Plates | Solid phase for antibody or antigen immobilization. | Essential for consistent coating; tissue culture plates should not be used [10]. |
| Matched Antibody Pairs | Capture and detect the specific allergen. | Validated pairs are optimized for sensitivity and specificity, reducing development time [39]. |
| Blocking Buffer (e.g., BSA) | Covers unused binding sites on the plate to reduce background. | The choice of blocker can affect background signal and should be consistent [76]. |
Frequently Asked Questions (FAQs)
Q1: What is the difference between Limit of Blank (LoB), Limit of Detection (LoD), and Limit of Quantitation (LoQ)?
These three metrics define different capabilities of your assay at low analyte concentrations [77]:
- Limit of Blank (LoB): The highest apparent analyte concentration expected to be found when replicates of a blank sample (containing no analyte) are tested [77]. It is the threshold above which a signal can be distinguished from background noise.
- Limit of Detection (LoD): The lowest analyte concentration that can be reliably distinguished from the LoB [77]. It is the minimum concentration at which detection is feasible, but not necessarily with precise or accurate quantification.
- Limit of Quantitation (LoQ): The lowest concentration at which the analyte can not only be detected but also measured with acceptable precision and accuracy (bias) [77]. The LoQ meets pre-defined performance goals for your assay.
The relationship between these limits is summarized in the table below.
| Metric | Definition | Key Question Answered | Typical Calculation |
|---|---|---|---|
| LoB | Highest concentration expected from a blank sample [77] | Can we distinguish signal from noise? | Mean~blank~ + 1.645(SD~blank~) [77] |
| LoD | Lowest concentration reliably distinguished from LoB [77] | Can we detect the analyte's presence? | LoB + 1.645(SD~low concentration sample~) [77] |
| LoQ | Lowest concentration measurable with acceptable precision and accuracy [77] | Can we trust the numerical value? | ≥ LoD; concentration where precision (e.g., %CV) and bias meet pre-set criteria [77] [78] |
Q2: How do I experimentally determine the LoD and LoQ for my ELISA?
A robust determination requires testing multiple replicates of blank and low-concentration samples, often following guidelines from organizations like the Clinical and Laboratory Standards Institute (CLSI) [77] [79].
Experimental Protocol for LoD and LoQ Determination
Sample Preparation:
- Prepare a blank sample containing all assay components except the analyte (e.g., sample matrix only) [77].
- Prepare a low-concentration sample with the analyte present at a concentration near the expected detection limit [77]. For egg allergen research, this could be a processed food matrix spiked with a known, low amount of purified egg allergen.
Data Acquisition:
- Test at least 60 replicates of the blank and low-concentration samples for a rigorous establishment. For verification of a manufacturer's claim, 20 replicates may be sufficient [77].
- Run these samples across multiple days, using different reagent lots and instruments if possible, to capture real-world variability [77] [80].
Statistical Calculation:
- Calculate LoB: LoB = Mean~blank~ + 1.645 * (Standard Deviation~blank~). This defines the 95th percentile of the blank distribution (assuming a Gaussian distribution) [77].
- Calculate LoD: LoD = LoB + 1.645 * (Standard Deviation~low concentration sample~). This ensures that a sample at the LoD will exceed the LoB 95% of the time [77].
- Determine LoQ: Test samples at or above the LoD and measure their precision (e.g., %CV) and bias (difference from the true value). The LoQ is the lowest concentration where your pre-defined acceptance criteria (e.g., %CV ≤ 20% and bias ≤ 25%) are consistently met [77] [78] [79].
Q3: What are the common causes of poor sensitivity in ELISA?
Poor sensitivity, reflected by a higher-than-desired LoD, can stem from various factors [2] [81]:
- Suboptimal Reagents: Antibody concentration too low, inactive enzyme conjugate, or old/contaminated substrate [2] [81].
- Assay Procedure Errors: Incubation times too short, incubation temperature too low, or excessive washing [2] [81].
- Sample Issues: Incompatible sample matrix (e.g., presence of interfering substances), or analyte concentration below the assay's detection capability [2] [81].
- Detection Problems: Using an incorrect wavelength on the plate reader or sodium azide in buffers inhibiting HRP enzyme activity [2] [81].
Troubleshooting Guide: Improving Low Sensitivity
Problem: The signal is weak or absent, even when the target analyte is expected to be present, leading to a high LoD.
| Possible Cause | Solution | Experimental Protocol / Verification |
|---|---|---|
| Antibody Concentration Too Low [2] | Titrate and increase the concentration of the capture and/or detection antibody. | Perform a checkerboard titration. Coat plates with a range of capture antibody concentrations. Test with a low-concentration standard and a range of detection antibody concentrations. Select the combination giving the best signal-to-noise ratio. |
| Insufficient Antigen-Antibody Interaction [2] | Increase incubation time or optimize temperature. | For critical steps (sample or detection antibody incubation), extend the time (e.g., to 4°C overnight) and ensure the assay is performed at room temperature unless specified otherwise. |
| Suboptimal Signal Generation [81] | Ensure substrate is fresh and prepared correctly. Allow sufficient development time. | Prepare substrate immediately before use. Protect it from light. Optimize the substrate incubation time (e.g., 5-30 minutes) in the dark until color develops robustly. |
| Incompatible Sample Type / Matrix Effects [2] [80] | Use a validated sample type. Dilute or concentrate the sample. Perform a spike-and-recovery experiment. | Spike a known amount of pure analyte into your sample matrix. Calculate the percentage recovery. Poor recovery indicates matrix interference, requiring sample dilution, purification, or a matrix-matched standard curve. |
| Target Present Below Detection Limit [81] | Concentrate the sample or decrease the dilution factor. | For processed food samples, consider concentrating the protein extract using centrifugal filters before running the ELISA. |
The Scientist's Toolkit: Key Reagent Solutions
| Item | Function in ELISA | Considerations for Sensitivity |
|---|---|---|
| High-Affinity Antibody Pair [65] | Specifically captures and detects the target analyte. | The most critical factor. Use affinity-purified, matched antibodies that bind to distinct epitopes for sandwich ELISA [65]. |
| High-Sensitivity Substrate | The chromogenic, fluorogenic, or chemiluminescent reagent that generates the detection signal. | For low-abundance targets, use enhanced substrates (e.g., supersensitive TMB) or switch to fluorescent/chemiluminescent detection for a wider dynamic range and lower background [65]. |
| Blocking Buffer [65] | Coats the well to prevent non-specific binding of proteins, reducing background noise. | Optimize the type (e.g., BSA, casein) and concentration. Cross-reactivity with assay antibodies can cause high background [65]. |
| Microplate [65] | The solid phase to which the capture antibody is adsorbed. | Use high-binding, flat-bottom plates validated for ELISA. Plate material and well shape can impact protein binding and signal readout [65]. |
| Wash Buffer [65] [2] | Removes unbound reagents, reducing background. | Always include a mild detergent like Tween-20 (typically 0.05-0.1%) to minimize non-specific binding. Ensure consistent and thorough washing [65] [2]. |
The accurate detection of egg allergens is a critical component of food safety, essential for protecting allergic consumers and ensuring compliance with labelling legislation. This task is particularly challenging with heat-processed foods, where the detection efficiency of commercial ELISA kits can be compromised, leading to a significant underestimation of egg content or even false-negative results [25]. These analytical challenges are the primary focus of this technical support center.
The underlying issue stems from the nature of egg-white proteins, which form disulphide-linked aggregates during thermal processing. These aggregates are poorly soluble and can hinder the binding of detection antibodies used in immunoassays [25]. Consequently, researchers and food quality control professionals frequently encounter the problem of low sensitivity when analyzing matrices such as baked goods, pastries, and pasta. This guide provides a detailed comparative analysis of commercial ELISA kits and troubleshooting methodologies to overcome these obstacles, ensuring reliable quantification of egg allergens in both native and processed food products.
Comparative Performance of Commercial Egg ELISA Kits
Quantitative Kit Performance Across Matrices
The performance of ELISA kits varies significantly depending on the food matrix. A 2023 study comparing seven commercial kits across nine relevant matrices provides critical insight for kit selection [3].
Table 1: Comparative Performance of Commercial Egg ELISA Kits in Different Food Matrices (Recovery within Set Criteria) [3]
| Food Matrix | Number of Kits Performing Satisfactorily (out of 7) | Qualitative Detection at VITAL3 ED01 (0.2 mg total egg protein) |
|---|---|---|
| Cookie | 7 | All kits successful |
| Chocolate | 7 | All kits successful |
| Stock Cube | 7 | All kits successful |
| Wine | 7 | All kits successful |
| Pasta | At least 4 | All kits successful |
| Vegetable Drink & Milk | At least 4 | All kits successful |
| Ice Cream | At least 4 | All kits successful |
| Salad Dressing | At least 4 | All kits successful |
| Meat/Meat Replacers | 1 | All kits successful |
The data reveals that while all seven tested kits were capable of qualitative detection at the clinically relevant VITAL3 ED01 action level of 0.2 mg total egg protein, their quantitative performance was highly matrix-dependent [3]. The most straightforward matrices (cookie, chocolate, stock cube, wine) showed no recovery issues. In contrast, the meat/meat replacer matrix was particularly challenging, with only one kit recovering egg within the set criteria, largely due to significant, unexplained matrix effects [3].
Specifications of Representative Commercial Kits
Table 2: Specifications of Example Commercial Egg ELISA Kits
| Kit Name / Feature | Target Allergen(s) | Quantitation Range | Detection Limit (LOD) | Total Assay Time | Key Feature / Validation |
|---|---|---|---|---|---|
| InviLisa Egg ELISA Kit [82] | Ovalbumin (and Ovomucoid) | 1.0 – 10.0 mg whole egg powder/kg | 0.1 mg/kg | ~120 min (60 min extraction + 60 min ELISA) | Validated per AOAC guidelines |
| ELISA Systems Processed Egg Assay [25] | Processed Egg Proteins | Not specified | Not specified | Not specified | Specialized extraction for heat-processed foods |
| Amperometric Immunosensor (Research) [83] | Ovotransferrin (Gal d 3) | 55 – 1000 ng·mL⁻¹ | 16 ng·mL⁻¹ | 30 min | Research method; detects down to 0.010% egg |
The InviLisa kit exemplifies a standard commercial format, targeting ovalbumin and ovomucoid, the major egg allergens [82]. For challenging heat-processed samples, specialized kits like the ELISA Systems Processed Egg assay are developed with novel extraction methods that incorporate reducing agents and surfactants to break down cross-linked protein aggregates, thereby improving solubility and antibody binding [25]. Emerging technologies, such as the amperometric immunosensor for ovotransferrin (Gal d 3), demonstrate the potential for rapid analysis and extremely low detection limits, though these are primarily used in research settings [83].
Troubleshooting Guide: Addressing Low Sensitivity in Processed Egg Allergen Detection
Frequently Asked Questions (FAQs) and Solutions
Q1: My ELISA results for a baked product are much lower than expected, or negative, despite the product containing egg. What is the most likely cause?
A: The most probable cause is the formation of disulphide-linked protein aggregates during heat processing. These aggregates are poorly soluble and hide the antibody-binding epitopes, leading to severely reduced detection [25]. Standard extraction buffers in many kits cannot efficiently break down these complexes.
Q2: How can I improve the extraction of egg allergens from heat-processed matrices like cookies or pasta?
A: To overcome this, you need an extraction buffer that contains reducing agents and surfactants. These reagents break the disulphide bonds and help solubilize the cross-linked egg proteins, making them available for antibody detection [25]. If your current kit does not include such a buffer, consider switching to a kit specifically validated for "processed" or "heat-treated" egg, such as the ELISA Systems Processed Egg assay [25].
Q3: I am getting a high background signal across my plate. What are the common fixes?
A: High background is often due to non-specific binding or inadequate washing [6] [84] [85].
- Increase washing: Add more wash cycles or include a 30-second soak step between washes to ensure unbound reagents are fully removed [6].
- Check blockers: Ensure you are using an effective blocking buffer to minimize non-specific interactions [84].
- Fresh reagents: Prepare fresh buffers to avoid contamination [6] [85].
Q4: My standard curve looks good, but my sample signals are weak and inconsistent. What should I check?
A: This is a classic symptom of matrix interference.
- Dilute the sample: Try diluting your sample extract at least 1:2 in the appropriate diluent. If the measured concentration increases proportionally, matrix effects are likely masking detection [6].
- Check for pipetting errors: Ensure all samples are homogenized thoroughly and pipetted accurately. Bubbles in wells can also cause variation [84].
- Verify incubation times and temperatures: Deviations can significantly affect binding efficiency [85].
Q5: Why do I see high variation between duplicate wells?
A: Poor replicates typically stem from procedural inconsistencies [6] [84].
- Pipetting technique: Ensure the same amount of reagent is added to every well. Use a calibrated multi-channel pipette.
- Washing: Check that an automatic plate washer has all ports clean and is functioning evenly across the plate.
- Reagent temperature: Make sure all reagents are at the same, correct temperature before starting the assay [84].
Optimized Experimental Protocol for Processed Egg Detection
For reliable detection of egg in heat-processed foods, the extraction phase is paramount. The following workflow, based on best practices from kit manufacturers and recent research, is designed to maximize protein solubility and detection.
Detailed Protocol Steps:
- Homogenization: Weigh 1 gram of the processed food sample. Grind, chop, or blend it to a fine consistency to increase the surface area for extraction [83] [82].
- Extraction with Specialized Buffer: Add 10 mL of an extraction buffer specifically designed for processed allergens. This buffer must contain reducing agents (e.g., DTT) to break disulphide bonds and surfactants to solubilize the proteins [25]. Standard PBS may be insufficient.
- Vortex Mixing: Vortex the mixture for approximately 5 seconds to ensure the sample is fully suspended in the buffer [83].
- Heat Processing: Incubate the extraction mixture at 60°C for 30 minutes. This heated step provides the energy required to effectively disrupt the stable protein aggregates formed during cooking or baking [83].
- Centrifugation: Centrifuge the extract at 5000 rpm for 5 minutes. For a clearer supernatant, a second, higher-speed centrifugation (e.g., 10,000 rpm for 5 minutes) of the collected supernatant is recommended [83].
- Analysis: The resulting supernatant is now suitable for analysis with your chosen ELISA kit. If matrix effects are suspected, analyze a series of dilutions to ensure recovery [6].
The Scientist's Toolkit: Essential Research Reagent Solutions
Table 3: Key Reagents for Optimizing Egg Allergen Detection
| Reagent / Material | Function / Purpose | Application Note |
|---|---|---|
| Reducing Agents (e.g., DTT) | Breaks disulphide bonds (S-S) in heat-induced protein aggregates, linearizing proteins. | Critical for extracting allergens from baked goods, pastries, and pasta [25]. |
| Surfactants / Detergents | Aids in solubilizing hydrophobic proteins and protein aggregates, keeping them in solution. | Used in combination with reducing agents in specialized extraction buffers [25]. |
| Protein Stabilizers & Blockers | Coats unused binding sites on the ELISA plate and stabilizes assay biomolecules, reducing non-specific binding and background noise. | Improves signal-to-noise ratio and assay sensitivity [84]. |
| Anti-Ovomucoid (Gal d 1) Antibodies | Primary capture/detection antibodies targeting a major, heat-stable egg allergen. | Ovomucoid's stability makes it a valuable target for detecting egg in processed foods. |
| Anti-Ovotransferrin (Gal d 3) Antibodies | Primary capture/detection antibodies for the major egg-white allergen ovotransferrin. | Used in research immunosensors; demonstrates high sensitivity [83]. |
| Assay Diluents | Dilutes samples and reagents to a working concentration while minimizing matrix interference. | High-quality diluents can reduce false positives and improve consistency [84]. |
| TMB Substrate | Chromogenic substrate for Horseradish Peroxidase (HRP) enzyme. Produces a color change measurable by spectrophotometry. | The reaction is stopped with acid, and the intensity of color is proportional to the allergen amount [83]. |
Successfully troubleshooting low sensitivity in ELISA for processed egg allergens requires a systematic approach that addresses both the unique biochemistry of denatured egg proteins and general immunoassay best practices. The most critical step is recognizing that heat-processing fundamentally alters egg proteins, necessitating specialized extraction protocols with reducing agents. Furthermore, the choice of a commercial ELISA kit must be informed by its validated performance in the specific matrix of interest, as this greatly influences quantitative accuracy. By integrating robust sample preparation, careful kit selection, and meticulous attention to protocol details, researchers and industry professionals can overcome the challenge of low sensitivity, ensuring the reliable detection of egg allergens needed to protect consumer safety.
Assessing Cross-Reactivity with Other Avian Eggs and Food Proteins
FAQ: Addressing Low Sensitivity in ELISA for Processed Egg Allergens
Q1: My ELISA shows weak or no signal when testing heat-processed egg allergens. What could be the cause?
Weak or absent signal often stems from the assay's inability to detect the altered or denatured proteins in processed eggs. The primary causes and solutions are:
- Antibody-Antigen Mismatch: The antibodies in your ELISA kit may be specific for native (unprocessed) protein epitopes that are altered or destroyed during heat treatment [86]. For example, stone-baking egg whites leads to remarkable changes in all protein fractions, which can significantly reduce IgE binding [86].
- Insufficient Detection Antibody: The concentration of your detection antibody may be too low to bind the potentially lower number of available epitopes on processed allergens [56] [6].
- Suboptimal Reagent Handling: Ensure all reagents are at room temperature before use and are not expired, as this can lead to weak signals [10].
- Sample Matrix Interference: The sample buffer or other components in your processed egg extract might be masking detection. Diluting samples at least 1:2 in an appropriate diluent can help check for recovery of the signal [56] [6].
Q2: I have a good standard curve, but my processed egg samples read too high, causing poor discrimination. How can I fix this?
This problem, often seen as a "flat" standard curve, indicates that the assay's dynamic range is not optimally tuned for your samples.
- High Analyte Concentration: The target protein in your processed egg sample may be present at a concentration above the assay's highest standard [56] [6]. Solution: Dilute your samples and re-run the assay.
- Insufficient Detection Reagent: The concentration of enzymes like streptavidin-HRP may be too low. Solution: Check the dilution and titrate if necessary to increase sensitivity [56] [6].
- Insufficient Plate Development: The substrate incubation time might be too short. Solution: Slightly increase the substrate solution incubation time to enhance the signal [56] [6].
- Capture Antibody Issues: The capture antibody may not have bound well to the plate. Solution: Use a dedicated ELISA plate (not a tissue culture plate) and dilute the antibody in PBS without additional protein [56] [6].
Q3: My results show high background across the plate, obscuring the specific signal from quail egg cross-reactivity. How do I reduce background?
High background is a common issue that compromises assay sensitivity.
- Insufficient Washing: This is the most common cause, leaving unbound reagents in the wells. Solution: Increase the number of wash steps and add a 30-second soak step between washes to ensure complete removal of unbound material [56] [6].
- Inadequate Blocking: Non-specific binding sites on the plate are not fully covered. Solution: Use a suitable blocking buffer, such as 5-10% serum from the same species as the secondary antibody, or bovine serum albumin (BSA), casein, or gelatin [14].
- Antibody Concentration Too High: Excessive primary or secondary antibody can lead to non-specific binding. Solution: Decrease the antibody concentration and perform a titration to find the optimal concentration [14].
- Contamination: Reuse of plate sealers or reagent reservoirs can leave residual HRP enzyme, which reacts with the substrate to create a uniform blue color. Solution: Always use a fresh plate sealer and reagent reservoir for each step [56] [6].
Q4: How does heat processing impact the detection of egg allergens and cross-reactivity in ELISA?
Heat treatment fundamentally alters egg proteins, which directly impacts immunodetection. Research on hen's egg white (HEw) and quail egg white (QEw) reveals:
- Boiling (100°C): Has a limited effect on altering the allergenicity of certain proteins. SDS-PAGE analysis shows strongly stained bands for ovomucoid in both boiled HEw and QEw, indicating this allergen remains stable and detectable after boiling [86].
- Stone-Baking (45-110°C over 24h): Causes remarkable changes to all protein fractions. Consequently, IgE binding to stone-baked HEw proteins is profoundly decreased compared to boiled HEw [86].
- Cross-Reactivity Implication: Despite these changes, moderate immunologic cross-reactivity exists between QEw and HEw. In one study, 41.7% (5/12) of patients with HEw allergy showed a positive skin prick test to boiled QEw [86]. This means that while some epitopes are destroyed, others remain recognizable to the immune system, and your ELISA must be optimized to detect these.
| Heat Treatment | Impact on Protein Structure (per SDS-PAGE) | Impact on IgE Binding (per ELISA-Inhibition) | Clinical Cross-Reactivity (SPT/OFC) |
|---|---|---|---|
| Boiling (100°C) | Ovomucoid bands remain strong; ovalbumin weakens. | Moderate decrease from raw HEw. | 41.7% to boiled quail egg white. |
| Stone-Baking (45-110°C) | Remarkable changes for all protein fractions. | Profound decrease from raw HEw. | 16.7% to stone-baked hen's egg. |
Experimental Protocol: ELISA-Inhibition for Assessing Cross-Reactivity
The following protocol, adapted from a study on hen's and quail egg cross-reactivity, is a powerful method for troubleshooting sensitivity issues by quantifying the inhibitory potential of related allergens [86].
1. Principle ELISA-Inhibition measures how effectively a soluble inhibitor protein (e.g., processed quail egg extract) can block the binding of serum IgE to a known allergen (e.g., hen's egg white) immobilized on a plate. Strong inhibition indicates high cross-reactivity.
2. Reagents and Materials
- Coated ELISA Plate: Microplate coated with the target allergen (e.g., boiled hen's egg white extract).
- Inhibitors: Extracts of the test proteins (e.g., raw/boiled HEw, raw/boiled QEw, stone-baked HEw) at varying concentrations (e.g., 0.1, 1, 10, 100 µg/mL) [86].
- Sera: Pooled sera from individuals allergic to the target allergen.
- Standard ELISA Reagents: Detection antibodies, substrate, and stop solution.
3. Step-by-Step Procedure
- Step 1: Pre-incubation. Mix a fixed volume of the pooled sera with an equal volume of each inhibitor solution at different concentrations. Incubate this mixture at room temperature for 2 hours to allow IgE to bind to the soluble inhibitors [86].
- Step 2: Application to Plate. Transfer the pre-incubated mixture to the coated ELISA plate. Any IgE not bound to the soluble inhibitors in solution is free to bind to the immobilized allergen on the plate.
- Step 3: Standard ELISA Detection. Complete the remaining steps of your standard ELISA protocol (incubation, washing, addition of detection antibody, washing, substrate addition, and stopping the reaction).
- Step 4: Data Calculation. Calculate the percentage of inhibition for each inhibitor using the formula:
%inhibition = [(OD_uninhibited - OD_inhibited) / OD_uninhibited] × 100where OD is the optical density of the well without inhibitor (uninhibited) and with inhibitor (inhibited) [86].
4. Interpretation
- High % Inhibition: The test inhibitor is highly cross-reactive, as it effectively competes for IgE binding.
- Low % Inhibition: The test inhibitor has low cross-reactivity, meaning the IgE primarily recognizes unique epitopes on the immobilized allergen.
The following workflow diagram summarizes the logical steps of this experimental protocol and the subsequent troubleshooting process.
The Scientist's Toolkit: Key Research Reagent Solutions
Selecting the right reagents is critical for developing a sensitive and specific ELISA for detecting processed egg allergens and their cross-reactivity.
| Item | Function & Importance in Research | Technical Considerations |
|---|---|---|
| ELISA Microplates | Solid surface for immobilizing capture antibody or allergen [7]. | Use protein-binding ELISA plates, not tissue culture plates, for optimal adsorption [56] [6]. |
| Capture & Detection Antibodies | Form the core of the "sandwich" for specific antigen detection. | For cross-reactivity studies, ensure antibodies recognize stable, heat-resistant epitopes (e.g., ovomucoid) [86] [7]. |
| Protein Extraction Buffers | To prepare soluble protein extracts from raw and processed egg samples. | Phosphate-Buffered Saline (PBS) is commonly used for preparing crude egg white extracts [86]. |
| Blocking Buffers | To cover unsaturated binding sites on the plate to prevent non-specific antibody binding and reduce background [7] [14]. | Common blockers include BSA, casein, gelatin, or 5-10% serum. The choice can affect background and sensitivity. |
| Enzyme Conjugates & Substrates | Generate a measurable signal. Horseradish Peroxidase (HRP) is a common enzyme conjugate [7]. | Avoid sodium azide in buffers as it inhibits HRP activity. Use fresh substrate and stop solutions [14]. |
| Reference Allergen Standards | Used to generate a standard curve for quantifying target proteins in unknown samples. | Handle according to directions. Use a new vial if the standard is expired or degraded [56] [6]. |
Guidelines for AOAC and Other Regulatory Method Validation in Food Allergen Testing
FAQ: What are the key validation parameters required for ELISA methods in food allergen testing?
For an ELISA method to be considered valid for food allergen detection under regulatory and standard-setting body guidelines like those from AOAC INTERNATIONAL, it must meet specific performance criteria [87]. These parameters ensure the method is reliable, reproducible, and fit-for-purpose.
Core Validation Parameters [87]:
- Precision: This includes both intra-assay precision (repeatability within the same plate/run) and inter-assay precision (reproducibility between different runs, days, or operators). The coefficient of variation (% CV) for inter-assay precision is typically expected to be less than 10%.
- Accuracy and Recovery: This measures the closeness of the measured value to the true value. It is evaluated using samples spiked with a known amount of the target analyte. Recovery rates should fall within acceptable, predefined limits.
- Specificity and Cross-Reactivity: The assay must be able to detect the target allergen without interference from other matrix components or related proteins. This is confirmed by testing a panel of related substances.
- Sensitivity (LLOD) and Linearity/Range: The Lower Limit of Detection (LLOD) is the lowest amount of analyte that can be reliably distinguished from background. The assay range defines the concentrations between the upper and lower limits where the method provides accurate and precise results.
- Robustness and Stability: The method should remain unaffected by small, deliberate variations in procedural parameters (e.g., incubation times, temperature). Reagent stability over time is also a critical factor.
FAQ: Why is detecting egg allergens in heat-processed foods so challenging, and how can sensitivity be improved?
Heat processing poses a significant challenge for egg allergen detection due to protein denaturation [25]. During heating, egg-white proteins form disulphide-linked aggregates that are poorly soluble. This makes them difficult to extract and also alters the protein structures (epitopes) that antibodies recognize, leading to dramatically reduced detection (10 to 100-fold lower) or even false-negative results [88] [25].
Strategies to Improve Sensitivity in Processed Foods:
The primary solution involves optimizing the protein extraction buffer to break down these cross-linked aggregates [89] [88] [25].
- Use of Reducing Agents: Adding a reducing agent like 2-Mercaptoethanol (2-ME) cleaves disulphide bonds that hold protein aggregates together [88].
- Use of Surfactants: Adding a surfactant like Sodium Dodecyl Sulfate (SDS) helps to solubilize the denatured proteins by disrupting non-covalent bonds [88].
- Antibody Selection: Using an antibody that was developed specifically against the denatured or processed form of the allergen (e.g., an antibody raised against an antigen treated with SDS and 2-ME) can greatly improve immunoreactivity and, thus, detection sensitivity [88].
Table: Comparison of Key Commercial Egg ELISA Kits and Their Reported Performance Characteristics [40]
| Kit Brand | Measurand | Reported LOD (mg egg protein/kg) | Key Characteristic or Challenge |
|---|---|---|---|
| 3M | Egg White | 0.42 | Measures egg white protein; requires conversion factor (x2.0) for total egg protein. |
| Morinaga | Egg Protein | 0.31 | Specifically designed for better detection in processed foods [89]. |
| R-Biopharm | Whole Egg | 0.046 | Very low LOD, but also a relatively low upper limit of quantification (ULOQ). |
| Romer | Whole Egg | 0.24 | --- |
| Neogen | Whole Egg | 0.29 | --- |
| Biofront | Whole Egg | 0.14 | --- |
| ELISA Systems | Processed Egg | Not Indicated | Kit specifically designed for processed egg, using a specialized extraction buffer [25]. |
FAQ: How do matrix effects impact ELISA results, and which food matrices are most problematic?
Matrix effects refer to interference from the sample's components other than the target analyte, which can cause inaccurate quantification (either over- or under-estimation). Different food matrices can physically or chemically interfere with the antibody-antigen binding or the detection signal [40] [87].
Troubleshooting Matrix Effects:
- Dilution and Linearity: A primary check is to perform a dilution series of the sample extract. If the results are not linear and parallel to the standard curve, it indicates a matrix effect [87].
- Spike and Recovery Experiments: This is the definitive test. A known amount of the standard allergen is added (spiked) into the blank sample matrix, and the recovery percentage is calculated. Recovery outside the acceptable range (e.g., 80-120%) indicates interference [40] [87].
- Use of Matching Calibrants: The standard curve should be prepared in a matrix that mimics the sample as closely as possible (e.g., using an extract of a known blank matrix) to compensate for matrix effects [87].
Table: Egg Allergen Recovery Challenges Across Different Food Matrices (Based on a Multi-kit Evaluation Study) [40]
| Matrix Group | Recovery Performance Summary | Notes on Matrix Challenge |
|---|---|---|
| Cookie, Chocolate, Stock Cube, Wine | All 7 tested ELISA kits performed within set recovery criteria. | Considered less challenging matrices for egg detection. |
| Pasta, Vegetable Drink, Milk, Ice Cream, Salad Dressing | At least 4 of the 7 ELISA kits performed within set recovery criteria. | Moderately challenging; kit selection is important. |
| Meat/Meat Replacers | Only 1 of the 7 ELISA kits performed within set recovery criteria. | The most challenging matrix, showing high matrix effects that could not be easily explained by the blank. |
Experimental Protocol: Method for Optimized Protein Extraction from Processed Foods
This protocol is adapted from research focused on improving the recovery of egg allergens from heat-processed foods [88].
Objective: To efficiently extract denatured egg proteins from a processed food matrix (e.g., a baked cookie, pasta, or boiled egg) for subsequent ELISA analysis.
Reagents and Materials:
- Extraction Buffer: Phosphate-buffered saline or carbonate-bicarbonate buffer.
- Reducing Agent: 2-Mercaptoethanol (2-ME).
- Surfactant: Sodium Dodecyl Sulfate (SDS).
- Sample material (processed food).
- Centrifuge tubes, vortex mixer, centrifuge, water bath.
Procedure:
- Prepare Extraction Buffer: Create an extraction buffer containing 1% (w/v) SDS and 7% (v/v) 2-Mercaptoethanol [88].
- Homogenize Sample: Weigh 1 g of the finely ground food sample into a centrifuge tube.
- Extract Proteins: Add 10 mL of the prepared extraction buffer to the tube. Vortex vigorously to mix.
- Incubate with Heating: Place the tube in a water bath at 95-100°C for 10-15 minutes [88]. This step, combined with the SDS and 2-ME, is critical for solubilizing aggregated proteins.
- Cool and Centrifuge: Allow the tube to cool to room temperature. Centrifuge at 3,000 x g for 10-15 minutes to pellet insoluble debris.
- Collect Supernatant: Carefully collect the supernatant. This is the protein extract ready for analysis.
- Dilution for ELISA: The extract will contain SDS and 2-ME, which can interfere with some ELISA antibodies. You will likely need to dilute the extract (e.g., 1:10 to 1:100) in the ELISA kit's sample diluent or assay buffer before loading it onto the plate. The optimal dilution must be determined experimentally. Note: If using a kit specifically designed for processed foods (like some from Morinaga or ELISA Systems), follow the manufacturer's extraction protocol, as their antibodies may be optimized to work with these denaturing agents [89] [88] [25].
The Scientist's Toolkit: Key Research Reagent Solutions
Table: Essential Reagents and Materials for Food Allergen ELISA Validation and Troubleshooting
| Item | Function/Application |
|---|---|
| SDS (Sodium Dodecyl Sulfate) | Surfactant used in extraction buffers to solubilize denatured and aggregated proteins from processed foods [88]. |
| 2-Mercaptoethanol (2-ME) | Reducing agent that breaks disulphide bonds in protein aggregates, crucial for extracting allergens from heat-processed matrices [88]. |
| Reference Allergen Standards (e.g., NIST 8445) | Certified reference material (e.g., spray-dried whole egg) used for spiking experiments, calibration curves, and determining method accuracy and recovery [40]. |
| HRP (Horseradish Peroxidase) or AP (Alkaline Phosphatase) | Reporter enzymes conjugated to detection antibodies. They catalyze a reaction with a substrate to produce a measurable (e.g., colorimetric, chemiluminescent) signal [7]. |
| Blocking Buffer (e.g., BSA, Casein) | A protein solution (e.g., Bovine Serum Albumin) used to cover all unsaturated binding sites on the microplate well surface after coating, preventing non-specific binding of antibodies [7] [87]. |
| Cross-Adsorbed Secondary Antibodies | In sandwich ELISA, these are critical for ensuring the detection antibody does not bind to the capture antibody, which would cause high background and false positives. They are purified to remove any cross-reactivity [7]. |
Workflow: ELISA Assay Validation and Troubleshooting Pathway
The following diagram maps the logical process for validating an ELISA method and systematically troubleshooting common issues like low sensitivity.
Conclusion
Enhancing ELISA sensitivity for processed egg allergens requires a holistic approach that integrates a deep understanding of protein chemistry, meticulous assay optimization, and rigorous validation. Success hinges on selecting antibodies resistant to processing-induced epitope damage, systematically troubleshooting each assay component, and validating performance against real-world, complex matrices. The future of allergen detection lies in embracing novel technologies like synthetic biology for signal amplification and high-throughput automation to achieve the reproducibility and extreme sensitivity required for next-generation food safety and clinical diagnostics. By adopting the comprehensive strategies outlined herein, researchers can develop robust, highly sensitive ELISAs that reliably protect allergic consumers and advance public health.
References
- 1. ELISA Kit Troubleshooting [https://www.rockland.com/resources/ELISA-Kit-Troubleshooting/?srsltid=AfmBOortiEm0l3lHoMVCFFTaHXo8jiLGo7AHyci2LB5i8NHMOCZme9Wz]
- 2. ELISA Troubleshooting Guide [https://www.bio-techne.com/resources/protocols-troubleshooting/elisa-troubleshooting]
- 3. Comparison of commercial allergen ELISA kits for egg ... [https://www.sciencedirect.com/science/article/pii/S2405844023068950]
- 4. ELISA Tips: Troubleshooting Common Challenges - Blog [https://www.arp1.com/blog/post/elisa-kit-troubleshooting-tips.html]
- 5. What are Some Potential Errors that can Occur in an ELISA? [https://shop.surmodics.com/elisa-test-results-troubleshooting]
- 6. Troubleshooting Guide: ELISA [https://www.rndsystems.com/resources/troubleshooting-guide-elisa-development]
- 7. ELISA Assay Technique | Thermo Fisher Scientific - US [https://www.thermofisher.com/us/en/home/life-science/protein-biology/protein-biology-learning-center/protein-biology-resource-library/pierce-protein-methods/overview-elisa.html]
- 8. Epitope-Based IgE Assays and Their Role in Providing ... [https://www.sciencedirect.com/science/article/abs/pii/S2213219823007080]
- 9. A novel IgE epitope-specific antibodies-based sandwich ... [https://pmc.ncbi.nlm.nih.gov/articles/PMC10910080/]
- 10. ELISA Troubleshooting Guide [https://www.thermofisher.com/us/en/home/life-science/protein-biology/protein-biology-learning-center/protein-biology-resource-library/pierce-protein-methods/overview-elisa/elisa-troubleshooting-guide.html]
- 11. Impact of Heat and Pressure Processing Treatments on the ... [https://www.mdpi.com/2304-8158/13/22/3549]
- 12. Difficulty in obtaining signal for ELISA [https://www.abcam.com/en-us/technical-resources/troubleshooting/signal-problems-elisa]
- 13. Mapping epitopes and antigenicity by site-directed masking - PMC [https://pmc.ncbi.nlm.nih.gov/articles/PMC1482585/]
- 14. Elisa Troubleshooting | MyBioSource Learning Center [https://www.mybiosource.com/learn/elisa-troubleshooting/]
- 15. Conformation-stabilizing ELISA and cell-based assays reveal ... [https://pmc.ncbi.nlm.nih.gov/articles/PMC9630334/]
- 16. Epitope mapping and establishment of a blocking ELISA for ... [https://pmc.ncbi.nlm.nih.gov/articles/PMC11136834/]
- 17. Molecular characterization, B-cell linear epitopes ... [https://www.sciencedirect.com/science/article/abs/pii/S0141813025011845]
- 18. Epitope mapping of SARS-CoV-2 Spike protein using ... [https://www.nature.com/articles/s41598-025-00555-9]
- 19. Establishment of an I-ELISA method based on multi-epitope ... [https://journals.plos.org/plosntds/article?id=10.1371/journal.pntd.0012995]
- 20. A rapid approach for linear epitope vaccine profiling ... [https://www.nature.com/articles/s41598-025-92928-3]
- 21. Matrix Interference in Sandwich ELISA Kits [https://assaybiotechnology.com/site/matrix-interference]
- 22. What is Matrix Interference and How Does It Affect Testing? [https://www.arborassays.com/what-is-matrix-interference/?srsltid=AfmBOoqLlyz0zxF7o_TD7aqMXa1xF8KswlZZHc4OCI-YmgNWNiYjlZ8w]
- 23. Matrix Interference of Vegetable on Enzyme-Linked ... [https://www.mdpi.com/2304-8158/14/19/3414]
- 24. Matrix Interference of Vegetable on Enzyme-Linked ... [https://pmc.ncbi.nlm.nih.gov/articles/PMC12524109/]
- 25. Detecting egg allergens in heat-processed food [https://allergenbureau.net/detecting-egg-allergens-in-heat-processed-food-overcoming-the-challenges/]
- 26. Insights into effects of processing and food matrices on ... [https://www.sciencedirect.com/science/article/abs/pii/S0308814625009690]
- 27. ELISA Troubleshooting Guide | Thermo Fisher Scientific - AU [https://www.thermofisher.com/au/en/home/life-science/protein-biology/protein-biology-learning-center/protein-biology-resource-library/pierce-protein-methods/overview-elisa/elisa-troubleshooting-guide.html]
- 28. The Growing Importance of Allergen Testing: How Certified ... [https://fsns.com/the-growing-importance-of-allergen-testing-how-certified-group-ensures-food-safety-with-elisa/]
- 29. ELISA, Flow, Western: Choosing the Right Assay for Your ... [https://precisionantibody.com/elisa-flow-western-choosing-the-right-assay-for-your-antibody/]
- 30. Optimising Extraction of Specific Food Allergens from ... [https://pmc.ncbi.nlm.nih.gov/articles/PMC12563046/]
- 31. The principle and method of ELISA [https://www.mblbio.com/bio/g/support/method/elisa.html]
- 32. Secondary Antibodies coated surfaces | ELISA Assay - Biomat [https://www.biomat.it/surfaces/secondary-antibodies-coated-surfaces/]
- 33. The importance of antibody orientation for enhancing ... [https://pubs.rsc.org/en/content/articlehtml/2024/sd/d4sd00206g]
- 34. Oriented Surface Immobilization of Antibodies Using Enzyme ... [https://pmc.ncbi.nlm.nih.gov/articles/PMC12044683/]
- 35. Enhancing ELISA Sensitivity: From Surface Engineering to ... [https://www.mdpi.com/2079-6374/15/7/434]
- 36. The use of biotin–avidin binding to facilitate biomodification ... [https://www.sciencedirect.com/science/article/abs/pii/S0142961207006746]
- 37. How To Optimize Your ELISA Experiments [https://www.ptglab.com/news/blog/how-to-optimize-your-elisa-experiments/?srsltid=AfmBOoqf_frMsxYQF1xuqJgvTZVVeg36J9qAQV5VohwJwux_Y2CT6qoC]
- 38. 101 ELISA Troubleshooting Tips for Research in 2024 [https://www.assaygenie.com/101-elisa-troubleshooting-tips?srsltid=AfmBOoqB1h6GYny746nvAcUXqSZA-bFutBsUNel40NMvL4R06mmScrLL]
- 39. ELISA Guide; Part 3: ELISA Optimization [https://www.jacksonimmuno.com/secondary-antibody-resource/immuno-techniques/elisa-guide-part-3-elisa-optimization/]
- 40. Comparison of commercial allergen ELISA kits for egg ... [https://pmc.ncbi.nlm.nih.gov/articles/PMC10539936/]
- 41. Introduction to ELISA, Formats and Signal Amplification [https://www.jacksonimmuno.com/secondary-antibody-resource/immuno-techniques/elisa-guide-part-1/]
- 42. Enhancing ELISA Sensitivity: From Surface Engineering to ... [https://pmc.ncbi.nlm.nih.gov/articles/PMC12293621/]
- 43. ELISA Development and Optimization [https://www.thermofisher.com/us/en/home/life-science/protein-biology/protein-biology-learning-center/protein-biology-resource-library/pierce-protein-methods/overview-elisa/elisa-development-optimization.html]
- 44. Challenges in Allergen Testing and How to Overcome Them [https://www.romerlabs.com/en/library/webinars/detail/main-challenges-in-allergen-testing-and-how-to-overcome-them]
- 45. Improved Sensitivity of Allergen Detection by ... [https://pmc.ncbi.nlm.nih.gov/articles/PMC8700968/]
- 46. Advances in Food Processing Techniques for Allergenicity ... [https://pmc.ncbi.nlm.nih.gov/articles/PMC12651889/]
- 47. Optimizing your ELISA Assays [https://www.bmglabtech.com/en/blog/optimizing-your-elisa-assays/]
- 48. ELISA Antibody Concentration Optimization [https://www.bosterbio.com/protocol-and-troubleshooting/picokine-elisa-optimization/antibody-concentration?srsltid=AfmBOoqoHTaDt8bH8WoxHkBjQEhvEHfT5ylLQzqyjmo7n1HvBa1y3ms5]
- 49. Optimize ELISA Assays with Checkerboard Titration ... [https://www.bosterbio.com/blog/post/how-to-use-checkerboard-titration-to-optimize-your-elisa-immunoassays?srsltid=AfmBOorc8n_OU4MB372Isyjctc7daKduGN7MS7oI6UZefk5mfYFHNCr2]
- 50. Why are Sensitivity and Specificity Important Parameters ... [https://www.enzo.com/note/why-are-sensitivity-and-specificity-important-parameters-for-an-elisa/]
- 51. ELISA Troubleshooting: Low Signal or No Detection [https://protocolsandsolutions.com/blogs/elisa-protocols/elisa-troubleshooting-low-signal-or-no-detection]
- 52. Effectiveness of natural and synthetic blocking reagents ... [https://pubmed.ncbi.nlm.nih.gov/19247640/]
- 53. Validated cost-effective casein-based blocking buffers for ... [https://www.sciencedirect.com/science/article/abs/pii/S0732889325003566]
- 54. Non-Specific Binding and Cross-Reaction of ELISA [https://pmc.ncbi.nlm.nih.gov/articles/PMC8394222/]
- 55. How To Optimize Your ELISA Experiments [https://www.ptglab.com/news/blog/how-to-optimize-your-elisa-experiments/?srsltid=AfmBOoogHXXmht36z_bDs1wy0hUmnTVB17vKavvkr3f_7GCk5sImdFj6]
- 56. Technical Support | ELISA Troubleshooting Guide [https://krishgen.com/support-resources/]
- 57. UK FSA's review of main allergen detection methods [https://allergenbureau.net/uk-fsas-review-of-main-allergen-detection-methods/]
- 58. Validation of Elisa protocol as per FDA Regulation for Drug ... [https://www.mybiosource.com/learn/validation-of-elisa-protocol-as-per-fda-regulation-for-drug-developmen/]
- 59. Optimizing the ELISA (Enzyme-Linked Immunosorbent ... [https://www.cellsignal.com/applications/elisa/optimizing-elisa-test?srsltid=AfmBOorpeAB7J3q5pY0QnAi7Y_K7VhLbZUQyykyDgxktSwH7Iu26us8y]
- 60. Lipid matrix-specific pretreatment method for enhancing ... [https://www.sciencedirect.com/science/article/abs/pii/S0308814624011129]
- 61. Food Allergenicity Evaluation Methods: Classification, ... [https://pmc.ncbi.nlm.nih.gov/articles/PMC12191692/]
- 62. A Highly Sensitive Indirect Enzyme-Linked Immunosorbent ... [https://pmc.ncbi.nlm.nih.gov/articles/PMC10636219/]
- 63. ELISA Troubleshooting Guide [https://www.thermofisher.com/ru/en/home/life-science/protein-biology/protein-biology-learning-center/protein-biology-resource-library/pierce-protein-methods/overview-elisa/elisa-troubleshooting-guide.html]
- 64. ELISA Troubleshooting [https://www.antibodies.com/applications/elisa/elisa-troubleshooting]
- 65. Factors Affecting Signal Generation in ELISA [https://www.thermofisher.com/us/en/home/life-science/protein-biology/protein-biology-learning-center/protein-biology-resource-library/pierce-protein-methods/overview-elisa/factors-affecting-ELISA-signal.html]
- 66. Review of allergen analytical testing methodologies [https://www.food.gov.uk/research/review-of-allergen-analytical-testing-methodologies-allergen-testing-workflows-to-support-incident-management]
- 67. Liquid Handling for Reproducible Science Post 1: Basics of ... [https://formulatrix.com/life-science-automation-blog/liquid-handling-for-reproducible-science-post-1-basics-of-accuracy-and-precision/]
- 68. Automated Liquid Handlers As Sources of Error [https://www.bioprocessintl.com/assays/automated-liquid-handlers-as-sources-of-error]
- 69. Automated Liquid Handlers as Sources of Error [https://www.aicompanies.com/education-training/knowledge-center/automated-liquid-handlers-as-sources-of-error/]
- 70. Next-Generation ELISA (ELISA 2.0) Market Research ... [https://www.insightaceanalytic.com/report/next-generation-elisa-market/3241]
- 71. Dilutional Linearity, Parallelism, Spike-and-Recovery in ... [https://www.enzo.com/note/dilutional-linearity-parallelism-spike-and-recovery-in-elisa-how-to-qc-your-results/]
- 72. Spike and Recovery and Linearity of Dilution Assessment [https://www.thermofisher.com/us/en/home/life-science/protein-biology/protein-biology-learning-center/protein-biology-resource-library/pierce-protein-methods/overview-elisa/spike-recovery-linearity-assessment.html]
- 73. Spike and Recovery: How to Generate Reliable Data [https://www.cygnustechnologies.com/generating-spike-recovery-analysis-data?srsltid=AfmBOoplIs9kP_kOgKn1xrgwk1Wg7Y1Pi_ZiSBspWXfvqlI_JtZuBaFL]
- 74. Troubleshooting & FAQs [https://www.cygnustechnologies.com/resources/guidelines?srsltid=AfmBOoqEZslYzHFjVYrkTk3O2bVLlznXo9aX1zpmWffvgCTSZ1Khb0A4]
- 75. Troubleshooting of Sandwich ELISA with Direct Detection [https://www.antibody-creativebiolabs.com/troubleshooting-of-sandwich-elisa-with-direct-detection.htm]
- 76. Enzyme Linked Immunosorbent Assay - StatPearls - NCBI - NIH [https://www.ncbi.nlm.nih.gov/books/NBK555922/]
- 77. Limit of Blank, Limit of Detection and Limit of Quantitation [https://pmc.ncbi.nlm.nih.gov/articles/PMC2556583/]
- 78. An Explanation of Sensitivity and the LLD, LLOQ, and ... [https://www.quansysbio.com/support/explanation-of-sensitivity-lld-lloq-and-uloq/]
- 79. Approaches to Assay Characterization and Validation: Part 1 [https://www.quanterix.com/approaches-to-assay-characterization-and-validation-part-1-limit-of-detection-and-lower-limit-of-quantitation/]
- 80. A Practical Guide to Immunoassay Method Validation - PMC [https://pmc.ncbi.nlm.nih.gov/articles/PMC4541289/]
- 81. ELISA Kit Troubleshooting [https://www.rockland.com/resources/ELISA-Kit-Troubleshooting/?srsltid=AfmBOorjVl-3EwvS9XzBE7V-Qg1MTDenwK6XbCinJeGxgkD8014BAU8Z]
- 82. InviLisa® Egg ELISA Kit [https://www.invitek.com/en/food-allergens/elisa/pdp-egg-elisa]
- 83. Tracking a Major Egg Allergen to Assess Commercial Food ... [https://pmc.ncbi.nlm.nih.gov/articles/PMC9776010/]
- 84. Elisa Troubleshooting -Technical Issues | Surmodis [https://shop.surmodics.com/elisa-troubleshooting-guide]
- 85. Troubleshooting Common ELISA Kit Problems: A Lab ... [https://synapse.patsnap.com/article/troubleshooting-common-elisa-kit-problems-a-lab-technicians-guide]
- 86. A Preliminary Study on Cross-Reactivity of Heat-Treated ... [https://pmc.ncbi.nlm.nih.gov/articles/PMC8308246/]
- 87. ELISA Assay Validation: Best Practices, Methods, and Key ... [https://www.nebiolab.com/elisa-assay-validation-guide/]
- 88. Novel ELISA for the detection of raw and processed egg ... [https://www.sciencedirect.com/science/article/abs/pii/S0022175905000827]
- 89. Improved Allergen Detection in Processed Food [https://www.eurofins.de/food-analysis/food-news/food-testing-news/improved-allergen-detection-in-processed-food/]