Next-Generation Biosensors for Rapid On-Site Allergen Detection: From Nanozymes to AI-Driven Platforms
The global surge in food allergies necessitates the development of rapid, sensitive, and on-site detection systems to ensure food safety and protect consumers.
Next-Generation Biosensors for Rapid On-Site Allergen Detection: From Nanozymes to AI-Driven Platforms
Abstract
The global surge in food allergies necessitates the development of rapid, sensitive, and on-site detection systems to ensure food safety and protect consumers. This article explores the implementation of advanced biosensor systems for allergen detection, moving beyond traditional techniques like ELISA and PCR. We cover the foundational principles of biosensor mechanisms, including electrochemical, optical, and piezoelectric transducers. The review details cutting-edge methodological advances such as nanozyme-based signal amplification, isothermal amplification techniques (e.g., LAMP), and multiplexed platforms for simultaneous detection of key allergens (e.g., Ara h proteins in peanut, Bos d 5 in milk). Furthermore, it addresses critical troubleshooting and optimization strategies, focusing on interfacial chemistry, surface functionalization, and the mitigation of nonspecific binding in complex food matrices. Finally, we provide a comparative analysis of emerging technologies, including AI-enhanced biosensor design and hyperspectral imaging, against conventional methods, evaluating their validation pathways, limits of detection, and scalability for point-of-care use. This comprehensive overview is tailored for researchers, scientists, and drug development professionals working at the intersection of food safety, biosensing, and clinical diagnostics.
The Urgent Need and Fundamental Principles of Allergen-Detecting Biosensors
Food allergy has emerged as a critical global public health issue, affecting millions of individuals worldwide and presenting complex challenges for healthcare systems, food industries, and allergic individuals themselves [1]. The condition represents an immune-mediated reaction to specific food proteins, ranging from mild discomfort to life-threatening anaphylaxis [2]. With no curative treatments currently available, the cornerstone of management remains strict avoidance of allergenic foods, making accurate detection and labeling paramount for patient safety [3] [4].
Recent epidemiological data reveals a disturbing upward trend in food allergy prevalence across many regions, compounding the urgency of addressing current diagnostic limitations [5] [1]. Conventional allergen detection methods, while valuable, often require centralized laboratory facilities, trained personnel, and considerable time—creating significant gaps between exposure and risk identification [4] [6]. These challenges are particularly acute in everyday dining settings and food manufacturing facilities where cross-contamination risks persist.
The emergence of biosensor technologies represents a promising frontier in bridging these diagnostic gaps. These systems offer the potential for rapid, sensitive, on-site detection that can empower both consumers and food industry stakeholders to make informed safety decisions [3] [7]. This application note explores the current landscape of food allergy diagnostics within the context of implementing advanced biosensor systems, with particular focus on technical methodologies, reagent solutions, and experimental protocols that can enhance detection capabilities.
Global Epidemiology and Current Diagnostic Landscape
The Rising Global Burden
Food allergy prevalence demonstrates significant geographical variation, with recent studies indicating concerning rates across multiple countries. A comprehensive investigation of 46,572 children and 44,835 adults published by Elsevier in 2023 revealed particularly high rates in China, where 8.71% of children and 8.14% of adults report food allergies [5]. Similar patterns emerge in North America, with Canada reporting 7.35% prevalence in children and the United States at 4.32% in children (though 6.3% in adults) [5]. Globally, approximately 4.3% of the population is affected, with regional variations ranging from 7.6% in US children to 0.61% in Brazil [1].
The most prevalent allergens include peanuts, milk, eggs, fish, shellfish, wheat, soy, and sesame, with peanut and tree nut allergies often persisting into adulthood [1]. Interestingly, allergen patterns vary by region, with shrimp representing the most prevalent allergen in China compared to peanuts, milk, and eggs in other countries [5]. This epidemiological landscape underscores the need for versatile detection systems capable of identifying multiple allergen targets across diverse food matrices.
Table 1: Global Food Allergy Prevalence Data
| Country | Food Allergy Prevalence in Children (%) | Food Allergy Prevalence in Adults (%) | Most Prevalent Allergens |
|---|---|---|---|
| China | 8.71 | 8.14 | Shrimp |
| Canada | 7.35 | 5.36 | Peanuts, milk, eggs |
| Spain | 5.23 | 4.65 | Peanuts, milk, eggs |
| United States | 4.32 | 6.30 | Peanuts, milk, eggs |
| United Kingdom | 4.27 | 4.63 | Peanuts, milk, eggs |
| Japan | 3.90 | 2.10 | Peanuts, milk, eggs |
| France | 3.61 | 2.98 | Peanuts, milk, eggs |
| Italy | 3.04 | 6.59 | Peanuts, milk, eggs |
| Germany | 2.35 | 2.40 | Peanuts, milk, eggs |
Conventional Detection Methods and Limitations
Current allergen detection methodologies primarily encompass protein-based immunoassays, nucleic acid-based techniques, and emerging biosensor platforms [4]. Each approach presents distinct advantages and limitations for various application scenarios:
Table 2: Comparison of Food Allergen Detection Methods
| Method Type | Examples | Detection Limit | Time Required | Key Advantages | Major Limitations |
|---|---|---|---|---|---|
| Immunoassays | ELISA, Lateral Flow Immunoassay (LFIA) | ~0.1-5 ppm | 1-3 hours | High sensitivity and specificity; standardized protocols | Susceptible to protein denaturation from processing; requires specific antibodies |
| Nucleic Acid-Based | PCR, Real-time PCR, LAMP | ~1-10 ppm | 1-2 hours | Effective for processed foods; DNA more stable than proteins | Indirect detection; does not correlate directly with allergenicity |
| Mass Spectrometry | LC-MS/MS | ~1-10 ppm | Several hours | High specificity and multiplexing capability | Expensive equipment; requires skilled operators |
| Biosensors | Electrochemical, Optical, Nanomaterial-based | ~0.1-1 ppm | 15-30 minutes | Rapid; potential for on-site use; high sensitivity | Still evolving; standardization challenges |
Enzyme-linked immunosorbent assay (ELISA) remains the gold standard for quantitative allergen detection due to its high sensitivity, specificity, and potential for standardization [4]. The Codex Alimentarius Commission has formally adopted ELISA for gluten detection, establishing a threshold of 20 mg/kg for "gluten-free" labeling [4]. Similarly, polymerase chain reaction (PCR) methods are valued for detecting allergens in highly processed foods where DNA remains stable despite protein structural denaturation [4]. Germany and Japan have incorporated PCR into official testing methodologies, with Japan setting an allergen threshold of 10 μg/g [4].
However, these conventional methods face significant limitations for on-site application. ELISA requires specialized laboratory equipment, trained personnel, and considerable time (up to 3.5 hours), creating delays in obtaining results [6]. Similarly, PCR demands DNA extraction, amplification, and detection instrumentation ill-suited for field deployment [4]. These limitations highlight the critical need for rapid, portable, and user-friendly detection systems that can provide accurate results in real-world settings.
Biosensing Technologies: Principles and Implementation
Electrochemical Biosensing Systems
Electrochemical biosensors represent a promising technological approach for allergen detection, leveraging signal amplification through redox-active reporters to achieve high sensitivity in compact, low-power devices [3]. The iEAT2 (integrated Exogenous Allergen Test 2) system exemplifies recent advancements in this category, featuring technical breakthroughs including a complete sample processing kit and a novel strategy for multi-electrode measurements enabling simultaneous detection of multiple allergens [3] [7].
This system employs an immunomagnetic approach for allergen retrieval, streamlining sample handling. The assay workflow begins with food matrix disruption in allergen-extraction buffer, followed by mixing with immunomagnetic beads that capture target allergens [3]. Beads are collected via permanent magnet and incubated with detection antibodies conjugated with horseradish peroxidase (HRP), after which an electrochemical readout occurs using a redox-active reporter [3]. The entire protocol completes within 15 minutes—significantly faster than conventional ELISA—and detects allergens at concentrations below established allergic reaction thresholds [3].
A key innovation in the iEAT2 system is its parallel array of two-terminal electrochemical cells, each functioning as an independent current source [3]. This design significantly simplifies electronics and electrical connections compared to conventional three-electrode schemes, enabling scalable multiplexed detection in a compact form factor. Experimental validation confirmed independent electrochemical measurements during simultaneous operation, demonstrating robust performance for detecting gliadin (wheat), Ara h1 (peanut), and ovalbumin (egg white) in real-world food samples [3].
Optical and Microfluidic Platforms
Optical biosensors based on absorption, fluorescence, and surface plasmon resonance (SPR) have emerged as powerful alternatives for food allergen analysis [6]. SPR technology detects binding events between immobilized antibodies and allergens in samples through changes in the refractive index at the sensor chip surface [6]. While SPR systems offer advantages including real-time results, automation, and high surface sensitivity, their implementation has been limited by relatively high costs associated with sophisticated optical components and sensor chips [6].
Microfluidics technology integrated with biosensing platforms addresses several limitations of conventional systems by enabling faster reaction times, reduced sample consumption (5-10 μL versus hundreds in commercial ELISA kits), and enhanced sensitivity through short diffusion distances and high surface tension [6]. A microfluidic ELISA platform combined with a custom optical sensor demonstrated quantitative analysis of wheat gluten and Ara h 1 with assay times reduced to 15-20 minutes compared to 3.5 hours for conventional ELISA [6]. This substantial reduction in analysis time, coupled with minimal reagent requirements, positions microfluidic systems as promising platforms for decentralized allergen testing.
Research Reagent Solutions for Allergen Detection
Successful implementation of biosensor systems for allergen detection requires carefully selected research reagents and materials tailored to specific detection methodologies. The following table outlines essential components for developing and deploying these detection platforms:
Table 3: Essential Research Reagents for Allergen Biosensing
| Reagent Category | Specific Examples | Function in Detection System | Application Notes |
|---|---|---|---|
| Immunomagnetic Beads | Dynabeads M-270 Epoxy | Capture and concentrate target allergens from food matrices | Enable sample purification and concentration; 6.7×10^7 beads/mg capacity [3] |
| Detection Antibodies | HRP-conjugated anti-gliadin, biotinylated 2F7 for Ara h 1 | Specific recognition and binding to target allergens | Require validation for specificity and cross-reactivity; conjugation with enzymes for signal generation [3] [6] |
| ELISA Components | Anti-gliadin 14D5, monoclonal 2C12, TMB substrate | Conventional reference method; component in biosensor systems | TMB substrate provides colorimetric/electrochemical signal upon enzymatic reaction [6] |
| Extraction Buffers | Food allergen ELISA kit extraction buffer | Efficient recovery of allergens from complex food matrices | Composition critical for maintaining protein structure and epitope recognition [3] |
| Blocking Agents | Bovine Serum Albumin (BSA) | Reduce non-specific binding in immunoassays | Improve signal-to-noise ratio; concentration optimization required [3] |
| Microfluidic Materials | PDMS (Polydimethylsiloxane) | Fabrication of microfluidic channels and reaction chambers | Biocompatible; gas permeable; suitable for soft lithography [6] |
Experimental Protocols
Protocol for iEAT2 Electrochemical Detection
Principle: This protocol describes the simultaneous detection of multiple food allergens (gliadin, Ara h 1, ovalbumin) using the iEAT2 electrochemical sensing system based on an immunomagnetic detection approach [3].
Materials Required:
- iEAT2 device with 16-electrode array
- Torsion device for food grinding
- Immunomagnetic beads (Dynabeads M-270 Epoxy)
- Allergen-specific detection antibodies (HRP-conjugated)
- Extraction buffer (Food allergen ELISA kit, Morinaga Institute)
- TMB substrate solution
- Permanent magnet for bead collection
- Ultrapure water
Procedure:
- Sample Preparation:
- Grind 0.5 g food sample using torsion device
- Add 9.5 mL extraction buffer and vortex for 30 seconds
- Incubate in boiling water bath for 10 minutes, then cool under running water
- Centrifuge at 3000× g for 20 minutes at room temperature
- Filter supernatant through 0.2 μm membrane syringe filter
Immunomagnetic Capture:
- Mix 100 μL food extract with 50 μL immunomagnetic beads
- Incubate with agitation for 5 minutes at room temperature
- Collect beads using permanent magnet, discard supernatant
- Wash beads twice with 200 μL PBS-Tween buffer
Detection Antibody Incubation:
- Resuspend beads in 50 μL HRP-conjugated detection antibody solution
- Incubate for 5 minutes with agitation
- Collect beads with magnet, discard supernatant
- Wash three times with 200 μL PBS-Tween buffer
Electrochemical Measurement:
- Transfer beads to iEAT2 electrode array
- Add 50 μL TMB substrate solution
- Apply potential and measure current simultaneously across all 16 electrodes
- Record electrochemical signals at 2-minute intervals for 10 minutes
Data Analysis:
- Plot current versus time for each electrode
- Calculate allergen concentration from standard curves
- Apply correction factors for matrix effects when necessary
Validation:
- System detects allergens below established allergic reaction thresholds
- Complete protocol time: 15 minutes from extraction to detection
- Effective identification of cross-contamination in real-world samples [3]
Protocol for Microfluidic ELISA-Based Optical Detection
Principle: This protocol describes the quantitative detection of gluten and Ara h 1 allergens using a microfluidic ELISA platform integrated with an optical sensor, reducing assay time and reagent consumption compared to conventional ELISA [6].
Materials Required:
- PDMS microfluidic chip with four inlets and one outlet
- Gluten (Gliadin) ELISA Kit or Ara h 1 ELISA Kit
- Anti-gliadin antibody 14D5 (for gluten detection)
- HRP-conjugated rabbit anti-gliadin polyclonal antibody
- Monoclonal antibody 2C12 and biotinylated antibody 2F7 (for Ara h 1 detection)
- TMB substrate
- Microfluidic syringe pump or manual dispensing system
- Custom optical sensor setup
Procedure:
- Chip Preparation:
- Fabricate microfluidic chip using standard photolithography and soft lithography
- Create master mold with 80 μm UV-cured SU-8 2025 negative photoresist
- Prepare PDMS chips from master mold
- Functionalize detection chambers with capture antibodies (1 μg/mL in PBS, overnight at 4°C)
Sample Preparation:
- Follow sample preparation steps as in Section 5.1, steps 1-2
- Prepare serial dilutions of extracted samples in PBS
On-Chip Immunoassay:
- Load 5 μL sample solution through inlet port
- Incubate for 5 minutes to allow allergen-antibody binding
- Wash with 10 μL PBS buffer
- Load 5 μL HRP-conjugated detection antibody solution
- Incubate for 5 minutes
- Wash with 10 μL PBS buffer
- Load 5 μL TMB substrate solution
Optical Detection:
- Monitor color development using custom optical sensor
- Measure absorbance at 650 nm at 30-second intervals
- Generate standard curves using known allergen concentrations
- Calculate unknown concentrations from standard curve
Chip Regeneration:
- Flush with glycine-HCl buffer (pH 2.5) to remove bound complexes
- Re-equilibrate with PBS buffer before next use
Validation:
- Assay time: 15-20 minutes (versus 3.5 hours for conventional ELISA)
- Sample/reagent consumption: 5-10 μL (versus hundreds of μL in commercial kits)
- Sensitivity comparable to conventional ELISA with quantitative capability [6]
Future Perspectives and Research Directions
The field of allergen detection continues to evolve rapidly, with several promising research directions emerging. Molecular allergen component testing represents a significant advancement, enabling clinicians to identify specific allergen components and enhance diagnostic precision for personalized immunotherapy approaches [8]. Similarly, the integration of automation and artificial intelligence is revolutionizing allergy diagnostics workflows through automated immunoassay analyzers and AI-assisted data interpretation that reduce manual errors and enhance laboratory productivity [8].
Critical research gaps identified by EFSA's Panel on Genetically Modified Organisms include the need to update in silico tools with targeted databases, better integrate and standardize test materials, and clarify the weight-of-evidence approach for protein safety assessment [9]. Future biosensor development must also address clinical relevance determination through fit-for-purpose databases where allergens are ranked according to clinical significance [9]. Additionally, the influence of food processing on allergen detection requires greater consideration, as industrial processes may denature proteins, generate new antigenic epitopes, or affect antibody recognition [9] [4].
The growing focus on pediatric allergy management underscores the need for diagnostic systems capable of early detection and prevention strategies [8]. Future biosensor platforms should incorporate pediatric-focused testing panels and child-specific allergens to address this vulnerable population's needs. Furthermore, the development of standardized reference materials and validation protocols will be essential for ensuring reliability and comparability across different detection platforms and geographical regions.
As biosensor technologies mature, their integration into food safety management systems will become increasingly seamless, enabling real-time monitoring of production lines and rapid response to contamination events. The convergence of biosensing with digital health platforms may further empower consumers through connected detection systems that provide immediate feedback and documentation of allergen safety. These advancements collectively promise to transform the management of food allergies from reactive avoidance to proactive risk mitigation, ultimately reducing the global burden of this significant public health challenge.
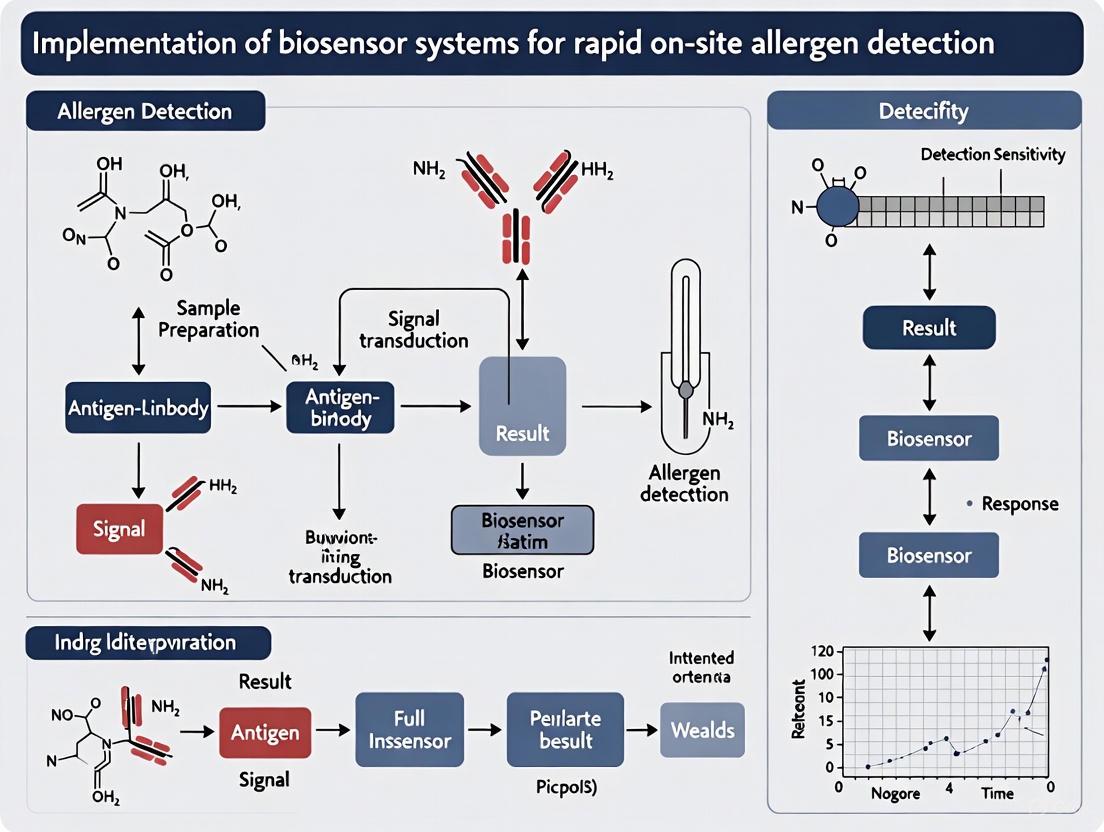
A biosensor is an analytical device that combines a biological recognition element with a transducer to produce a measurable signal proportional to the concentration of a specific analyte [10] [11]. In the context of rapid on-site allergen detection, biosensors offer the exceptional selectivity, sensitivity, and portability required for real-world food safety applications [3] [12]. The fundamental operation involves a bio-recognition event, where a bioreceptor selectively interacts with the target allergen, followed by signal transduction, where this biological interaction is converted into a quantifiable output [10] [13]. The efficient collaboration of these components enables researchers and developers to create powerful diagnostic tools that can be deployed at the point-of-care.
Core Components of a Biosensor
The analytical power of a biosensor stems from the integrated function of its three core components: the bioreceptor, the transducer, and the readout system. The sequential operation of these components transforms a specific biological binding event into an interpretable result.
Bioreceptors: The Molecular Recognition Elements
Bioreceptors are the source of a biosensor's selectivity. They are biological or biomimetic molecules immobilized on the sensor surface that specifically bind to the target analyte [10] [11]. The choice of bioreceptor is paramount, as it determines the specificity and robustness of the detection system, especially critical for distinguishing specific allergenic proteins in complex food matrices [14].
- Antibodies: These proteins generated by the immune system bind to specific epitopes on a target antigen with high affinity. Immunosensors utilize this very specific binding for detection [11]. For instance, a biosensor for the egg allergen ovomucoid (OVM) or peanut allergen Ara h1 would employ anti-OVM or anti-Ara h1 antibodies, respectively [3] [12].
- Enzymes: Enzyme-based biosensors rely on the catalytic activity of enzymes to convert a substrate into a detectable product. The analyte (e.g., an allergen) can be the enzyme's substrate, an inhibitor, or a modulator of its activity [14] [11]. The consumption of a reactant or generation of a product during the reaction is what gets measured.
- Nucleic Acids (Aptamers): Aptamers are single-stranded DNA or RNA oligonucleotides that fold into specific three-dimensional structures capable of binding to a target molecule (e.g., a protein allergen) with high affinity and specificity, similar to antibodies. Their synthetic nature and stability make them attractive alternatives to antibodies in biosensing [11].
- Whole Cells and Tissues: Living microorganisms, organelles, or plant/animal tissues can serve as bioreceptors. They are often used to monitor global parameters like toxicity or stress conditions [11].
The following diagram illustrates the logical workflow of a biosensor, from sample introduction to final readout, highlighting the role of each core component.
Transducers: Converting Biological Events into Signals
The transducer is the component that converts the biological recognition event into a measurable signal [10] [13]. The nature of this signal defines the primary classification of biosensors and is a key determinant of their sensitivity and suitability for on-site applications.
- Electrochemical Transducers: These are among the most common and successfully commercialized transducers [13]. They detect electrical changes arising from the bio-recognition event.
- Amperometric: Measures current generated by a redox reaction at a constant applied voltage [10] [3]. The iEAT2 system for allergen detection is a prominent example, where an immunomagnetic assay generates an enzymatic product that is electrochemically oxidized, producing a current [3].
- Potentiometric: Measures the change in potential (voltage) at an electrode surface when the bioreaction occurs [10].
- Impedimetric: Measures the change in electrical impedance (resistance to current flow) of the sensor surface, often used for label-free detection of bacterial cells or proteins [15].
- Optical Transducers: These transducers monitor changes in the properties of light.
- Surface Plasmon Resonance (SPR): Detects changes in the refractive index on a sensor surface, which occurs when molecules bind, allowing for real-time, label-free monitoring [10].
- Colorimetric: Detects visible color changes, often enhanced by nanoparticles. The plasmonic biosensor for ovomucoid uses silver nanodome arrays that exhibit visible color shifts upon target binding, enabling spectrometer-free detection [12].
- Fluorometric: Measures the emission of light from fluorescent labels or quantum dots upon excitation. Fluorescence-based biosensors are prized for their high sensitivity [16].
- Mass-Sensitive Transducers: These include piezoelectric devices like quartz crystal microbalances (QCM), which detect the change in resonant frequency of a crystal when mass is adsorbed onto its surface [10] [14].
Table 1: Comparison of Common Biosensor Transducer Types
| Transducer Type | Measured Quantity | Advantages | Limitations |
|---|---|---|---|
| Amperometric | Electric Current | High sensitivity, well-established, portable | Often requires labels or mediators |
| Potentiometric | Potential (Voltage) | Simple instrumentation, wide detection range | Slower response, susceptible to ionic interference |
| Impedimetric | Impedance | Label-free, real-time monitoring, studies binding kinetics | Complex data interpretation, can be non-specific |
| SPR | Refractive Index | Label-free, real-time, high sensitivity | Expensive instrumentation, bulkier systems |
| Colorimetric | Light Absorbance/Color | Simple, low-cost, visible readout (e.g., smartphone) | Can be less sensitive, susceptible to sample turbidity |
| Fluorometric | Fluorescence Intensity | Extremely high sensitivity, multiplexing capability | Requires fluorescent labels, photobleaching possible |
Electronics and Readout: The User Interface
The electronics and display unit form the final component of the biosensor, processing the transduced signal and presenting it in a user-friendly format [10]. This stage involves complex electronic circuitry that performs signal conditioning—such as amplification, filtering, and conversion from analog to digital form [10] [13]. The final readout can be numeric, graphic, or tabular, displayed on a screen, printed, or transmitted wirelessly [10]. For on-site allergen detectors like the iEAT2, the readout is a compact, portable device that quantifies the allergen concentration, often within minutes [3].
Advanced Topic: Experimental Design for Biosensor Optimization
Developing a high-performance biosensor requires systematic optimization of numerous parameters, such as bioreceptor immobilization density, incubation times, and transducer surface chemistry. The traditional "one-variable-at-a-time" approach is inefficient and can miss interactions between variables. Design of Experiments (DoE) is a powerful chemometric tool that addresses this challenge by systematically exploring the entire experimental domain with a minimal number of runs [17].
DoE involves identifying key factors (e.g., pH, temperature, concentration), defining their experimental ranges, and conducting a predetermined set of experiments. The data is then used to build a mathematical model that relates the experimental conditions (inputs) to the sensor's performance (output, e.g., signal intensity). This model can identify not only the individual effect of each factor but also their interaction effects, which are often crucial but overlooked in univariate optimization [17]. For instance, a 2k factorial design is an efficient first-order design to screen for significant factors, while a central composite design can be used to model curvature and find a true optimum [17]. Applying DoE accelerates the development of robust and reliable biosensors for clinical and point-of-care diagnostics.
Application Note: Protocol for Rapid Electrochemical Allergen Detection
This protocol is adapted from the iEAT2 system and related biosensing literature for the simultaneous detection of major food allergens (e.g., gliadin from wheat, Ara h1 from peanut, ovalbumin from egg) [3] [12].
Principle: Target allergens are extracted from a food sample and captured by antibody-conjugated magnetic beads. The bead-allergen complex is then incubated with a secondary antibody conjugated to the enzyme Horseradish Peroxidase (HRP). Upon addition of an electrochemical substrate (e.g., TMB), HRP catalyzes a redox reaction. The resulting current, measured amperometrically, is proportional to the allergen concentration.
Research Reagent Solutions
Table 2: Essential Reagents for Electrochemical Allergen Immunoassay
| Reagent / Material | Function / Role in the Assay |
|---|---|
| Immunomagnetic Beads | Solid support for immobilizing capture antibodies; enable magnetic separation and concentration of the target allergen from the food matrix. |
| Allergen-Specific Antibodies | Bioreceptors that provide high specificity for the target allergen (e.g., anti-gliadin, anti-Ara h1). |
| HRP-Conjugated Detection Antibodies | Generate the measurable signal; bind to the captured allergen and catalyze the electrochemical reaction. |
| Tetramethylbenzidine (TMB) Substrate | An enzymatic substrate for HRP; its oxidized form is electrochemically active and produces a measurable current. |
| Allergen Extraction Buffer | A solution designed to efficiently release allergenic proteins from various food matrices while maintaining their immunoreactivity. |
| Blocking Buffer (e.g., BSA) | Blocks non-specific binding sites on the sensor surface or magnetic beads to reduce background noise and improve signal-to-noise ratio. |
Step-by-Step Workflow
The following diagram outlines the detailed experimental workflow for the electrochemical detection of allergens.
Procedure:
- Sample Preparation: Weigh 1 g of homogenized food sample. Add 10 mL of extraction buffer and vortex vigorously for 5 minutes. Centrifuge at 5,000 g for 5 min to pellet debris. Collect the supernatant containing the soluble allergens [3].
- Immunomagnetic Capture: Incubate 1 mL of the food extract with 100 µL of antibody-conjugated magnetic beads for 10 minutes with constant agitation. This allows the target allergens to bind specifically to the beads.
- Magnetic Separation and Washing: Place the tube on a magnetic rack for 2 minutes to separate the beads from the solution. Carefully aspirate and discard the supernatant. Wash the bead complex twice with 1 mL of wash buffer (e.g., PBS with 0.05% Tween 20) to remove unbound substances.
- Enzyme Labeling: Incubate the washed beads with 100 µL of HRP-conjugated detection antibody for 5 minutes. Perform another magnetic separation and two wash steps to remove unbound detection antibodies.
- Electrochemical Measurement: Resuspend the final bead complex in 200 µL of electrochemical measurement cell containing TMB substrate. Immediately place the cell into the potentiostat and apply a defined reducing potential (e.g., -0.1 V vs. Ag/AgCl). Measure the resulting current.
- Data Analysis: The measured current is proportional to the allergen concentration. Quantify the allergen content by comparing the signal to a standard curve generated with known concentrations of purified allergen.
Performance Metrics
The iEAT2 prototype demonstrated a complete testing protocol within 15 minutes, from allergen extraction to detection, with sensitivities below established allergic reaction thresholds [3]. The system utilized a 16-electrode array for simultaneous detection of multiple allergens, showcasing the scalability of this electrochemical approach.
The deconstruction of a biosensor into its fundamental components—bioreceptor, transducer, and readout—provides a clear framework for research and development in the field of rapid on-site diagnostics. The strategic selection and integration of these elements are critical for achieving the high sensitivity, specificity, and portability required for applications like food allergen detection. As transducer technologies advance and bioreceptor engineering becomes more sophisticated, the potential for developing even more powerful, multi-analyte, and user-friendly biosensing systems becomes immense, promising significant advancements in food safety, clinical diagnostics, and environmental monitoring.
The increasing global prevalence of food allergies represents a critical public health challenge, with current management strategies relying almost exclusively on the avoidance of allergenic foods [18]. This approach creates an urgent need for reliable, sensitive, and specific food allergen detection methods to ensure accurate food labeling and protect consumer safety [4]. For decades, enzyme-linked immunosorbent assay (ELISA) and polymerase chain reaction (PCR) have served as the cornerstone techniques for allergen analysis, forming the basis of many regulatory standards worldwide [4]. However, the evolving complexity of food matrices, advancements in food processing technologies, and increasingly stringent regulatory requirements have exposed significant limitations in these traditional methods [19] [20]. This application note systematically examines the technical constraints of ELISA and PCR platforms within modern allergen analysis workflows. Furthermore, it provides detailed experimental protocols for their implementation and contextualizes the imperative for novel biosensor systems that enable rapid, on-site allergen detection to address these methodological gaps. The transition toward innovative detection platforms is essential for advancing public health goals, improving regulatory compliance, and fostering the development of safer food products for sensitized populations.
Limitations of Traditional Methods
Technical Constraints of ELISA
The ELISA platform, despite its status as a gold standard in protein detection, faces several inherent technical limitations that impact its reliability and applicability in modern allergen analysis. A primary constraint is its narrow dynamic range compared to advanced immunoassays, which can restrict accurate quantification across varying allergen concentrations found in complex food products [19]. Performance is highly dependent on antibody quality, and developing a new ELISA assay can be both costly and time-consuming [19]. Additionally, the technique demonstrates particular vulnerability to matrix effects, especially in challenging samples like urine, but extending to complex food matrices where interfering components can lead to false-positive or false-negative results [19] [20]. This is compounded when food undergoes processing, as the structure of allergenic proteins can be damaged, altering antibody-binding epitopes and reducing detection accuracy [4]. While the CAC has adopted ELISA for gluten detection with a threshold of 20 mg/kg, the method's limitations necessitate careful consideration of its appropriate application [4].
Inherent Shortcomings of PCR
PCR, as a widely used nucleic acid-based method, provides an indirect approach to allergen detection by targeting allergen-encoding DNA sequences. Although it is particularly suitable for detecting highly processed allergenic foods where protein integrity may be compromised but DNA remains stable, this very principle constitutes a significant drawback [4]. The fundamental limitation is that PCR does not detect the allergenic protein itself, which is the actual molecule responsible for eliciting allergic reactions [4]. This disconnection between the marker (DNA) and the hazard (protein) can lead to discrepancies in risk assessment. Furthermore, PCR is not suitable for identifying allergen proteins with unascertained genes, which limits its scope of application [20]. The technique also typically requires stringent sample preparation, a larger sample volume, and longer analysis times, resulting in higher operational costs [20].
Comparative Analysis: ELISA vs. PCR
Table 1: Comparative analysis of ELISA and PCR for allergen detection.
| Parameter | ELISA (Protein-Based) | PCR (DNA-Based) |
|---|---|---|
| Target Molecule | Allergenic proteins (direct detection) | DNA encoding allergenic proteins (indirect detection) |
| Effect of Food Processing | Protein structure damage causes reduced detection [4] | DNA stability allows detection in processed foods [4] |
| Specificity | High, but dependent on antibody quality [19] [20] | High for specific DNA sequences [20] |
| Sensitivity | High (e.g., CAC gluten threshold: 20 mg/kg) [4] | High (e.g., Japan's threshold: 10 µg/g for some allergens) [4] |
| Key Limitation | Susceptible to epitope denaturation; matrix effects [19] [20] [4] | Does not detect the pathogenic protein; limited to known genes [20] [4] |
| Cost per Analysis | Higher cost (e.g., ~$61.53 for 4 inflammatory biomarkers) [19] | Generally high due to instrumentation and reagents [20] |
Economic and Operational Constraints
Beyond technical limitations, both ELISA and PCR present significant economic and operational challenges in routine analytical settings. Measuring a panel of four inflammatory biomarkers (IL-1β, IL-6, TNF-α, and IFN-γ) using individual ELISAs costs approximately $61.53 per sample [19]. In contrast, employing a multiplexed assay like Meso Scale Discovery (MSD) reduces the cost to $19.20 per sample, yielding a substantial saving of $42.33 per sample and highlighting the economic inefficiency of traditional single-plex approaches [19]. Furthermore, both techniques generally require centralized laboratory settings, sophisticated instrumentation, and trained personnel, rendering them unsuitable for rapid, on-site decision-making in production facilities or supply chain checkpoints [20] [21]. This lack of portability and lengthy turnaround times creates critical bottlenecks in quality control and hazard analysis, ultimately impacting consumer safety and regulatory compliance.
Detailed Experimental Protocols
Protocol 1: Sandwich ELISA for Allergen Quantification
Principle: This protocol describes the quantification of a specific allergenic protein (e.g., β-lactoglobulin from milk) using a sandwich ELISA. The method relies on two specific antibodies: a capture antibody immobilized on a microplate and a detection antibody conjugated to an enzyme (e.g., Horseradish Peroxidase, HRP). The target allergen is sandwiched between them, and the enzyme catalyzes a colorimetric reaction proportional to the allergen concentration [4].
- Workflow Diagram: Sandwich ELISA Protocol
Materials:
- Microplate: 96-well plate, high protein-binding capacity.
- Antibodies: Monoclonal or polyclonal capture antibody specific to the target allergen (e.g., β-lactoglobulin), detection antibody specific to a different epitope of the target allergen, conjugated to HRP.
- Allergen Standard: Purified, quantified target allergen for standard curve generation.
- Buffers: Coating buffer (e.g., carbonate-bicarbonate, pH 9.6), Phosphate-Buffered Saline with Tween (PBST) for washing, blocking buffer (e.g., 1-5% BSA or non-fat dry milk in PBST).
- Substrate: TMB (3,3',5,5'-Tetramethylbenzidine) or other HRP-compatible chromogenic substrate.
- Stop Solution: 1-2 M Sulfuric acid (H₂SO₄).
- Equipment: Microplate reader capable of measuring absorbance at 450 nm, microplate washer (optional), analytical software.
Procedure:
- Coating: Dilute the capture antibody in coating buffer to a predetermined optimal concentration (typically 1-10 µg/mL). Add 100 µL per well to the microplate. Seal the plate and incubate overnight at 4°C.
- Washing: Aspirate the coating solution and wash the plate three times with ~300 µL of PBST per well. Blot the plate on absorbent paper to remove residual liquid.
- Blocking: Add 200 µL of blocking buffer to each well. Incubate for 1-2 hours at room temperature (or 37°C). Repeat the washing step as in (2).
- Sample & Standard Addition: Prepare a serial dilution of the allergen standard in an appropriate buffer. Dilute food sample extracts in the same buffer. Add 100 µL of each standard, sample, and blank (buffer only) to designated wells in duplicate. Incubate for 1-2 hours at room temperature. Wash the plate three times.
- Detection Antibody Addition: Dilute the HRP-conjugated detection antibody to the recommended concentration in blocking buffer. Add 100 µL to each well. Incubate for 1-2 hours at room temperature. Wash the plate three times.
- Signal Development: Add 100 µL of TMB substrate solution to each well. Incubate in the dark for 15-30 minutes at room temperature, monitoring for color development.
- Reaction Stopping: Add 50 µL of stop solution to each well. The blue color will turn yellow.
- Measurement & Analysis: Measure the absorbance at 450 nm within 30 minutes using a microplate reader. Generate a standard curve (absorbance vs. log concentration) and calculate the allergen concentration in the unknown samples.
Protocol 2: Real-Time PCR for Allergen Gene Detection
Principle: This protocol detects and quantifies the presence of DNA sequences specific to an allergenic food (e.g., peanut, hazelnut). Real-time PCR (qPCR) utilizes sequence-specific primers and a fluorescent probe (or DNA-binding dye) to amplify and monitor the accumulation of the target DNA in real-time. The cycle threshold (Ct) value is used for qualitative or quantitative analysis [22] [4].
- Workflow Diagram: qPCR Protocol
Materials:
- DNA Extraction Kit: Commercial kit suitable for complex food matrices.
- qPCR Reagents: Master mix containing DNA polymerase, dNTPs, and buffer. MgCl₂ may be required separately.
- Oligonucleotides: Forward and reverse primers specific to the target allergen gene (e.g., Ara h 2 for peanut). A fluorescently labeled probe (e.g., TaqMan) is recommended for superior specificity.
- DNA Standards: Genomic DNA from the pure allergenic food for creating a standard curve (for quantitative analysis).
- Equipment: Real-time PCR instrument, microcentrifuge, thermal cycler, spectrophotometer or fluorometer for DNA quantification.
Procedure:
- DNA Extraction: Extract genomic DNA from the test food sample and a positive control (known allergenic food) using a commercial kit. Follow the manufacturer's instructions, which typically involve cell lysis, binding of DNA to a column, washing, and elution. Quantify the DNA concentration and assess purity (A260/A280 ratio).
- qPCR Reaction Setup: Prepare a master mix on ice. For a 20 µL reaction: 10 µL of 2x qPCR master mix, 0.5 µL each of forward and reverse primer (10 µM), 0.5 µL of probe (10 µM), and nuclease-free water to bring the volume to 18 µL per reaction. Mix gently. Aliquot 18 µL of the master mix into each well of a qPCR plate. Add 2 µL of template DNA (sample, standard, or no-template control - NTC) to each respective well. Seal the plate with an optical adhesive film and centrifuge briefly.
- qPCR Run Program: Place the plate in the real-time PCR instrument. Set the thermal cycling conditions as follows:
- Initial Denaturation: 95°C for 10 minutes (for polymerase activation).
- Amplification (40-45 cycles):
- Denature: 95°C for 15 seconds.
- Anneal/Extend: 60°C for 1 minute (acquire fluorescence at this step).
- Data Analysis:
- Qualitative Analysis: Set a fluorescence threshold within the exponential phase of amplification. A sample is considered positive if its Ct value is less than a predefined limit (e.g., 35-40) and the NTC shows no amplification.
- Quantitative Analysis: Use the serial dilutions of the standard DNA to generate a standard curve (Ct vs. log DNA quantity). The instrument's software will interpolate the quantity of target DNA in the unknown samples from this curve.
The Scientist's Toolkit: Research Reagent Solutions
Successful implementation of traditional and next-generation allergen detection methods relies on a suite of specialized reagents and tools. The following table details key components essential for research in this field.
Table 2: Key research reagents and materials for allergen analysis.
| Reagent/Material | Function/Application | Key Characteristics |
|---|---|---|
| Monoclonal/Polyclonal Antibodies | Core recognition element in immunoassays like ELISA [4]. | High specificity and affinity for a single (monoclonal) or multiple (polyclonal) epitopes on the target allergen. |
| Nucleic Acid Aptamers | Synthetic oligonucleotide recognition probes in biosensors [20] [23]. | High stability, facile synthesis/modification, and target versatility (proteins, small molecules). |
| TMB (3,3',5,5'-Tetramethylbenzidine) | Chromogenic enzyme substrate for HRP in ELISA [4]. | Yields a measurable color change (blue to yellow upon stopping) proportional to the target concentration. |
| PCR Primers & Probes | Amplify and detect specific DNA sequences from allergenic sources [4]. | Sequence-specificity is critical for accurate detection; often target multi-copy genes for sensitivity. |
| U-PLEX Multiplex Assay Plates | Simultaneous measurement of multiple protein biomarkers [19]. | Customizable panels enhance efficiency and reduce sample volume requirements compared to ELISAs. |
| Magnetic Beads (Functionalized) | Solid support for immunocapture or aptamer immobilization in automated systems [4]. | Enable separation and concentration of targets from complex matrices, improving sensitivity. |
The Pathway Forward: Bridging to Biosensors
The documented limitations of ELISA and PCR create a compelling case for the development and adoption of alternative technologies. Aptamer-based biosensors represent a promising avenue, offering the specificity of molecular recognition with the potential for rapid, on-site deployment. Aptamers, single-stranded DNA or RNA oligonucleotides selected for high-affinity binding to specific targets, present advantages over antibodies, including superior stability, easier modification, and lower production costs [20]. When coupled with transducers like electrochemical, optical (fluorescence), or SERS (Surface-Enhanced Raman Scattering) platforms, these biosensors can achieve high sensitivity and specificity. A meta-analysis of aptamer-based biosensors for SARS-CoV-2 detection, for instance, demonstrated that a SERS platform achieved a sensitivity of 0.97 and a specificity of 0.98, highlighting the potential diagnostic accuracy of such technologies for allergen detection [23].
The future of allergen analysis lies in the integration of these novel biosensing platforms with microfluidics for sample handling, connectivity for data transfer, and artificial intelligence for data interpretation and risk prediction [21]. These innovations are poised to transition allergen detection from a centralized, slow process to a decentralized, rapid, and data-rich practice, ultimately enhancing food safety and quality of life for allergic consumers.
The accurate and rapid detection of specific allergenic proteins in food products is a critical component of public health strategies to prevent severe allergic reactions. For individuals with food allergies, the only effective management strategy remains strict avoidance of the offending allergens, making reliable food labeling essential [24]. This document frames the detection of three major allergen targets—Ara h 1 (peanut), Gal d 3 (egg), and Tropomyosin (shellfish)—within the broader context of implementing advanced biosensor systems for rapid on-site analysis. The protocols herein are designed for researchers and scientists developing next-generation diagnostic tools that offer advantages in speed, sensitivity, and portability over conventional methods like ELISA [25].
Key Allergen Targets and Biosensor Performance
The "Big Eight" allergenic foods account for the majority of significant allergic reactions worldwide. Among these, peanut, egg, and crustacean shellfish are notably prevalent and are associated with severe, potentially life-threatening anaphylaxis [24]. The following table summarizes the primary allergen targets discussed in this document and the performance of biosensors developed for their detection.
Table 1: Key Allergen Targets and Analytical Performance of Biosensing Platforms
| Allergen Target | Source Food | Biosensor Platform | Linear Detection Range | Limit of Detection (LOD) | Assay Time | Reference |
|---|---|---|---|---|---|---|
| Ara h 1 | Peanut | Voltammetric Immunosensor (CdSe@ZnS QDs) | 25 – 1000 ng·mL⁻¹ | 3.5 ng·mL⁻¹ | 1 hour | [26] |
| Ara h 1 | Peanut | Electrochemical Immunosensor (PrNbO₄/f-CNF) | 0.0062 – 620 fg·mL⁻¹ | 0.0029 fg·mL⁻¹ | Information Missing | [27] |
| Tropomyosin | Shrimp/Crab | Electrochemical Immunosensor (ALP/3-IP/AgNO₃) | 2.5 – 20 ng·mL⁻¹ | 1.7 ng·mL⁻¹ | 2 hours 50 min | [28] |
| Tropomyosin | Shrimp/Crab | Colorimetric Aptasensor (AuNPs) | 10 – 200 nmol/L | 40 nmol/L (in buffer) | Information Missing | [29] |
| Gal d 3 (Ovotransferrin) | Hen's Egg | Amperometric Immunosensor (HRP/TMB) | 55 – 1000 ng·mL⁻¹ | 16 ng·mL⁻¹ | 30 min | [30] |
Detailed Experimental Protocols
Protocol 1: Voltammetric Immunosensor for Peanut Allergen Ara h 1
This protocol details the construction of a sandwich-type electrochemical immunosensor for Ara h 1 using quantum dots as an electroactive label, achieving detection in a one-hour assay [26].
Workflow Diagram: Ara h 1 QD Immunosensor
Materials and Reagents
- Transducer: Bare Screen-Printed Carbon Electrodes (SPCEs), DRP-110 [26].
- Capture & Detection Antibodies: Monoclonal anti-Ara h 1 antibodies (clone 2C12 for capture; biotinylated clone 2F7 for detection) [26].
- Electroactive Label: Core/shell CdSe@ZnS Quantum Dots conjugated with streptavidin (e.g., Qdot 655) [26].
- Buffers:
- 0.1 M Tris-HCl buffer, pH 7.4 (for biomolecule preparation).
- Tris-Tween 20 wash buffer, pH 7.4.
- 0.1 M Acetate buffer, pH 4.5, containing 1.0 mg·L⁻¹ Bi(III) for stripping analysis.
- Chemical Reagents: Hydrochloric acid (HCl) for QD dissolution.
Step-by-Step Procedure
- SPCE Biomodification: Physically adsorb 10 µL of monoclonal capture antibody onto the SPCE's working electrode. Incubate overnight at 4°C in a humidified chamber [26].
- Surface Blocking: Wash the electrode with Tris buffer. Apply 40 µL of a 2% (m/V) Bovine Serum Albumin (BSA) solution and incubate for 30 minutes at room temperature to block non-specific binding sites. Wash again [26].
- Target Capture and Detection: Pre-mix the sample/standard solution containing Ara h 1 with the biotinylated detection antibody for 10 minutes. Apply 40 µL of this mixture to the SPCE and incubate for 60 minutes. Wash to remove unbound material [26].
- Quantum Dot Labeling: Incubate the SPCE with streptavidin-coated CdSe@ZnS QDs for a specified time to allow binding to the biotinylated detection antibody. Perform a final wash step [26] [24].
- Electrochemical Detection:
- Dissolve the QD labels by adding a drop of HCl to release Cd²⁺ ions.
- Transfer the SPCE to the acetate buffer containing Bi(III).
- Perform Differential Pulse Anodic Stripping Voltammetry (DPASV):
- Preconcentration/Deposition: Apply a negative potential to reduce Cd²⁺ to metallic Cd(0) onto the SPCE surface, forming a Bi-Cd alloy.
- Stripping Step: Apply a positive potential scan. The anodic stripping current peak at approximately -0.9 V is proportional to the Ara h 1 concentration [26].
Protocol 2: Colorimetric Aptasensor for Shrimp Tropomyosin
This protocol describes a label-free aptasensor using gold nanoparticles (AuNPs) and a tropomyosin-binding aptamer for visual detection of the shrimp allergen, ideal for point-of-need testing [29].
Workflow Diagram: AuNP Aptasensor for Tropomyosin
Materials and Reagents
- Gold Nanoparticles (AuNPs): Citrate-capped AuNPs, ~13 nm diameter [29].
- Aptamer: Tropomyosin-binding aptamer, a single-stranded DNA (ssDNA) sequence [29].
- Salt Solution: Sodium Chloride (NaCl) at a concentration sufficient to induce aggregation in unprotected AuNPs.
- Buffers: Appropriate buffer for reconstituting the aptamer and diluting the TM standard/sample.
Step-by-Step Procedure
- Aptamer-AuNP Complex Formation: Incubate the tropomyosin-binding aptamer with the colloidal AuNPs solution. The ssDNA adsorbs onto the AuNP surface, protecting them from salt-induced aggregation [29].
- Sample Incubation: Add the sample or standard containing Tropomyosin to the Aptamer-AuNP complex. If TM is present, the aptamer binds to its target, folding into a specific tertiary structure and desorbing from the AuNP surface [29].
- Salt-Induced Aggregation and Readout: Add a predetermined concentration of NaCl to the mixture and allow it to incubate briefly.
- Positive Result (TM present): The AuNPs are less stabilized due to aptamer desorption. They aggregate in the salt solution, causing a color change from wine-red to purple or blue. This can be monitored visually or by a shift in the UV-Vis absorption peak from 520 nm [29].
- Negative Result (TM absent): The aptamer remains adsorbed on the AuNPs, stabilizing them against aggregation. The solution remains red [29].
Protocol 3: Amperometric Immunosensor for Egg Allergen Gal d 3
This protocol outlines a rapid, sandwich-type amperometric immunosensor for the detection of ovotransferrin (Gal d 3) in food products, with a total assay time of 30 minutes [30].
Workflow Diagram: Gal d 3 Amperometric Immunosensor
Materials and Reagents
- Transducer: Screen-Printed Carbon Electrodes (SPCEs, DRP-110) [30].
- Antibodies: Rabbit anti-Gal d 3 polyclonal antibody (unconjugated, for capture). Peroxidase-conjugated rabbit anti-Gal d 3 polyclonal antibody (for detection, DAb-HRP) [30].
- Enzymatic Substrate: 3,3',5,5'-Tetramethylbenzidine (TMB) with hydrogen peroxide (H₂O₂) [30].
- Buffers:
- Phosphate-Buffered Saline (PBS), pH 7.4, for biosensor construction.
- PBS with 0.5% (m/V) BSA for preparing allergen and detection antibody working solutions.
Step-by-Step Procedure
- Immunosensor Construction: Drop-cast 10 µL of the capture antibody onto the working electrode of the SPCE. Incubate overnight at 4°C in a humid chamber. Wash with PBS and block with a BSA solution [30].
- Allergen Incubation: Apply 40 µL of the standard or sample extract to the SPCE. Incubate for 15 minutes to allow Gal d 3 to bind to the capture antibody. Wash thoroughly with PBS [30].
- Enzyme-Labelled Detection: Apply 40 µL of the HRP-conjugated detection antibody to the SPCE. Incubate for 15 minutes to form the sandwich complex. Wash to remove excess, unbound DAb-HRP [30].
- Amperometric Measurement:
- Place the SPCE in an electrochemical cell containing the potentiostat.
- Add 40 µL of the TMB/H₂O₂ substrate solution.
- Apply a constant potential of -0.1 V versus the integrated silver pseudoreference electrode.
- Measure the reduction current generated by the electrochemical reduction of the enzymatically oxidized TMB product. The steady-state current is directly proportional to the concentration of Gal d 3 in the sample [30].
The Scientist's Toolkit: Essential Research Reagents
The development and implementation of these biosensing platforms rely on a core set of reagents and materials. The following table lists key solutions and their critical functions in allergen detection assays.
Table 2: Key Research Reagent Solutions for Allergen Biosensor Development
| Reagent / Material | Function / Application | Example from Protocols |
|---|---|---|
| Screen-Printed Electrodes (SPCE/SPGE) | Low-cost, disposable, portable transducer platform for electrochemical detection. | Carbon (SPCE) or Gold (SPGE) working electrodes form the base of most electrochemical immunosensors [26] [30] [27]. |
| Monoclonal & Polyclonal Antibodies | Provide high specificity and affinity as capture and detection elements in immunoassays. | Anti-Ara h 1 monoclonal antibodies [26]; anti-Gal d 3 polyclonal antibodies [30]. |
| Aptamers | Single-stranded DNA/RNA recognition elements; offer stability and cost-efficiency as antibody alternatives. | Tropomyosin-binding aptamer (TMBA) for AuNP-based colorimetric sensing [29]. |
| Enzymatic Labels (HRP, ALP) | Catalyze substrate conversion to generate measurable (e.g., electrochemical, colorimetric) signals. | Horseradish Peroxidase (HRP) for TMB reaction in Gal d 3 sensor [30]; Alkaline Phosphatase (ALP) for silver deposition in TPM sensor [28]. |
| Nanomaterial Labels (QDs, AuNPs) | Signal amplification; QDs provide electroactive metals for stripping voltammetry, AuNPs enable colorimetric readout. | CdSe@ZnS QDs for DPASV detection of Ara h 1 [26]; AuNPs for salt-induced aggregation assay for TPM [29]. |
| Electrode Modifiers | Enhance conductivity, surface area, and biocompatibility to improve sensor sensitivity. | Praseodymium niobate-functionalized Carbon Nanofibers (PrNbO₄/f-CNF) for ultrasensitive Ara h 1 detection [27]. |
| Blocking Agents (BSA, Casein) | Prevent non-specific adsorption of proteins to the sensor surface, reducing background signal. | 2% BSA solution used in all immunosensor protocols to block unmodified SPCE surfaces [26] [28] [30]. |
Cutting-Edge Methodologies: From Nanozymes to Point-of-Care Platforms
Nanozymes are nanomaterials with intrinsic enzyme-like characteristics that have emerged as powerful tools in biosensing, particularly for applications requiring high stability and sensitivity [31]. Their significance is especially pronounced in the field of rapid on-site allergen detection, where traditional natural enzymes often face limitations due to their sensitivity to environmental conditions, complex production processes, and high cost [32] [31]. Nanozymes address these challenges by offering exceptional storage stability, facile engineering, and reusability while maintaining catalytic efficiency comparable to their natural counterparts [32].
The fundamental advantage of nanozymes lies in their robust performance in harsh conditions where natural enzymes would denature. This makes them ideal candidates for developing portable, field-deployable biosensor systems for food allergen monitoring [32] [33]. Furthermore, their catalytic properties can be precisely tuned through rational engineering approaches, enabling the development of highly sensitive detection systems capable of identifying trace-level allergens in complex food matrices [32].
Fundamental Advantages Over Natural Enzymes
The transition from natural enzymes to nanozymes in biosensor development is driven by several distinct advantages that address critical limitations in real-world detection scenarios.
Table 1: Comparison Between Natural Enzymes and Nanozymes for Allergen Detection
| Property | Natural Enzymes | Nanozymes |
|---|---|---|
| Storage Stability | Limited; often require cold chain storage | Exceptional; often stable at room temperature for extended periods [34] |
| Environmental Tolerance | Sensitive to pH, temperature, and organic solvents | Robust performance under extreme conditions [32] [35] |
| Production Cost | High (complex extraction/purification) | Low-cost, scalable synthesis [33] |
| Engineering Flexibility | Limited to genetic/immobilization techniques | Highly tunable activity via size, morphology, and composition control [31] |
| Reusability | Often limited | Good reusability potential [32] |
The operational stability of nanozymes is a paramount advantage for on-site detection. For instance, Cu({2-x})Se@Bi(2)MoO(_6) nanocomposites developed for walnut allergen detection demonstrated suitability for room-temperature storage, eliminating the need for refrigeration and significantly simplifying logistics for field use [34]. This characteristic is invaluable for deploying biosensors in resource-limited settings or for industrial quality control across distributed facilities.
Additionally, nanozymes exhibit resistance to harsh conditions including extreme pH levels and high temperatures, which might be encountered during sample processing or in certain food matrices [32] [35]. This robustness ensures consistent catalytic performance and reliable detection outcomes across varied real-world conditions, a critical factor for standardizing allergen detection protocols.
Engineering and Design Strategies
The rational design of nanozymes focuses on enhancing their catalytic activity, selectivity, and integration capabilities within biosensing platforms. Several advanced material systems have been successfully engineered for this purpose.
Material Composition and Structure
Nanozymes can be constructed from diverse nanomaterials including metal-based nanoparticles (e.g., gold, silver), metal oxides (e.g., Fe(3)O(4), CeO(_2)), carbon-based materials (e.g., graphene, carbon nanotubes), and metal-organic frameworks (MOFs) [33] [31] [35]. Each material system offers distinct advantages:
- MOF-based nanozymes provide exceptionally high surface areas and tunable porosity, enabling enhanced bioreceptor immobilization and mass transport [33].
- Carbon-based nanozymes such as graphene quantum dots offer excellent electron transfer capabilities and facile functionalization through surface oxygen-containing groups [35].
- Hybrid nanozymes like Cu({2-x})Se@Bi(2)MoO(_6) nanocomposites combine the advantages of different materials, often resulting in synergistic enhancements of catalytic activity [34].
Surface Functionalization and Bioconjugation
Effective integration of nanozymes into biosensors requires strategic surface functionalization to interface with biological recognition elements. Common approaches include:
- Electrostatic adsorption for antibody attachment, as demonstrated in the development of immunoassays for walnut allergen detection [34].
- Covalent conjugation using crosslinkers to immobilize enzymes, aptamers, or antibodies while maintaining their biological activity.
- Molecular imprinting to create synthetic recognition sites complementary to specific allergen epitopes [33].
These functionalization strategies enable nanozymes to serve as highly sensitive signal probes in various immunoassay formats, translating molecular recognition events into detectable signals with amplification capabilities surpassing those of conventional enzyme labels [34].
Experimental Protocols
Protocol: Developing a Nanozyme-Based Competitive Immunoassay for Food Allergen Detection
This protocol outlines the procedure for developing a direct competitive immunoassay for walnut allergen (Jug r 4) detection using Cu({2-x})Se@Bi(2)MoO(_6) nanozymes, adaptable to other food allergens [34].
Materials and Equipment
- Synthesized Cu({2-x})Se@Bi(2)MoO(_6) nanozymes
- Walnut monoclonal antibody (mAb)
- Food samples (bread, biscuits, milk)
- Microplate reader
- 3,3',5,5'-Tetramethylbenzidine (TMB) substrate
- Hydrogen peroxide (H(2)O(2))
- Buffer solutions (phosphate buffer, coating buffer)
- Blocking solution (e.g., BSA or skim milk)
Procedure
Nanozyme-Antibody Probe Preparation
- Incubate Cu({2-x})Se@Bi(2)MoO(_6) nanozymes with walnut mAb at optimal ratio (determined via checkerboard titration) in phosphate buffer (pH 7.4) for 2 hours at room temperature with gentle shaking.
- Centrifuge at 12,000 × g for 15 minutes to remove unbound antibodies.
- Resuspend the nanozyme-mAb conjugate in storage buffer containing stabilizers.
Competitive Immunoassay Procedure
- Coat microplate wells with purified walnut protein antigen (1-10 μg/mL in carbonate buffer, pH 9.6) overnight at 4°C.
- Block nonspecific sites with 1% BSA in PBS for 2 hours at 37°C.
- Prepare standard solutions of walnut allergen (0-3500 μg/L) in appropriate food matrix extracts.
- Incubate fixed concentration of nanozyme-mAb probe with varying concentrations of walnut allergen standard or sample extract for 1 hour at 37°C.
- Transfer the mixture to antigen-coated wells and incubate for 45 minutes at 37°C.
- Wash wells thoroughly to remove unbound nanozyme-mAb probes.
- Add TMB/H(2)O(2) substrate solution and incubate for 15-30 minutes for color development.
- Stop the reaction with sulfuric acid and measure absorbance at 450 nm.
Data Analysis
- Plot standard curve of absorbance versus allergen concentration.
- Calculate allergen concentration in unknown samples using the standard curve.
- Validate method recovery by spiking known allergen concentrations into control matrices.
Protocol: Evaluating Nanozyme Peroxidase-like Activity
This standardized protocol assesses the peroxidase-mimicking activity of nanozymes, a crucial parameter for biosensor development [34] [35].
Materials
- Nanozyme suspension (appropriately diluted)
- TMB substrate solution (0.4 mg/mL)
- Hydrogen peroxide (10 mM)
- Buffer solutions (various pH)
- Spectrophotometer or microplate reader
Procedure
Prepare reaction mixture containing:
- 100 μL nanozyme suspension
- 50 μL TMB solution
- 50 μL H(2)O(2) solution
- 800 μL buffer (optimal pH)
Incubate at desired temperature (typically 25-37°C) for 10-30 minutes.
Measure absorbance at 652 nm (TMB oxidation product).
Calculate enzymatic activity parameters (Michaelis-Menten constant, catalytic efficiency) by varying substrate concentrations.
Compare catalytic efficiency with natural horseradish peroxidase as reference.
Performance Data and Applications
Nanozyme-based biosensors have demonstrated exceptional performance in detecting various allergens and contaminants, as summarized in the table below.
Table 2: Performance Metrics of Nanozyme-Based Detection Systems
| Nanozyme Type | Target Analyte | Detection Mechanism | Linear Range | Limit of Detection (LOD) | Application Matrix |
|---|---|---|---|---|---|
| Cu({2-x})Se@Bi(2)MoO(_6) | Walnut allergen (Jug r 4) | Colorimetric immunoassay | 137.35 ± 0.14 to 3526.0 ± 4.53 μg/L | 81.63 ± 0.89 μg/L | Bread, biscuits, milk [34] |
| Graphene Quantum Dots (GQDs) | Dichlorvos (pesticide) | Fluorescence quenching | Not specified | 0.778 μM | Food samples [35] |
| Various X-based nanozymes | Pesticide residues | Multimodal sensing | Varies by design | 2-3 orders magnitude improvement vs conventional | Agricultural products [35] |
The data demonstrate that nanozyme-based detection systems achieve excellent sensitivity with detection limits suitable for monitoring allergens and contaminants at regulated levels. The broad linear range enables accurate quantification across concentration ranges relevant to food safety monitoring. Furthermore, the implementation of multimodal sensing approaches (colorimetric/fluorescence, fluorescence/photothermal, photothermal/colorimetric) provides mutual verification of multiple signals, significantly enhancing detection reliability [35].
Beyond allergen detection, nanozymes have shown remarkable utility in environmental monitoring, particularly for pesticide detection in food. The integration of nanozymes with microfluidic chips or paper-based technologies has enabled the development of portable detection devices that increase detection sensitivity by 2-3 orders of magnitude while reducing costs by approximately 80% compared to conventional methods [35].
The Scientist's Toolkit
Table 3: Essential Research Reagent Solutions for Nanozyme Biosensor Development
| Reagent/Material | Function/Application | Key Characteristics |
|---|---|---|
| Cu({2-x})Se@Bi(2)MoO(_6) Nanozyme | Peroxidase-mimic signal probe in immunoassays | High catalytic activity, room temperature stable, cost-effective synthesis [34] |
| TMB (3,3',5,5'-Tetramethylbenzidine) | Chromogenic substrate for peroxidase-like activity | Colorless-to-blue conversion, measurable at 652 nm [34] |
| Graphene Quantum Dots (GQDs) | Fluorescent nanozymes for sensing applications | Peroxidase-like activity, tunable surface chemistry [35] |
| Metal-Organic Frameworks (MOFs) | High-surface-area nanozyme scaffolds | Exceptional loading capacity, tunable porosity [33] |
| Molecularly Imprinted Polymers (MIPs) | Synthetic bioreceptors for target recognition | Enhanced selectivity, stability, catalytic activity when hybridized [33] |
| Acetylcholinesterase (AChE) Enzyme | Biological recognition element in pesticide sensors | Inhibition-based detection mechanism [35] |
Signaling Pathways and Workflow Visualization
The following diagram illustrates the signaling mechanism and experimental workflow for a nanozyme-based competitive immunoassay for allergen detection:
Diagram 1: Nanozyme-Based Competitive Immunoassay Workflow - This visualization illustrates the competitive binding mechanism between free allergen and immobilized allergen for nanozyme-antibody probes, culminating in catalytic signal generation inversely proportional to allergen concentration.
Implementation Considerations
Integration with Emerging Technologies
The future development of nanozyme-based biosensors for allergen detection is closely tied to integration with advanced technologies:
Artificial Intelligence (AI): Machine learning algorithms can guide the rational design of nanozymes with tailored catalytic properties and selectivity for specific allergen targets [35]. AI can also optimize detection parameters and analyze complex signal patterns in multimodal sensing approaches.
Multimodal Sensing: Combining multiple detection modalities (colorimetric/fluorescence/photothermal) enhances reliability through signal verification and provides complementary information about the target analyte [35].
Portable Platforms: Integration with microfluidic chips and paper-based devices enables the development of point-of-care biosensors suitable for field use in food production facilities and regulatory inspections [35].
Validation and Standardization
For successful implementation in food safety monitoring programs, nanozyme-based biosensors require:
- Cross-validation with reference methods such as ELISA or LC-MS/MS to establish correlation and accuracy [36].
- Robustness testing across different food matrices to evaluate matrix effects and develop appropriate sample preparation protocols.
- Inter-laboratory validation to establish reproducibility and reliability of the detection method.
- Standardization of nanozyme characterization including catalytic activity metrics, stability profiles, and batch-to-batch consistency.
The exceptional properties of nanozymes—including their stability, tunable catalytic activity, and cost-effectiveness—position them as transformative tools for developing next-generation biosensing systems that can effectively address the critical need for rapid, sensitive, and on-site allergen detection in food products.
Food allergies represent a significant global health challenge, affecting millions of individuals and necessitating strict avoidance of allergenic foods. Currently, the most effective strategy for food allergy management remains the stringent avoidance of offending allergens [37]. Unlike some other major food allergens, substances like soy are uniquely challenging to avoid due to their prevalence and insidiousness in a wide variety of food products, including infant formulas [37]. In response to this challenge, biosensor technology has emerged as a promising solution for rapid, sensitive, and on-site detection of food allergens.
Biosensors are defined as self-contained integrated devices capable of offering specific quantitative or semi-quantitative analytical information using a biological recognition element directly interfaced with a transducer [38]. These devices have shown tremendous potential for transforming food safety monitoring by enabling real-time, accurate detection of allergenic proteins in complex food matrices. The critical importance of such technology stems from the fact that even trace amounts of allergens can trigger severe, life-threatening reactions in sensitive individuals [3].
This application note focuses on three principal signal transduction techniques—electrochemical, colorimetric, and fluorescent—that form the foundation of modern biosensing platforms for allergen detection. Each technique offers distinct advantages and operational characteristics that make them suitable for various application scenarios, from laboratory testing to point-of-care monitoring in food production facilities and even consumer-level use. The continuous improvement of material science and nanotechnology has significantly enhanced the performance of these biosensors, enabling unprecedented sensitivity and specificity in detecting trace-level allergens in complex food matrices [39].
Technical Comparison of Biosensing Modalities
The selection of an appropriate biosensing technique depends on multiple factors, including the required sensitivity, specificity, cost constraints, and the intended application environment. The table below provides a systematic comparison of the three primary biosensing modalities discussed in this document.
Table 1: Comparative analysis of biosensor transduction techniques for allergen detection
| Parameter | Electrochemical | Colorimetric | Fluorescent |
|---|---|---|---|
| Detection Principle | Measures changes in electrical properties (current, voltage, impedance) due to redox reactions [39] | Monitors color changes from nanoparticle aggregation or catalytic reactions [40] [41] | Detects fluorescence emission changes from quantum dots, carbon dots, or organic dyes [40] [42] |
| Sensitivity | High (picomolar to attomolar levels) [38] [39] | Moderate to high (micromolar range) [41] | Very high (able to detect single molecules in optimized systems) [42] |
| Detection Time | Rapid (<15 minutes for complete protocols) [3] | Very rapid (<1 minute in some cases) [41] | Moderate to rapid (minutes to hours) [42] |
| Equipment Needs | Portable potentiostats, screen-printed electrodes [37] [3] | Minimal (often visual inspection), sometimes with smartphone integration [40] | Fluorometers, UV lamps, or smartphone-based detectors [40] [42] |
| Multiplexing Capability | High (e.g., 16 simultaneous reactions in iEAT2) [3] | Limited to moderate | Moderate to high |
| Cost Considerations | Low to moderate (disposable electrodes, portable readers) [39] | Very low (paper-based platforms) [41] | Moderate (light sources, detectors required) |
| Key Advantages | High sensitivity, miniaturization potential, suitable for turbid samples [39] | Simplicity, visual readout, no instrumentation needed for qualitative assessment [41] | Exceptional sensitivity, multiplexing capability, tunable probes [42] |
| Limitations | Electrode fouling, requires reference electrode systems | Limited sensitivity in complex matrices, subjective interpretation | Photobleaching, interference from autofluorescence in food samples [39] [42] |
Electrochemical Biosensing
Principles and Mechanisms
Electrochemical biosensors function by detecting changes in electrical properties—including current, voltage, and impedance—that arise when allergenic molecules attach to designated receptors immobilized on the sensor surface [38]. The fundamental mechanism involves redox reactions between target analytes and the electrode surface, which are modulated through nanostructure-engineered interfaces [39]. When analytes such as allergenic proteins interact with recognition elements (aptamers, antibodies, or molecularly imprinted polymers) immobilized on sensing interfaces, electron transfer kinetics are altered, generating measurable electrical signals.
The signal output in electrochemical biosensors can originate from multiple sources. The analytes themselves, if possessing intrinsic redox activity, can be directly detected to obtain electrochemical signals [39]. More commonly, signal probes based on enzymes such as horseradish peroxidase (HRP) are leveraged to detect analytes by coupling catalytic reactions [3] [39]. Additionally, nanostructures with enzyme-like properties (nanozymes) and redox mediators like ferrocene derivatives or methylene blue are exploited as signal probes for generating current responses [39].
Experimental Protocol: Molecularly Imprinted Polymer-Based Soy Allergen Detection
Objective: Rapid and accurate detection of soy allergenic tracers in complex food matrices using molecularly imprinted polymer (MIP)-based electrochemical sensors [37].
Materials and Reagents:
- Screen-printed carbon electrodes (ItalSens IS-C) [37]
- Ortho-phenylenediamine (o-PD) and genistein (soy allergen marker) [37]
- Phosphate-buffered saline (PBS, pH 7.4) and sodium acetate buffer [37]
- Food samples and allergen extraction buffer [37]
Procedure:
- Sensor Preparation: Prepare MIP electrodes by electropolymerization of o-PD in the presence of genistein template molecules, followed by template extraction to create specific binding cavities [37].
- Sample Preparation: Homogenize 1 g of solid food using a mortar and pestle until a fine powder is obtained. Mix with 10 mL of extraction buffer and stir for 15 minutes. For liquid foods, directly mix 1 g with 10 mL of buffer solution [37].
- Electrochemical Measurement:
- Insert template-extracted MIP electrodes into 10 mL of buffer solution and equilibrate for 5 minutes.
- Incubate electrodes with 100 µL of sample solution for 1 minute.
- Perform differential pulse voltammetry (DPV) measurements with parameters: scan rate 50 mV/s, pulse width 50 ms, amplitude 50 mV [37].
- Data Analysis: Identify a positive response when the sensor shows an oxidation peak at approximately 0.60 V vs Ag/AgCl and an imprinting factor above 1.3, corresponding to oxidative redox transformations of genistein [37].
Experimental Protocol: iEAT2 System for Multiplexed Allergen Detection
Objective: Simultaneous detection of multiple food allergens (gliadin, Ara h1, ovalbumin) using an advanced electrochemical sensing system [3] [7].
Materials and Reagents:
- Immunomagnetic beads (Dynabeads M-270 Epoxy) [3]
- Horseradish peroxidase (HRP)-conjugated detection antibodies [3]
- 3,3′,5,5′-tetramethylbenzidine (TMB) substrate solution [3]
- Allergen extraction buffer and phosphate buffer [3]
- iEAT2 portable sensing device with 16-electrochemical cell array [3]
Procedure:
- Sample Preprocessing: Disrupt food matrix using a torsion grinding device in the presence of allergen-extraction buffer [3].
- Allergen Capture: Mix food extract with immunomagnetic beads functionalized with capture antibodies to target specific allergens. Incubate with continuous mixing [3].
- Magnetic Separation: Collect allergen-bound beads using a permanent magnet and wash to remove unbound components [3].
- Enzymatic Labeling: Incubate beads with HRP-conjugated detection antibodies to form a sandwich immunocomplex [3].
- Electrochemical Detection:
- Data Interpretation: Quantify allergen concentration based on measured current signals, with the entire protocol completed within 15 minutes [3].
Signal Acquisition Modalities in Electrochemical Sensing
Modern electrochemical systems employ multiple readout strategies tailored to food matrices [39]. Direct current (DC) techniques include voltammetric methods such as differential pulse voltammetry (DPV), square-wave voltammetry (SWV), and linear sweep voltammetry (LSV), which modulate electrode potentials to induce redox reactions and measure resultant current-voltage profiles [37] [39]. Amperometry monitors steady-state currents from catalytic reactions, exemplified by glucose oxidase-based biosensors [39].
Alternating current (AC) techniques include electrochemical impedance spectroscopy (EIS), which analyzes frequency-dependent impedance to probe interfacial phenomena, and conductometric sensors [39]. Hybrid and emerging modalities include photoelectrochemistry (PEC), which integrates light excitation with electron transfer, and self-powered systems that harvest energy from analyte reactions [39].
Colorimetric Biosensing
Principles and Mechanisms
Colorimetric biosensors detect allergens through observable color changes resulting from specific interactions between the target analyte and recognition elements. These sensors typically utilize localized surface plasmon resonance (LSPR) changes in metal nanoparticles (particularly gold nanoparticles) or enzymatic reactions that produce colored products [40] [41]. The fundamental mechanism involves nanoparticle aggregation or dispersion that alters the surface plasmon resonance properties, leading to visible color shifts that can be detected with the naked eye or simple spectrophotometers.
When functionalized nanoparticles encounter target allergens, the specific binding events induce aggregation through interparticle crosslinking, anti-crosslinking, or morphological changes. This aggregation causes a redshift in the LSPR absorption peak and a corresponding color change from red to blue for gold nanoparticles [41]. The degree of color change correlates with allergen concentration, enabling quantitative analysis. Recent advances have integrated these principles with paper-based platforms and smartphone technology for rapid, on-site detection without sophisticated instrumentation [40] [41].
Experimental Protocol: Paper-Based Colorimetric Sensor for Histamine Detection
Objective: Rapid detection of histamine, a biogenic amine marker of food spoilage, using dopamine-functionalized gold nanoparticles (DCt-AuNPs) on a paper platform [41].
Materials and Reagents:
- Gold(III) chloride hydrate (HAuCl₄) and trisodium citrate [41]
- Dopamine hydrochloride and histamine standard [41]
- Glass microfiber filter paper (Whatman GF/C) [41]
- Ultrapure water and various analytes for selectivity testing [41]
Procedure:
- Synthesis of DCt-AuNPs:
- Prepare 50 mL of 0.5 mM HAuCl₄ solution and heat to 95°C with vigorous stirring.
- Rapidly add sodium citrate solution (34.0 mM) at varying molar ratios (1.5-3.0) to control nanoparticle size (13-39 nm).
- Continue heating for 15 minutes until wine-red color appears, indicating nanoparticle formation.
- Cool to room temperature and add 0.250 mL of 1 mM dopamine hydrochloride with stirring for 2 hours [41].
Sensor Fabrication:
- Cut glass microfiber filter paper to dimensions of 1.5 cm × 1.0 cm.
- Immerse paper strips in DCt-AuNP solution for 4 hours.
- Store vacuum-sealed at 4°C for at least 24 hours before use [41].
Colorimetric Detection:
- Prepare histamine solutions in concentrations ranging from 1-100 ppm.
- Immerse paper sensors in 400 µL aliquots of analyte solutions for 30-60 seconds.
- Remove, photograph, and image using a chromameter for colorimetric analysis.
- Measure absorbance spectra using UV-Vis spectrometer to monitor LSPR peak shifts [41].
Data Analysis:
- Calculate absorbance ratio (A650/A520) for calibration curve construction.
- Determine detection limit based on signal-to-noise ratio (S/N=3) [41].
Experimental Protocol: Dual-Mode Biosensor for β-Lactoglobulin Detection
Objective: Colorimetric and fluorometric detection of β-lactoglobulin (BLG), a major milk allergen, using G-quadruplex/hemin DNAzyme and carbon dots [40].
Materials and Reagents:
- BLG aptamer and hemin [40]
- Orange-emitting carbon dots (O-CDs) [40]
- 3,3′,5,5′-Tetramethylbenzidine (TMB) substrate [40]
- HEPES buffer (pH 7.4) [40]
Procedure:
- Preparation of G-Quadruplex/Hemin DNAzyme:
- Incubate BLG aptamer sequence in HEPES buffer containing hemin and potassium ions to facilitate G-quadruplex formation with peroxidase-like activity [40].
Dual-Mode Detection:
- Mix DNAzyme solution with O-CDs and TMB substrate.
- In the absence of BLG, the DNAzyme catalyzes TMB oxidation to blue oxTMB, which quenches O-CDs fluorescence via internal filter effect.
- In the presence of BLG, the aptamer binds to the allergen, disrupting DNAzyme structure, decreasing TMB oxidation, and restoring O-CDs fluorescence [40].
Signal Measurement:
- Measure colorimetric signal at 370 nm (oxTMB absorption).
- Measure fluorescence signal at 580 nm (O-CDs emission).
- Integrate with smartphone platform for quantitative analysis using color intensity [40].
Data Interpretation:
- Construct calibration curves for both colorimetric and fluorescence modalities.
- The biosensor demonstrates linearity from 1 μg·mL⁻¹ to 500 μg·mL⁻¹ of BLG [40].
Fluorescent Biosensing
Principles and Mechanisms
Fluorescent biosensors operate based on the principle that when a substance absorbs light of higher energy (shorter wavelength), it emits light of lower energy (longer wavelength) in a very short-lived phenomenon (10⁻⁹ to 10⁻⁸ seconds) known as fluorescence [42]. The detection of food allergens using fluorescence biosensing involves monitoring changes in fluorescence properties—intensity, lifetime, or spectral shift—resulting from specific interactions between target allergens and recognition elements.
These biosensors typically employ various fluorescence mechanisms, including fluorescence resonance energy transfer (FRET), internal filter effect (IFE), and photoinduced electron transfer (PET) [40] [42]. The advancements in nanotechnology have revolutionized fluorescence biosensing by introducing nanomaterials such as quantum dots, carbon dots, gold nanoclusters, and upconversion nanoparticles that offer superior optical properties compared to traditional organic dyes, including broader excitation ranges, narrower emission bands, higher quantum yields, and enhanced photostability [42].
Experimental Protocol: Dual-Mode Fluorescent Biosensor for β-Lactoglobulin
Objective: Fluorometric detection of β-lactoglobulin (BLG) using orange-emitting carbon dots (O-CDs) in conjunction with G-quadruplex/hemin DNAzyme [40].
Materials and Reagents:
- BLG aptamer and hemin [40]
- Orange-emitting carbon dots (O-CDs) synthesized from rhodamine B [40]
- 3,3′,5,5′-Tetramethylbenzidine (TMB) [40]
- HEPES buffer (pH 7.4) with potassium ions [40]
Procedure:
- Preparation of O-CDs:
- Sonicate 120 mg of rhodamine B in 10 mL ultrapure water.
- Transfer to Teflon-lined autoclave and react at 160°C for 2 hours.
- Dialyze supernatant for 12 hours to obtain final O-CDs solution [40].
Dual-Mode Detection Mechanism:
- In the absence of BLG, the G-quadruplex/hemin DNAzyme exhibits peroxidase-like activity, catalyzing TMB oxidation to blue oxTMB.
- The oxTMB efficiently quenches O-CDs fluorescence through internal filter effect (IFE).
- In the presence of BLG, the aptamer specifically binds to the allergen, disrupting DNAzyme formation.
- This disruption decreases oxTMB production and restores O-CDs fluorescence [40].
Fluorescence Measurement:
- Incubate 20 μL of BLG aptamer (5 μM) with varying BLG concentrations for 30 minutes.
- Add hemin (0.5 μM) and incubate for 1 hour to form DNAzyme.
- Add O-CDs and TMB, then measure fluorescence intensity at 580 nm with excitation at 450 nm.
- Simultaneously monitor colorimetric signal at 370 nm for dual-mode verification [40].
Data Analysis:
- Plot fluorescence intensity versus BLG concentration for quantification.
- The biosensor demonstrates excellent linearity from 1 μg·mL⁻¹ to 500 μg·mL⁻¹ of BLG [40].
Experimental Protocol: Fluorescent Detection Using Quantum Dots and Carbon Nanomaterials
Objective: Highly sensitive detection of food allergens and contaminants using quantum dots and carbon-based fluorescent nanomaterials [42].
Materials and Reagents:
- Quantum dots (various compositions: CdSe, CdTe, etc.) [42]
- Carbon dots or graphene quantum dots [42]
- Specific aptamers or antibodies for target recognition [42]
- Buffer solutions appropriate for the specific nanomaterial and recognition element
Procedure:
- Probe Functionalization:
- Conjugate recognition elements (aptamers, antibodies) to quantum dots or carbon dots using appropriate crosslinking chemistry.
- Purify functionalized probes to remove unbound recognition elements.
Sample Incubation:
- Mix functionalized fluorescent probes with food extract samples.
- Incubate to allow specific binding between target allergens and recognition elements.
- The binding event induces changes in fluorescence properties through FRET, IFE, or other mechanisms.
Signal Detection:
- Measure fluorescence emission using a fluorometer, microplate reader, or portable fluorescence detector.
- For field applications, utilize smartphone-based fluorescence detection systems.
- Monitor changes in fluorescence intensity, lifetime, or spectral shifts.
Performance Characteristics:
Table 2: Fluorescent nanomaterials and their applications in food allergen detection
| Nanomaterial | Target Analyte | Biorecognition Element | Limit of Detection | Reference |
|---|---|---|---|---|
| Gold nanoparticles | Salmonella typhimurium | DNA aptamer | 36 CFU/mL | [42] |
| Gold nanoparticles | Histamine | Gold nanoparticles | 2.04 nM | [42] |
| Silver nanoparticles | Staphylococcal enterotoxin A | DNA aptamer | 0.3393 ng/mL | [42] |
| Carbon dots | Tartrazine | Fluorescent carbon dots | 12.4 nM | [42] |
| Carbon dots | Tetracyclines and Al³⁺ | Fluorescent carbon dots | 0.057-0.23 μM and 0.091 μM | [42] |
| Quantum dots | Acrylamide | DNA aptamer | 2.41 × 10⁻⁸ M | [42] |
The Scientist's Toolkit: Essential Research Reagents and Materials
The development and implementation of biosensors for allergen detection require specific reagents, materials, and instrumentation. The table below summarizes key research reagent solutions essential for working with electrochemical, colorimetric, and fluorescent biosensing platforms.
Table 3: Essential research reagents and materials for biosensor development
| Category | Specific Items | Function/Application | Examples from Protocols |
|---|---|---|---|
| Recognition Elements | DNA aptamers | Specific target recognition; can form DNAzyme structures | BLG aptamer for milk allergen detection [40] |
| Antibodies (monoclonal/polyclonal) | High-affinity binding to specific allergenic proteins | Immunomagnetic beads with capture antibodies [3] | |
| Molecularly imprinted polymers (MIPs) | Synthetic receptors with tailored binding cavities | o-PD MIP for genistein detection [37] | |
| Nanomaterials | Gold nanoparticles (AuNPs) | Colorimetric sensing via LSPR changes; fluorescence quenching | Dopamine-functionalized AuNPs for histamine detection [41] |
| Carbon dots (CDs) and quantum dots (QDs) | Fluorescent probes with tunable emission | Orange-emitting CDs for BLG detection [40] | |
| Magnetic nanoparticles | Sample preparation and target concentration | Dynabeads for immunomagnetic separation [3] | |
| Signal Probes | Horseradish peroxidase (HRP) | Enzymatic signal amplification in electrochemical systems | HRP-conjugated detection antibodies [3] |
| Hemin | Cofactor for DNAzyme formation in colorimetric systems | G-quadruplex/hemin DNAzyme [40] | |
| Redox mediators (TMB, ferrocene) | Electron transfer in electrochemical detection | TMB substrate for HRP-catalyzed reaction [3] | |
| Platform Materials | Screen-printed electrodes | Disposable electrochemical sensing platforms | Carbon ItalSens IS-C screen-printed electrodes [37] |
| Paper substrates | Low-cost platform for colorimetric tests | Glass microfiber filter paper [41] | |
| Microfluidic chips | Miniaturized fluid handling for integrated systems | iEAT2 detection chamber [3] | |
| Instrumentation | Potentiostats | Applied potential and current measurement in electrochemistry | PalmSens4 potentiostat [37] |
| Spectrophotometers | Absorbance measurement for colorimetric assays | Perkin Elmer UV-Vis spectrometer [41] | |
| Fluorometers | Fluorescence intensity and lifetime measurement | Various systems for fluorescent biosensors [42] | |
| Smartphone-based readers | Portable, accessible detection for point-of-care testing | Integrated with dual-mode biosensors [40] |
The implementation of electrochemical, colorimetric, and fluorescent biosensing systems represents a transformative approach to rapid on-site allergen detection in food products. Each transduction technique offers distinct advantages that can be leveraged for specific application requirements. Electrochemical biosensors provide high sensitivity, miniaturization potential, and compatibility with complex food matrices [3] [39]. Colorimetric platforms offer simplicity, visual readout, and minimal instrumentation needs [40] [41]. Fluorescent biosensors deliver exceptional sensitivity and multiplexing capabilities [40] [42].
The protocols detailed in this application note demonstrate that these biosensing technologies can achieve detection sensitivities below established allergic reaction thresholds, with complete analysis times as short as 15 minutes for electrochemical systems [3] and under 1 minute for certain colorimetric applications [41]. The integration of these platforms with portable detection devices, including smartphones, microfluidic chips, and paper-based systems, further enhances their potential for point-of-care testing in diverse settings from food production facilities to consumer use.
Future directions in this field will likely focus on improving multiplexing capabilities for simultaneous detection of multiple allergens, enhancing sample preparation methodologies to streamline the analytical process, and developing more robust and stable recognition elements for extended shelf-life and field deployment. The convergence of biosensing technologies with artificial intelligence, Internet of Things (IoT) connectivity, and blockchain-enabled traceability systems holds particular promise for creating comprehensive food safety monitoring networks that can prevent allergen exposure throughout the food supply chain [39].
Loop-mediated isothermal amplification (LAMP) presents a transformative approach for point-of-care (POC) diagnostics, particularly for rapid allergen detection. As a nucleic acid amplification technique, LAMP operates at a constant temperature, eliminating the need for complex thermal cycling equipment required by conventional PCR [43]. This characteristic, combined with its potential for visual, equipment-free result interpretation, makes it exceptionally suitable for resource-limited settings and field-based testing [44]. For researchers developing biosensor systems for on-site allergen detection, LAMP offers a robust, sensitive, and highly specific molecular backbone that can be integrated into compact, user-friendly devices. The technology's inherent compatibility with colorimetric detection and microfluidic platforms enables the creation of complete lab-on-a-chip systems for allergen monitoring in food products and environmental samples [45]. This application note details the methodologies and protocols for implementing LAMP in POC allergen detection systems, providing researchers with practical guidance for developing rapid, equipment-free diagnostic platforms.
Fundamental Principles and Advantages
LAMP is an isothermal nucleic acid amplification technique that utilizes a DNA polymerase with strand displacement activity and 4-6 specifically designed primers that recognize 6-8 distinct regions of the target DNA [46]. The reaction occurs at a constant temperature between 60-65°C, generating up to 10^9 copies of the target sequence within 15-60 minutes [43] [46]. This exponential amplification efficiency is significantly higher than conventional PCR, producing approximately two orders of magnitude more amplicons [47]. The technique involves an initial structure formation step followed by a cyclic amplification phase, resulting in stem-loop DNA structures with inverted repeats that serve as the foundation for subsequent amplification cycles [43] [46].
Table 1: Comparison of LAMP with Conventional PCR for POC Applications
| Parameter | LAMP | Conventional PCR |
|---|---|---|
| Temperature Requirements | Single temperature (60-65°C) | Thermal cycling (30-40 cycles) |
| Amplification Time | 15-60 minutes | 1.5-3 hours |
| Equipment Complexity | Simple heat block or water bath | Thermocycler |
| Sensitivity | High (can detect <100 copies) | High |
| Specificity | Very high (recognizes 6-8 regions) | High (recognizes 2 regions) |
| Amplification Efficiency | ~10^9 copies in 30-60 min | ~10^7 copies in 1.5-3 h |
| Tolerance to Inhibitors | High | Moderate |
| Result Detection | Visual (colorimetric, turbidity), real-time monitoring | Typically requires gel electrophoresis or real-time systems |
| Suitability for POC | Excellent | Limited |
The primary advantages of LAMP for POC applications include its operational simplicity, rapid turnaround time, and minimal equipment requirements [43]. The technique demonstrates higher tolerance to polymerase inhibitors present in biological samples, enabling robust amplification without extensive nucleic acid purification [43]. Furthermore, the availability of multiple detection methods, including colorimetric changes that are visible to the naked eye, facilitates implementation in resource-limited settings where sophisticated instrumentation is unavailable [48] [45].
Primer Design Considerations
Effective LAMP primer design is critical for successful assay development. A complete LAMP primer set typically includes two outer primers (F3 and B3), two inner primers (FIP and BIP), and optionally two loop primers (LF and LB) to accelerate the reaction [43]. The primers should target 6-8 specific regions of the allergen-encoding gene, typically 150-300 bp in length. Key design considerations include:
- Sequence Selection: Target regions should be conserved within the allergen gene but distinct from non-target sequences to ensure specificity. The F2/B2 regions should be located 40-60 bases apart to allow sufficient space for loop formation [43].
- Thermodynamic Properties: The melting temperature (Tm) of F2 and B2 regions should be similar (within 5°C), while F1c and B1c should have a higher Tm than F2/B2 to facilitate immediate stem-loop structure formation [43]. For GC-rich primers, Tm should be 60-65°C; for AT-rich primers, 55-60°C is appropriate [43].
- Structural Considerations: Avoid repeats of dinucleotides or single nucleotides (more than three repetitions), as these can cause mispriming. The 3' ends should not be AT-rich or complementary to other primers to prevent secondary structure formation [43].
Several software tools are available for LAMP primer design, including PrimerExplorer (Eiken Chemical) and open-source alternatives, which help identify appropriate target regions and optimize primer sequences.
LAMP Detection Methodologies
Colorimetric Detection Systems
Colorimetric detection methods provide visual result interpretation without instrumentation, making them ideal for POC applications. Three primary mechanisms enable colorimetric detection in LAMP assays:
- pH-Sensitive Indicators: During DNA amplification, incorporation of nucleotides releases hydrogen ions (H+), decreasing reaction pH. Indicators like phenol red transition from pink (negative, pH ~8.8) to yellow (positive, pH ~7.2) [49]. Cresol red similarly changes from purple to yellow across this pH range [47].
- Metal Ion Indicators: Amplification consumes magnesium ions (Mg2+) as they complex with generated pyrophosphate. Metal indicators like hydroxynaphthol blue (HNB) change from violet to sky blue [48], while calcein transitions from orange to yellow-green upon Mg2+ binding [46].
- Dual-Color Blending: Combining HNB and cresol red creates a wider color variation window with enhanced contrast (purple-to-green) for easier naked-eye interpretation [47].
Table 2: Colorimetric Detection Methods for LAMP Assays
| Detection Method | Indicator Type | Color Change (Negative→Positive) | Mechanism | Detection Limit |
|---|---|---|---|---|
| HNB-Based | Metal ion indicator | Violet → Sky blue [48] | Mg2+ depletion [46] | 100 fg DNA/reaction [46] |
| Phenol Red | pH indicator | Pink → Yellow [49] | Proton release [49] | 10-100 RNA copies [49] |
| Calcein | Metal ion indicator | Orange → Yellow-green [46] | Mg2+ binding [46] | 1 pg DNA/reaction [46] |
| Dual HNB-CR | Combined | Purple → Green [47] | Mg2+ depletion + pH change [47] | Comparable to real-time LAMP [47] |
| Eriochrome Black T | Metal ion indicator | Violet → Sky blue [46] | Mg2+ depletion [46] | 1 pg DNA/reaction [46] |
Colorimetric LAMP assays typically employ closed-tube formats that minimize aerosol contamination and simplify operation. The indicators are pre-added to the reaction mixture before amplification, eliminating the need to open tubes post-amplification [47]. For allergen detection, this approach has demonstrated sensitivity comparable to real-time PCR in detecting peanut, sesame, and soybean allergens at concentrations as low as 0.4 ng/μL [45].
Alternative Detection Modalities
While colorimetric detection offers simplicity for POC applications, other methods provide additional capabilities for laboratory validation or quantitative analysis:
- Turbidimetry: The accumulation of magnesium pyrophosphate precipitate during amplification increases solution turbidity, measurable with a simple photometer or by visual inspection [46]. This method enables real-time monitoring of amplification kinetics [50].
- Fluorometry: DNA-intercalating dyes like SYTO-9, SYBR Green I, or EvaGreen produce fluorescence upon binding to double-stranded LAMP products, enabling real-time detection with portable fluorometers [46]. Post-amplification addition of SYBR Green I enables endpoint fluorescence detection under UV light, though this requires tube opening and increases contamination risk [47].
- Lateral Flow Detection: Biotin- and fluorescein-labeled primers incorporate during amplification, enabling amplicon detection using gold nanoparticle- or latex-based immunochromatographic strips in a dipstick format [43].
Experimental Protocols
Colorimetric LAMP for Allergen Detection
This protocol adapts established LAMP methodologies for detecting food allergens, incorporating colorimetric detection suitable for POC applications [45] [47].
Sample Preparation and DNA Extraction
- Homogenization: Grind food samples (e.g., peanuts, sesame, soybean) to a fine powder using a food mixer or mortar and pestle.
- Spiked Sample Preparation: For validation, prepare spiked samples using rice powder as a matrix, containing 0.0001%-10% (w/w) of target allergen [47].
- DNA Extraction: Use a commercial plant genomic DNA extraction kit according to manufacturer instructions.
- DNA Quantification: Measure DNA concentration and purity using a spectrophotometer (e.g., NanoDrop). Adjust to working concentrations (typically 10-100 ng/μL) and store at -20°C.
LAMP Reaction Setup
Reaction Composition: Prepare 20-25 μL reactions containing:
- 1.6 μM each inner primer (FIP, BIP)
- 0.2 μM each outer primer (F3, B3)
- 0.8 μM each loop primer (LF, LB) [47]
- 1.4 mM each dNTP
- 8 mM MgSO₄ [47]
- 10 mM (NH₄)₂SO₄ [47]
- 10 mM KCl [47]
- 0.1% Tween 20 [47]
- 20 mM Tris-HCl (pH 8.8) [49]
- Colorimetric indicator (120 μM HNB [48] or phenol red [49])
- 8 U Bst DNA polymerase (or 0.32 μM Bst 2.0/3.0 polymerase) [47]
- 1-2 μL DNA template (10-100 ng)
Primer Design: Design primers targeting allergen-specific genes:
Reaction Conditions:
- Incubate at 63-65°C for 30-60 minutes [45]
- Terminate reaction by heating at 80°C for 5 minutes (optional)
Controls: Include positive control (target DNA), negative control (non-target DNA), and no-template control (water) in each run.
Result Interpretation
- Visual Inspection: Observe color change directly with naked eye under natural lighting:
- Documentation: Photograph results against white background for record-keeping.
Visual LAMP Workflow for Allergen Detection
Microfluidic Integration Protocol
This protocol describes integration of LAMP into microfluidic platforms for automated, high-throughput allergen detection [45].
Chip Design and Fabrication
- Design: Create microfluidic design with separate reaction chambers (5-20 μL volume) for different allergens, connected by microchannels for sample distribution.
- Fabrication: Use polydimethylsiloxane (PDMS) soft lithography or injection molding for chip production.
- Surface Treatment: Treat channels with hydrophilic coating to facilitate fluid flow.
Chip Preparation and Loading
- Primer Pre-loading: Pre-load allergen-specific LAMP primer mixes into separate reaction chambers and air-dry.
- Master Mix Addition: Inject LAMP master mix (containing buffer, dNTPs, polymerase, and indicator) into central reservoir.
- Sample Introduction: Add extracted DNA sample to sample inlet.
- Sealing: Seal inlets/outlets to prevent evaporation during amplification.
On-Chip Amplification and Detection
- Thermal Control: Place chip on pre-heated block or in oven at 63-65°C for 30-60 minutes.
- Result Visualization: Observe color changes in individual reaction chambers:
- Chamber with color change indicates presence of specific allergen
- No color change indicates absence of corresponding allergen
- Data Interpretation: Document results using smartphone camera or dedicated reader.
Research Reagent Solutions
Table 3: Essential Research Reagents for LAMP-Based Allergen Detection
| Reagent Category | Specific Examples | Function | Application Notes |
|---|---|---|---|
| DNA Polymerase | Bst 2.0 WarmStart, Bst 3.0 | Strand-displacing polymerase for isothermal amplification | Bst 3.0 exhibits reverse transcriptase activity for RNA targets [46] |
| Primers | F3/B3, FIP/BIP, LF/LB | Target recognition and amplification initiation | Custom-designed for specific allergen genes [45] |
| Colorimetric Indicators | HNB, Phenol Red, Calcein | Visual detection of amplification | Pre-added to reaction mixture; enables closed-tube detection [48] [49] |
| Reaction Buffer | Mg²⁺, Betaine, dNTPs | Optimal enzymatic activity and specificity | Betaine reduces secondary structure; Mg²⁺ concentration critical [47] |
| Sample Preparation | Plant DNA extraction kits | High-quality DNA template | Commercial kits provide consistent yield and purity [47] |
| Microfluidic Substrates | PDMS, PMMA | Miniaturized reaction platforms | Enable multiplexed detection in portable format [45] |
Integration with Biosensor Systems
LAMP technology integrates effectively with biosensor platforms to create comprehensive allergen detection systems. The combination leverages LAMP's molecular specificity with biosensor transduction mechanisms for enhanced sensitivity and usability:
- Microfluidic Integration: LAMP reactions can be implemented in lab-on-a-chip devices that incorporate sample preparation, amplification, and detection in an automated, miniaturized format [45]. Centrifugal microfluidic platforms use rotation to control fluid flow, while capillary-driven chips require no external power for fluid manipulation [45].
- Smartphone-Based Detection: Mobile cameras can capture colorimetric changes or fluorescence signals, with dedicated applications providing result interpretation, data storage, and geotagging capabilities [44].
- CRISPR-Cas Integration: Combining LAMP with CRISPR-Cas systems enhances detection specificity through collateral cleavage of reporter molecules, enabling lateral flow readout [51].
- Multiplexing Approaches: Spatial separation of multiple primer sets in microfluidic chambers or using differentially labeled molecular beacons enables simultaneous detection of several allergens in a single sample [45].
LAMP-Biosensor Integration Framework
Performance Validation and Troubleshooting
Analytical Validation
Comprehensive validation ensures reliable allergen detection in real-world applications:
- Sensitivity: Determine limit of detection (LOD) using serial dilutions of target DNA. Effective LAMP assays typically detect 0.4-10 ng/μL of allergen DNA [45] or 10-100 copies of target sequences [49].
- Specificity: Verify absence of cross-reactivity with non-target allergens and food matrices. Test against common food components including walnuts, almonds, hazelnuts, mustard, and wheat [45].
- Accuracy: Compare results with reference methods (e.g., real-time PCR, ELISA) using certified reference materials or spiked samples [45].
- Reproducibility: Assess inter-assay and intra-assay precision through replicate testing across different operators, days, and reagent lots.
Troubleshooting Common Issues
- Non-Specific Amplification: Optimize primer design, increase reaction temperature (up to 65°C), reduce incubation time, or use WarmStart enzyme variants to prevent primer dimer formation [46].
- Low Sensitivity: Verify primer design against target sequences, optimize Mg²⁺ concentration (typically 4-8 mM), include betaine (0.5-0.8 M) to reduce secondary structure, and ensure DNA quality [47].
- Inconsistent Color Change: Prepare fresh indicator solutions, adjust initial reaction pH to 8.8-9.0, and ensure proper Mg²⁺ concentration for metal ion indicators [47].
- Inhibition from Food Matrices: Dilute DNA extracts, add bovine serum albumin (0.1-0.5 μg/μL) to binding reactions, or use polymerases with enhanced inhibitor resistance (e.g., Bst 3.0) [46].
LAMP technology represents a powerful platform for developing rapid, equipment-free POC detection systems for food allergens. Its isothermal nature, compatibility with colorimetric detection, and potential for integration with microfluidic biosensors address critical needs for decentralized food safety testing. The protocols and methodologies presented herein provide researchers with practical tools for implementing LAMP-based detection in allergen monitoring programs. As the field advances, further improvements in primer design, enzyme engineering, and system integration will enhance the sensitivity, multiplexing capability, and usability of these platforms, ultimately strengthening food safety systems and protecting consumers from allergen exposure risks.
The increasing global prevalence of food allergies demands advanced diagnostic solutions that are rapid, accurate, and capable of on-site implementation [52] [53]. Conventional methods for allergen detection, such as Enzyme-Linked Immunosorbent Assay (ELISA) and polymerase chain reaction (PCR), often involve time-consuming processes, destructive sampling, and limited multiplexing capabilities [21] [52]. These limitations have accelerated the development of innovative diagnostic platforms that integrate biosensor systems for rapid on-site analysis. Among the most promising technologies are Hyperspectral Imaging (HSI), Fourier Transform Infrared (FTIR) spectroscopy, and Mass Spectrometry (MS), which offer non-destructive, multiplexed detection of allergenic contaminants in complex food matrices [21]. This application note details experimental protocols and technical specifications for implementing these advanced diagnostic tools within a research framework focused on biosensor development for allergen detection.
The following table summarizes the key operational characteristics and performance metrics of HSI, FTIR, and Mass Spectrometry in the context of allergen detection.
Table 1: Performance Comparison of Advanced Allergen Detection Technologies
| Technology | Multiplexing Capability | Detection Limit | Key Strengths | Sample Throughput | Quantitative Capability |
|---|---|---|---|---|---|
| HSI & FTIR (with AI) | High (Multiple allergens simultaneously) | Varies by allergen and model [54] | Non-destructive, real-time monitoring, preserves sample integrity [21] | High (Rapid scanning) | Yes (With multivariate calibration) [54] |
| Mass Spectrometry (e.g., AllergenScreener) | High (Simultaneous analysis of regulated allergens) | High sensitivity for targeted peptides [55] | High specificity, robust in processed foods, definitive peptide identification [56] [55] | Medium (Requires chromatography) | Yes (Absolute quantification with standards) [55] |
| Optoelectrical Biosensors | High (e.g., 12-plex on DVD platform) | 0.26 IU/mL for IgE [57] | Cost-effective, portable, suitable for mobile labs [57] | High | Yes |
Detailed Experimental Protocols
Protocol: Near-Infrared (NIR) Spectroscopy for Multiple Allergen Detection in Gluten-Free Flour
This protocol outlines a reagent-free method for detecting sesame, peanut, and wheat flour adulterants in quinoa flour using NIR spectroscopy and multivariate analysis [54].
Research Reagent Solutions & Essential Materials
Table 2: Key Materials for NIR-Based Allergen Detection
| Item | Function/Description |
|---|---|
| Quinoa Flour | Gluten-free matrix for analysis [54] |
| Allergen Flours | Adulterants: Sesame, peanut, and wheat flour [54] |
| Benchtop NIR Spectrometer | Spectral acquisition (867–2535 nm) [54] |
| Filter-based NIR Device | Portable device with 10 discrete spectral bands [54] |
| Chemometrics Software | For multivariate analysis and model development [54] |
Sample Preparation and Data Acquisition
- Sample Preparation: Prepare binary mixtures by mixing pure quinoa flour with each allergenic flour (sesame, peanut, wheat) at concentrations ranging from 0% to 50% (w/w) [54].
- Spectral Acquisition: Load samples into a benchtop NIR spectrometer. Acquire spectra in the 867–2535 nm range. For each sample, collect 32 scans at a spectral resolution of 0.5 nm [54].
- Data Pre-processing: Apply spectral pre-processing techniques to reduce scatter and enhance spectral features. The Savitzky-Golay second derivative (SG-SD) has been shown to improve predictive performance [54].
Multivariate Model Development
- Model Calibration: Develop a Partial Least Squares Regression (PLSR) model using the pre-processed spectral data and known allergen concentrations.
- Wavelength Selection: Identify dominant wavelengths critical for allergen prediction. Research has demonstrated effective models using only 9 informative spectral bands, facilitating the development of low-cost, miniature sensors [54].
- Model Validation: Validate the model using an independent test set. Performance is evaluated using the Coefficient of Determination for Prediction (R²p) and Root Mean Square Error of Prediction (RMSEP). A reported optimized model achieved an R²p of 0.99 and RMSEP of 3.25% [54].
Diagram 1: NIR Allergen Detection Workflow
Protocol: Mass Spectrometry-Based Multiplex Allergen Detection in Bakery Goods
This LC-MS/MS method enables simultaneous detection and quantification of egg, milk, soy, almond, hazelnut, peanut, and sesame in processed bakery matrices like cookies and rusks [55].
Research Reagent Solutions & Essential Materials
- UHPLC System: For chromatographic separation.
- High-Resolution Mass Spectrometer: For accurate mass detection and quantification [55].
- Trypsin (Mass Spectrometry Grade): Enzyme for protein digestion [55].
- Allergen-Specific Proteotypic Peptides: Signature peptides for each target allergen (e.g., selected markers for milk, egg, peanut, soybean, hazelnut, almond) [55].
- Solvents: Acetonitrile, methanol, water (HPLC grade), formic acid [55].
- Buffers: Ammonium bicarbonate, Tris-HCl, dithiothreitol (DTT), iodoacetamide (IAA) [55].
Sample Preparation and Digestion
- Protein Extraction: Homogenize the bakery sample (e.g., cookie, rusk). Extract proteins using an appropriate buffer (e.g., Tris-HCl) [55].
- Protein Reduction and Alkylation: Add dithiothreitol (DTT) to reduce disulfide bonds. Subsequently, alkylate with iodoacetamide (IAA) to prevent reformation [55].
- Enzymatic Digestion: Digest the protein extract with trypsin at a 1:50 enzyme-to-substrate ratio. Incubate at 37°C for 4 hours or overnight to generate peptides [55].
- Peptide Clean-up: Desalt the digested peptide mixture using C18 solid-phase extraction (SPE) cartridges. Elute peptides with acetonitrile, concentrate, and reconstitute in a mobile phase for LC-MS injection [55].
LC-MS/MS Analysis and Data Processing
- Chromatographic Separation: Inject the purified peptide extract onto a reversed-phase C18 UHPLC column. Use a gradient of water/acetonitrile with 0.1% formic acid for separation [56] [55].
- Mass Spectrometric Detection: Operate the mass spectrometer in positive electrospray ionization (ESI+) mode. Acquire data using a targeted method such as Parallel Reaction Monitoring (PRM) to monitor specific proteotypic peptides and their fragment ions [55].
- Data Analysis: Use specialized software (e.g., included with the AllergenScreener solution) to automatically integrate peaks, identify peptides based on accurate mass and fragmentation pattern, and quantify allergens against calibration curves [56].
Diagram 2: MS Allergen Analysis Workflow
Protocol: Optoelectrical Biosensor for Multiplexed Allergy Diagnosis
This protocol describes a DVD-based biosensor for the simultaneous determination of allergen-specific IgE and IgG antibodies in human serum, demonstrating the integration of biosensors for diagnostic applications [57].
Research Reagent Solutions & Essential Materials
- DVD Substrate: A regular digital versatile disc (DVD) serves as the platform for immobilizing allergen extracts in a microarray format [57].
- Allergen Panel: A panel of 12 allergen extracts or pure proteins immobilized on the DVD surface [57].
- Immunogold-Silver Reagents: Antibodies conjugated to gold nanoparticles for signal amplification via silver deposition [57].
- Optoelectrical Reader: A custom reader system designed to interrogate the DVD microarray [57].
- Human Serum Samples: Clinical samples for allergy diagnosis validation [57].
Assay Procedure
- Sample Incubation: Incubate the patient serum sample on the DVD microarray, allowing allergen-specific IgE and IgG antibodies to bind to their corresponding immobilized allergens [57].
- Signal Amplification: Add anti-human IgE and IgG antibodies conjugated to gold nanoparticles. Subsequently, enhance the signal through silver deposition on the gold nanoparticles [57].
- Signal Detection: Scan the DVD microarray using the optoelectrical reader. The system autonomously quantifies the signal intensity for each allergen spot, providing a multiplexed sensitization profile [57]. This system achieved a limit of detection of 0.26 IU/mL for IgE antibodies and showed 97.6% sensitivity and 85.7% specificity compared to clinical reference standards [57].
Integration with Biosensor Systems for On-Site Detection
The technologies described herein are highly amenable to integration into biosensor systems for rapid on-site allergen detection. HSI and FTIR, enhanced with AI and machine learning, enable non-destructive, real-time screening without complex sample preparation [21]. The identification of key wavelengths in NIR studies allows for the development of simplified, low-cost filter-based sensors that can be deployed in field settings [54]. Furthermore, microfluidic biosensors incorporating optical detection methods (colorimetric, fluorescence, SERS) show significant promise for portable, high-throughput analysis [58] [59]. These systems can be designed for simplicity, making them suitable for use in non-laboratory environments without sacrificing analytical performance [57] [58].
The multiplexed and non-destructive diagnostic technologies detailed in this application note—HSI/FTIR, Mass Spectrometry, and advanced biosensors—provide powerful tools for advancing research in rapid on-site allergen detection. The structured protocols and performance data offer a foundation for scientists and drug development professionals to implement these methods in their laboratories and development pipelines. As these technologies continue to mature, their integration into automated, data-driven biosensor systems will be critical for enhancing consumer safety, improving regulatory compliance, and enabling more personalized allergy management.
Optimizing Performance and Overcoming Real-World Deployment Hurdles
For biosensor systems designed for rapid on-site allergen detection, the interface between the physical transducer and the biological recognition element is the critical determinant of overall performance. The stability, orientation, and surface density of bioreceptors directly impact key analytical parameters, including sensitivity, selectivity, and shelf-life [60] [61]. Within the specific context of food safety, where allergens may be present in trace amounts within complex matrices, maximizing bioreceptor stability is not merely an optimization goal but a fundamental requirement for developing reliable point-of-care diagnostic tools [60] [62]. This document details application notes and standardized protocols for the functionalization of transducer surfaces, with a focused aim on enhancing the stability of immobilized bioreceptors for allergen biosensing.
The strategic combination of advanced interfacial chemistry and nanomaterial integration provides a robust pathway to biosensors that meet the rigorous demands of field-based allergen testing [60]. This involves a multi-stage process encompassing surface activation, molecular coupling, and thorough characterization, each step of which must be meticulously controlled and optimized.
Core Principles and Key Concepts
The Role of Surface Functionalization in Biosensor Performance
A biosensor's functionality hinges on the efficient transduction of a biological binding event into a quantifiable signal. The functionalized interface is the platform on which this occurs. An effectively designed surface must achieve two primary objectives:
- Stable Immobilization: Covalently anchor bioreceptors (e.g., antibodies, aptamers) to prevent leaching during operation or storage.
- Optimal Orientation: Ensure the active binding sites of the bioreceptors are oriented towards the sample solution, maximizing analyte capture efficiency [63].
Failure to adequately address these points can lead to reduced sensitivity, increased non-specific binding, and poor sensor-to-sensor reproducibility, ultimately undermining the reliability of the on-site test [61].
Selection of Bioreceptors for Allergen Detection
The choice of bioreceptor is dictated by the specific allergen target and the intended operational environment. The following table summarizes common bioreceptors used in allergen detection biosensors.
Table 1: Comparison of Bioreceptors for Allergen Biosensing
| Bioreceptor | Example Target | Key Advantages | Key Limitations |
|---|---|---|---|
| Antibodies [60] [62] | Shrimp Tropomyosin, Fish Parvalbumin | High specificity and affinity; well-established protocols. | Susceptible to denaturation under non-physiological conditions; batch-to-batch variation; cost. |
| Aptamers [62] [64] | β-lactoglobulin, Major shrimp allergen | High stability; can be chemically synthesized for consistency; amenable to site-specific modification. | Requires an in vitro selection process (SELEX); stability of secondary structure can be context-dependent. |
| Nucleic Acids [60] [62] | Allergen-encoding genes (DNA) | High stability of DNA; effective for detecting allergen sources via PCR. | Does not directly detect the allergenic protein; correlation with protein allergenicity can be variable. |
Experimental Protocols for Surface Functionalization
This section provides a detailed, step-by-step methodology for functionalizing a silicon-based transducer surface, optimized for the immobilization of thiol-modified aptamers—a strategy noted for its high performance and orientation control [64].
Protocol: Mercaptosilane-Aptamer Functionalization
Principle: This protocol utilizes a mercaptosilane to create a thiol-reactive monolayer on the sensor surface. Thiol-terminated aptamers then form directional covalent bonds (thioethers) via a heterobifunctional crosslinker, promoting a uniform upright orientation that minimizes steric hindrance [64].
Materials:
- Substrates: Silicon/Silicon Nitride chips (e.g., from a microfabrication facility).
- Reagents:
- 3-Mercaptopropyltrimethoxysilane (MPTMS)
- Anhydrous Toluene
- Heterobifunctional Crosslinker (e.g., GMBS or SMCC)
- Thiol-modified Aptamer (1 µM stock in appropriate buffer)
- 6-Mercapto-1-hexanol (MCH)
- Ethanolamine (for alternative epoxy chemistry)
- Phosphate Buffered Saline (PBS), pH 7.4
- Equipment:
Procedure:
- Surface Cleaning and Activation:
- Place the substrate in a plasma cleaner.
- Treat with Argon plasma for 5-10 minutes at medium power. This step removes organic contaminants and activates the surface by increasing the density of surface silanol (Si-OH) groups, which is crucial for subsequent silanization [64].
Silanization with Mercaptosilane:
- Immediately after plasma treatment, prepare a 1% (v/v) solution of MPTMS in anhydrous toluene.
- Immerse the activated substrates in the MPTMS solution for 1-2 hours at room temperature within a sealed container to prevent moisture ingress.
- Rinse thoroughly with toluene followed by ethanol to remove physisorbed silane.
- Cure the silanized surface at 100-120°C for 15-30 minutes to complete the covalent Si-O-Si bonding [64].
Crosslinker Coupling:
- Prepare a solution of the heterobifunctional crosslinker (e.g., 1-2 mM) in a volatile organic solvent like DMSO or ethanol.
- Incubate the mercaptosilane-modified substrate in the crosslinker solution for 30-60 minutes.
- Rinse extensively with ethanol and PBS to remove unreacted crosslinker.
Aptamer Immobilization:
- Incubate the functionalized surface with a 1 µM solution of the thiol-modified aptamer in an appropriate immobilization buffer (e.g., PBS) for 3 hours at room temperature [64].
- Rinse with PBS to remove loosely bound aptamers.
Surface Passivation:
- To minimize non-specific adsorption, incubate the sensor with a 1 mM solution of 6-Mercapto-1-hexanol (MCH) for 30-60 minutes. This short-chain alkanethiol occupies any remaining reactive sites on the gold or the silane layer, creating a hydrophilic and anti-fouling background [64].
- A final rinse with PBS completes the functionalization process. The biosensor is now ready for use or characterization.
The following workflow diagram illustrates the key chemical steps in this protocol:
Diagram 1: Surface functionalization workflow for biosensors.
Protocol Validation and Characterization Methods
Rigorous characterization after each functionalization step is crucial for protocol optimization and ensuring batch-to-batch consistency.
Table 2: Surface Characterization Techniques for Functionalized Biosensors
| Technique | Measured Parameter | Purpose in Functionalization | Target Outcome |
|---|---|---|---|
| Spectroscopic Ellipsometry [61] | Layer Thickness | Monitor the growth of the molecular layer (silane, protein, etc.). | Confirmation of a homogeneous monolayer with expected thickness (~1-3 nm per layer). |
| Atomic Force Microscopy (AFM) [63] [61] | Surface Topography & Roughness | Assess the homogeneity and uniformity of the deposited layers. | A smooth, homogeneous surface indicating even coverage and absence of aggregates. |
| X-ray Photoelectron Spectroscopy (XPS) [63] | Elemental & Chemical Composition | Detect characteristic elements (e.g., N from aptamers, S from silane) to confirm successful grafting. | Appearance of element-specific peaks (N1s, S2p) and disappearance of substrate-specific signals. |
| Time-of-Flight SIMS (ToF-SIMS) [61] | Molecular Fragment Fingerprinting | Identify characteristic fragments from biomolecules (proteins, aptamers) on the surface. | Detection of unique secondary ions corresponding to the immobilized bioreceptor. |
The Scientist's Toolkit: Essential Research Reagents
The following table catalogues the key reagents and materials essential for executing the surface functionalization protocols described herein.
Table 3: Key Research Reagent Solutions for Surface Functionalization
| Reagent / Material | Function / Application | Notes & Optimization Tips |
|---|---|---|
| 3-Mercaptopropyltrimethoxysilane (MPTMS) [64] | Organosilane providing thiol (-SH) groups for covalent aptamer attachment. | Use anhydrous conditions to prevent polymerization. A 1% v/v concentration in toluene is optimal for a uniform monolayer [64]. |
| 3-Glycidyloxypropyltrimethoxysilane (GPTMS) [64] | Organosilane providing epoxy groups for immobilizing amines on proteins or aptamers. | Compared to mercaptosilane, may yield less homogeneous layers and lower sensitivity in some biosensor configurations [64]. |
| Thiol-Modified Aptamer [62] [64] | Bioreceptor; thiol group allows for directed, covalent immobilization. | A concentration of 1 µM for immobilization is effective. Spacer sequences (e.g., poly-T) can be added to reduce steric hindrance. |
| 6-Mercapto-1-hexanol (MCH) [64] | Passivation agent; blocks non-specific binding sites. | Critical for reducing background signal. Incubation time and concentration (e.g., 1 mM for 1 hr) should be optimized for each system. |
| Heterobifunctional Crosslinkers (e.g., GMBS, SMCC) | Links silane layer to bioreceptor; features two different reactive groups (e.g., NHS-ester and maleimide). | Enables controlled, oriented immobilization. The choice depends on the functional groups on the surface and bioreceptor. |
| Argon Plasma [64] | Surface activation; cleans and generates reactive silanol groups. | Preferred over oxygen plasma for some surfaces due to better performance in creating a homogeneous functional layer [64]. |
Concluding Framework for Allergen Biosensor Implementation
The successful implementation of a robust biosensor system for on-site allergen detection relies on a deeply integrated approach. The functionalization protocol is not an isolated step but is intrinsically linked to the transducer design, the sample matrix, and the fluidic system responsible for delivering the analyte.
- Integration with Flow Cells: The design of the flow cell used for analyte delivery is critical. Inefficient designs can lead to the formation of recirculating flow regions (eddies), where analyte transport is diffusion-limited, slowing down the sensor response and reducing efficiency. A gradually expanding "iCell" design has been shown to minimize eddy formation, ensuring a direct relationship between the influent analyte concentration and the concentration at the sensor surface [65].
- Future Perspectives: Emerging technologies like 3D bioprinting of bioinks offer future potential for creating more complex and biomimetic sensing interfaces, which could further enhance sensitivity and stability for allergen detection [66].
In conclusion, the meticulous application of the principles and protocols outlined in this document provides a clear pathway toward achieving the high levels of bioreceptor stability required for dependable, rapid, and on-site detection of food allergens, thereby contributing significantly to the advancement of food safety and public health.
Combating Non-Specific Binding and Matrix Effects in Complex Food Samples
The implementation of robust biosensor systems for the rapid, on-site detection of food allergens represents a significant advancement in public health safety. However, the analytical performance of these biosensors is critically dependent on their ability to overcome two fundamental challenges in complex food matrices: non-specific binding (NSB) and matrix effects. NSB occurs when biorecognition elements interact with non-target molecules, compromising specificity, while matrix effects arise from unwanted interactions between the sample matrix and the analyte or sensor surface, skewing quantitative results [67] [68]. These phenomena are particularly pronounced in food samples due to the presence of fats, proteins, lipids, pigments, and other interfering components [68]. This Application Note provides detailed protocols and quantitative frameworks for researchers and drug development professionals to characterize, quantify, and mitigate these issues, thereby ensuring the reliability of biosensor data within rapid allergen detection systems.
Quantitative Analysis of Matrix Effects and NSB
A critical first step in assay development is the quantitative assessment of matrix effects and NSB. The following data, compiled from recent studies, provides benchmark values and acceptable thresholds.
Table 1: Quantification and Impact of Matrix Effects in Analytical Methods
| Food Matrix | Analyte | Analytical Technique | Matrix Effect | Impact/Outcome | Citation |
|---|---|---|---|---|---|
| Egg | Fipronil | LC-MS | 30% Suppression | Potential under-reporting of accurate concentrations | [67] |
| Soybean | Picolinafen | LC-MS | 40% Enhancement | Potential over-reporting of accurate concentrations | [67] |
| Various Foods | Acrylamide | ELISA | Variable; Cross-reactivity | False-positive results or reduced assay specificity | [68] |
| Instant Coffee | Acrylamide | LC-MS/MS | Significant without cleanup | Unreliable results; requires effective sample clean-up | [68] |
Table 2: Experimental Performance of Emerging Biosensors for Allergen Detection
| Biosensor Platform | Target Allergen(s) | Sample Matrix | Key Performance Metrics | Reported Challenges | Citation |
|---|---|---|---|---|---|
| iEAT2 (Electrochemical) | Gliadin, Ara h 1, Ovalbumin | Real-world food samples | Detection below allergic thresholds; <15 min protocol; identifies cross-contamination | Requires sample pre-processing to simplify allergen extraction | [3] [7] |
| Microfluidic ELISA | Gluten, Ara h 1 | Biscuits, gluten-free flour | Total assay time: 15-20 min; Sample consumption: 5-10 µL | Complex chip fabrication can limit portability | [6] |
| SweetTrac1 (Fluorescent) | Glucose (Model System) | - | Functional transporter with kinetics similar to wild-type | Biosensor response can be abolished by point mutations near binding site | [69] |
Experimental Protocols
Protocol 1: Determining Matrix Effects via Post-Extraction Addition
This protocol is essential for evaluating the impact of the co-extracted matrix on the detection of the analyte [67].
1. Reagents and Materials:
- Pure solvent (e.g., 75:25 water:acetonitrile)
- Representative blank food matrix (e.g., raw egg, soybean, gluten-free flour)
- Stock solution of the target analyte
- Standard extraction reagents and equipment (e.g., QuEChERS kits, centrifuges, filters)
2. Procedure:
A. Sample Preparation:
i. Extract the representative blank food matrix using your standard procedure (e.g., with QuEChERS).
ii. Ensure the final extract is in the same solvent composition as your pure solvent standard.
B. Standard Preparation:
i. Prepare at least five (n=5) replicate standards of a fixed analyte concentration in pure solvent (Solution A).
ii. Spike the same concentration of analyte into the extracted blank matrix after the extraction is complete (Solution B).
C. Data Acquisition:
i. Analyze all samples (A and B) in a single analytical run under identical instrument conditions.
D. Calculation:
i. For each replicate, calculate the Matrix Effect (ME) factor using the formula:
ME (%) = [(B - A) / A] × 100
where A is the peak response of the analyte in the solvent standard and B is the peak response in the matrix-matched standard [67].
ii. A result less than 0% indicates suppression; greater than 0% indicates enhancement. Best practice recommends action if effects exceed ±20% [67].
Protocol 2: Assessing Analyte Recovery and NSB
This protocol evaluates the efficiency of the extraction process and can indicate NSB to the matrix [67].
1. Procedure:
A. Sample Preparation:
i. Spike the target analyte into the representative blank food matrix before extraction (Solution C).
ii. Perform the standard extraction procedure.
B. Data Acquisition and Calculation:
i. Analyze the pre-extraction spiked samples (C) alongside the pure solvent standards (A) from Protocol 1.
ii. Calculate the analyte Recovery (R) using the formula:
R (%) = (C / A) × 100
where C is the peak response of the analyte spiked into the matrix before extraction, and A is the response in the solvent standard [67].
iii. A recovery significantly different from 100% indicates poor extractability or potential NSB losses during sample preparation.
Protocol 3: Verifying Biosensor Specificity via Site-Directed Mutagenesis
This protocol, derived from the development of the SweetTrac1 biosensor, confirms that the signal response is due to specific binding at the intended site [69].
1. Procedure: A. Generate Mutants: i. Identify key amino acids in the binding pocket of the biorecognition element (e.g., antibody, transporter) through homology modeling or structural data. ii. Create mutant variants with point mutations at these critical residues (e.g., P23A, N73A). B. Functional Assay: i. Express the wild-type and mutant biosensors in a suitable host system (e.g., yeast EBY4000 strain). ii. Measure the sensor's response (e.g., fluorescence change, electrochemical signal) to the target analyte. C. Interpretation: i. Mutations that abolish the functional response (e.g., signal change, transport activity) without affecting the proper localization of the biosensor protein confirm that the signal is generated by specific binding at the target site, not by NSB [69].
The Scientist's Toolkit: Key Research Reagent Solutions
Table 3: Essential Reagents and Materials for Biosensor Development and Validation
| Reagent/Material | Function/Application | Example Use Case |
|---|---|---|
| Immunomagnetic Beads | Capture and concentrate target allergens from complex food extracts, simplifying washing steps and reducing matrix interference. | iEAT2 system for retrieving allergens [3]. |
| Horseradish Peroxidase (HRP) | Enzyme label for signal amplification in immunoassays. Catalyzes a substrate to produce a detectable electrochemical or colorimetric signal. | Used in conjunction with TMB substrate in the iEAT2 and microfluidic ELISA [3] [6]. |
| 3,3',5,5'-Tetramethylbenzidine (TMB) | A chromogenic and electroactive substrate for HRP. Produces a blue color or generates a measurable current upon enzymatic reduction. | Standard substrate in ELISA and electrochemical biosensors [3] [6]. |
| Circularly Permutated GFP (cpsfGFP) | A genetically encoded fluorescent reporter for constructing conformational biosensors for transporters or other proteins. | Core component of the SweetTrac1 glucose transporter biosensor [69]. |
| Anti-Gliadin & Anti-Ara h 1 Antibodies | Biorecognition elements that provide high specificity for the target food allergens. | Critical for the detection of gluten and peanut allergens in the iEAT2 and microfluidic ELISA [3] [6]. |
| Polydimethylsiloxane (PDMS) | A silicone-based organic polymer used for rapid prototyping of microfluidic chips via soft lithography. | Fabrication of microfluidic channels for integrated ELISA assays [6]. |
Workflow and Signaling Pathways
The following diagram illustrates the integrated workflow for developing and validating a biosensor, incorporating steps to combat NSB and matrix effects.
The integration of artificial intelligence (AI) and machine learning (ML) represents a paradigm shift in the development and operation of biosensors, particularly for rapid on-site allergen detection. In 2025, AI design has transitioned from theoretical promise to applied intelligence at scale, transforming how we conceive, simulate, and optimize analytical systems [70]. For researchers focused on allergen detection, AI-enhanced biosensors offer transformative capabilities: they move beyond simple presence/absence determinations to provide intelligent quantification, pattern recognition, and predictive analytics in complex food matrices.
Modern AI biosensing leverages a hybrid intelligence approach, where general-purpose large language models orchestrate complex workflows while specialized domain-tuned networks handle structured pattern recognition and optimization within defined boundaries [70]. This synergy is particularly valuable for allergen detection, where matrix effects, cross-reactivity, and low concentration targets present persistent challenges. The emergence of Food Safety 4.0 conceptualizes this transformation, embracing a proactive, data-driven approach that harnesses advanced digital technologies to predict, prevent, and swiftly address food safety risks [71].
Table 1: Core Advantages of AI-Enhanced Biosensors for Allergen Detection
| Feature | Traditional Biosensors | AI-Enhanced Biosensors |
|---|---|---|
| Multiplexing Capability | Typically single analyte detection | Simultaneous detection of multiple allergens |
| Data Analysis | Manual interpretation required | Autonomous analysis with real-time processing |
| Decision Support | Passive data reporting | Predictive analytics and risk assessment |
| Adaptability | Fixed operational parameters | Continuous learning and optimization |
| Signal Interpretation | Prone to matrix interference | Advanced noise suppression and pattern recognition |
AI-Optimized Sensor Design Methodologies
Computational Probe Selection Using Neuromorphic AI
The design of biorecognition elements represents a critical bottleneck in biosensor development. Traditional approaches rely on extensive trial-and-error experimentation, consuming significant resources. A powerful new method using spiking graph neural networks—AI models that mimic human brain signaling—has demonstrated remarkable efficiency in optimizing chemical sensor design [72].
Experimental Protocol: AI-Driven Probe Selection
- Step 1: Curate training data from scientific literature on molecular interactions, with particular emphasis on protein-protein interactions and antibody-epitope binding relevant to common allergens (e.g., peanut Ara h 1, gluten peptides).
- Step 2: Implement a spiking graph neural network architecture capable of processing structural and physicochemical properties of potential probe molecules and target allergens.
- Step 3: Train the model to predict binding affinity and specificity, using transfer learning to compensate for limited allergen-specific data.
- Step 4: Deploy the trained model to screen virtual libraries of potential probe candidates (antibodies, aptamers, molecularly imprinted polymers).
- Step 5: Validate top candidates through synthesis and experimental testing, with results fed back to refine model accuracy.
This approach has demonstrated approximately 90% accuracy in predicting effective sensor materials, dramatically accelerating the initial design phase [72]. For allergen detection, this enables rapid development of sensors targeting emerging allergenic proteins or complex epitope variants.
Performance Optimization via Multi-Objective Learning
Sensor performance optimization involves balancing multiple competing objectives: sensitivity, specificity, response time, and stability. Machine learning excels at this multi-parameter optimization through reinforcement learning frameworks that systematically explore the design space.
Diagram 1: AI-driven sensor optimization workflow
Advanced Data Analysis Protocols
Signal Processing and Enhancement
AI dramatically enhances the quality of biosensor signals, particularly when detecting low concentrations of allergens in complex matrices. Deep learning architectures, particularly convolutional neural networks (CNNs) and recurrent neural networks, can suppress noise, correct for drift, and extract meaningful signals from noisy data.
Experimental Protocol: AI-Enhanced Signal Processing
- Step 1: Collect raw sensor data across multiple concentrations of target allergens in various food matrices (dairy, baked goods, sauces).
- Step 2: Apply data augmentation techniques to expand the training dataset, including synthetic noise injection and signal transformation.
- Step 3: Train a CNN-based denoising algorithm on paired clean and noisy signals, using wavelet transform pre-processing for optimal feature extraction.
- Step 4: Implement a Long Short-Term Memory (LSTM) network for drift correction by learning temporal patterns in baseline signals.
- Step 5: Integrate the trained models into the sensor's data processing pipeline for real-time signal enhancement.
This approach has demonstrated capability to improve signal-to-noise ratios by >95% in some electrochemical biosensors, enabling detection of low-contrast signals in complex backgrounds [73] [74].
Multi-analyte Pattern Recognition for Cross-Reactivity Management
A significant challenge in allergen detection is distinguishing between true targets and cross-reactive species. ML algorithms excel at identifying subtle patterns in multi-analyte data that may be imperceptible to human analysts.
Table 2: Performance Metrics of ML Algorithms for Allergen Classification
| Algorithm Type | Average Accuracy | Precision | Recall | Best Use Case |
|---|---|---|---|---|
| Support Vector Machine | 92.5% | 0.91 | 0.89 | Limited training data |
| Random Forest | 95.8% | 0.94 | 0.96 | Complex matrix effects |
| Convolutional Neural Network | 97.2% | 0.96 | 0.97 | Spectral data analysis |
| Graph Neural Network | 96.5% | 0.95 | 0.95 | Structure-activity relationships |
Experimental Protocol: Cross-Reactivity Mitigation
- Step 1: Generate a comprehensive dataset of sensor responses to target allergens and common cross-reactive species.
- Step 2: Extract multi-dimensional features from sensor responses, including temporal patterns, amplitude characteristics, and spectral properties.
- Step 3: Train a supervised ensemble classifier (Random Forest or Gradient Boosting) to distinguish target-specific signals from cross-reactivity.
- Step 4: Validate model performance with blinded samples containing mixtures of target and interfering substances.
- Step 5: Deploy the trained model with confidence scoring to flag potentially ambiguous results for further verification.
This approach has demonstrated capabilities to reduce false positives by up to 85% while maintaining high sensitivity for true positives [73].
Integrated Experimental Workflows
The power of AI-enhanced biosensing is fully realized when computational design, data acquisition, and signal processing are integrated into a seamless workflow.
Diagram 2: End-to-end AI-enhanced biosensing workflow
The Scientist's Toolkit: Research Reagent Solutions
Table 3: Essential Research Reagents for AI-Enhanced Allergen Biosensing
| Reagent/Material | Function | AI Integration Purpose |
|---|---|---|
| Functionalized Nanoparticles | Signal amplification | Provide multi-dimensional response patterns for ML analysis |
| Multiplexed Array Platforms | Simultaneous multi-analyte detection | Generate rich datasets for pattern recognition algorithms |
| Synthetic Allergen Analogs | Positive controls and calibration | Training and validation of detection algorithms |
| Stable Reference Materials | Signal normalization and quality control | Enable longitudinal model performance monitoring |
| Blocking Protein Mixtures | Reduction of non-specific binding | Improve signal-to-noise ratio for better classification |
| Modular Biorecognition Elements | Target capture and signal generation | Facilitate rapid sensor reconfiguration for new targets |
Implementation Protocols for Allergen Detection Systems
Field Deployment Configuration
For rapid on-site allergen detection, the integration of AI capabilities with portable biosensing platforms requires specialized implementation protocols.
Experimental Protocol: Field-Ready AI Biosensor Deployment
- Step 1: Pre-train core detection models on extensive laboratory data before field deployment.
- Step 2: Implement edge-computing optimized model architectures (quantized neural networks, random forests) for resource-constrained environments.
- Step 3: Design a hybrid cloud-edge processing system where complex analyses are performed locally while model updates are managed centrally.
- Step 4: Establish continuous learning protocols with human-in-the-loop verification to maintain performance while avoiding model drift.
- Step 5: Integrate results with blockchain-based traceability systems for supply chain transparency [71].
Validation and Quality Assurance
Rigorous validation is essential for AI-enhanced biosensors, particularly for regulatory acceptance in food safety applications.
Experimental Protocol: AI Model Validation Framework
- Step 1: Perform k-fold cross-validation with independent test sets representing diverse food matrices.
- Step 2: Implement uncertainty quantification methods to assess model confidence for each prediction.
- Step 3: Establish ongoing performance monitoring with statistical process control methods.
- Step 4: Conduct regular challenge tests with blinded samples to detect model degradation.
- Step 5: Maintain comprehensive version control for all model iterations and training data.
The future of allergen detection lies in increasingly autonomous systems that continuously self-optimize through reinforcement learning and synthetic feedback [70]. As these technologies mature, we anticipate the emergence of self-learning detection systems capable of adapting to novel food formulations and emerging allergenic threats without requiring complete redesign. For researchers and drug development professionals, mastery of these AI-enhanced optimization techniques will be essential for developing next-generation biosensing platforms that deliver unprecedented reliability, speed, and intelligence in allergen detection.
Strategies for Scalability and Sustainable Biosensor Manufacturing
The effective translation of biosensing technologies from laboratory research to widespread commercial and clinical use is critically dependent on overcoming two major challenges: scalability and sustainability. Scalability ensures that manufacturing processes can reliably produce high-performance biosensors in large volumes, while sustainability focuses on minimizing environmental impact throughout the device lifecycle. For applications such as rapid on-site allergen detection, where devices may be designed for single-use or widespread deployment, addressing these challenges becomes paramount. This document outlines key strategies, materials, and quality control measures that enable the manufacturing of biosensors that are both scalable for mass production and environmentally responsible.
The convergence of advanced nanomaterials and innovative fabrication techniques has created new pathways for developing biosensors that balance performance with production efficiency. Research indicates that selecting appropriate manufacturing approaches and materials can significantly reduce costs while maintaining analytical precision, particularly for food safety applications including allergen detection [75]. Furthermore, implementing robust quality control protocols during manufacturing ensures consistency across production batches—a crucial requirement for regulatory approval and clinical adoption [76].
Sustainable Materials and Fabrication Techniques
Principles of Sustainable Biosensor Design
Sustainable biosensor design incorporates environmental considerations across the entire device lifecycle, from material sourcing to end-of-life disposal. The core principles include:
- Eco-Friendly Materials: Utilizing renewable, biodegradable, or recyclable materials such as bioplastics, paper-based substrates, and bioderived nanomaterials to reduce dependence on non-renewable resources [77]
- Resource Efficiency: Minimizing consumption of energy, water, and raw materials during manufacturing and operation through process optimization and miniaturization [77]
- Waste Reduction: Designing for minimal waste generation during production, operation, and disposal by incorporating biodegradable components and closed-loop systems [77]
- Reduced Toxicity: Eliminating or minimizing toxic chemicals and hazardous substances used in biosensor fabrication and operation [77]
Low-Cost Substrates and Fabrication Methods
Recent advances have demonstrated several promising approaches for fabricating biosensors using economical substrates and simplified manufacturing processes:
Paper-based electrochemical sensors provide a particularly attractive platform due to paper's low cost, renewability, and biodegradability. When combined with electrode fabrication methods such as stencil printing or pencil drawing, these sensors can be produced with minimal equipment requirements [78]. Paper-based microfluidic devices enable liquid handling without external pumps, further simplifying device architecture and reducing costs.
Laser-ablated gold leaf electrodes (GLEs) represent another innovative approach that combines cost-effectiveness with high performance. This method involves laminating gold leaves onto polyvinyl chloride (PVC) adhesive sheets followed by laser ablation to create customizable electrode geometries with micro-scale resolution [75]. The process eliminates the need for expensive vacuum deposition systems and cleanroom facilities, significantly reducing production costs while maintaining the excellent conductivity and biocompatibility of gold.
Table 1: Comparison of Low-Cost Fabrication Techniques for Biosensors
| Fabrication Method | Required Materials | Advantages | Limitations | Best Applications |
|---|---|---|---|---|
| Screen Printing [78] | Conductive inks, screens, various substrates | Scalable, cost-effective for mass production | Reproducibility challenges, ink impurities | Disposable electrodes, point-of-care devices |
| Stencil Printing [78] | Conductive inks, stencil masks, substrates | Design flexibility, low equipment cost | Manual alignment issues, resolution limits | Rapid prototyping, custom electrode designs |
| Pencil Drawing [78] | Graphite pencils, paper substrates | Extremely low cost, no specialized equipment | Limited conductivity, reproducibility issues | Educational tools, ultra-low-cost sensors |
| Laser Ablation [75] | Gold leaves, adhesive sheets, laser system | High precision, customizable designs, excellent conductivity | Initial equipment investment | High-performance sensors, research applications |
| 3D Bioprinting [66] | Bioinks, 3D bioprinter | Complex 3D structures, integrated biosensing | Specialized equipment, bioink optimization | Tissue-integrated sensors, organ-on-chip models |
Green Nanomaterials
The incorporation of green nanomaterials—synthesized using biological precursors or through environmentally benign processes—represents a significant advancement in sustainable biosensor design. Plant-derived nanoparticles and bio-based nanomaterials offer advantages including biocompatibility, abundance, and reduced environmental impact compared to conventionally synthesized nanomaterials [79]. These materials can serve multiple functions in biosensors, including as sensing elements, signal amplifiers, and immobilization matrices, while aligning with green chemistry principles.
Scaling Biosensor Manufacturing: Quality Control and Standardization
Quality Control Framework for Reproducible Biosensors
Achieving consistent performance across production batches requires implementing robust quality control (QC) measures throughout the manufacturing process. Recent research demonstrates that incorporating embedded redox probes such as Prussian blue nanoparticles (PB NPs) enables real-time monitoring of critical fabrication steps, significantly improving reproducibility [76].
A comprehensive QC strategy for molecularly imprinted polymer (MIP) biosensors includes four key checkpoints:
- QC1: Bare Electrode Assessment: Visual inspection and verification of proper storage conditions for unmodified electrodes [76]
- QC2: Redox Probe Deposition Monitoring: Tracking the electrodeposition of embedded PB NPs through cyclic voltammetry to ensure consistent surface modification [76]
- QC3: Polymerization Control: Monitoring electropolymerization of MIP films using real-time electrochemical data to achieve uniform thickness and morphology [76]
- QC4: Template Extraction Verification: Confirming complete removal of template molecules through electrochemical signaling before biosensor use [76]
This systematic approach has demonstrated remarkable improvements in reproducibility, reducing relative standard deviation (RSD) from 9.68% to 2.05% for agmatine detection and from 11.67% to 1.44% for glial fibrillary acidic protein (GFAP) detection [76].
Manufacturing Protocols for Specific Biosensor Types
Application: Electrochemical transducing platform for detection of food-borne pathogens (Salmonella typhimurium and Listeria monocytogenes)
Materials:
- 24-karat gold leaves
- Polyvinyl chloride (PVC) adhesive sheets
- Laser ablation system
- Polytetrafluoroethylene (PTFE) spray
- Magnetic beads functionalized with specific antibodies
Procedure:
- Surface Preparation: Apply dry lubricant PTFE spray to a clean, flat surface to prevent adhesion
- Gold Leaf Lamination: Carefully place gold leaf foil (80 × 80 mm) onto the PVC adhesive sheet
- Laser Patterning: Use laser ablation to create specific electrode geometries with micro-scale resolution
- Electrochemical Characterization: Validate electrode performance using cyclic voltammetry and electrochemical impedance spectroscopy in 10 mM ferri/ferrocyanide redox couple in PBS
- Biofunctionalization: Immobilize specific aptamers or antibodies onto the electrode surface for target capture
Performance Metrics:
- Completed within 15 minutes from sample processing to detection [7]
- Detection of multiple allergens at concentrations below established allergic reaction thresholds [7]
- Effective identification of cross-contamination events in real-world food samples [7]
Application: Reproducible detection of metabolites and proteins for clinical diagnostics
Materials:
- Screen-printed electrodes
- Prussian blue nanoparticles
- Functional monomers (pyrrole)
- Template molecules (target analytes)
- Cross-linking agents
- Extraction solvents
Procedure:
- QC1: Electrode Screening: Visually inspect bare electrodes and verify proper storage conditions
- QC2: Redox Probe Deposition: Electrodeposit PB NPs while monitoring current intensity to ensure consistent modification
- QC3: Electropolymerization: Form MIP films by electropolymerizing pyrrole in the presence of template molecules, tracking polymer growth electrochemically
- QC4: Template Extraction: Remove template molecules using either electro-cleaning or solvent extraction, verifying completeness through electrochemical measurements
- Validation: Test biosensor response against target analytes using square wave voltammetry or electrochemical impedance spectroscopy
Performance Metrics:
- 79% reduction in RSD for agmatine detection (2.05% with QC vs. 9.68% without) [76]
- 87% reduction in RSD for GFAP detection (1.44% with QC vs. 11.67% without) [76]
- Significant improvement in biosensor success rates compared to bare screen-printed electrodes [76]
The Scientist's Toolkit: Essential Research Reagents and Materials
Table 2: Key Research Reagent Solutions for Biosensor Development
| Reagent/Material | Function | Example Applications | Sustainability Considerations |
|---|---|---|---|
| Paper substrates [78] | Low-cost, biodegradable platform for electrode fabrication | Paper-based electrochemical sensors, microfluidic devices | Renewable resource, biodegradable, reduces electronic waste |
| Gold leaves [75] | Cost-effective conductive material for electrodes | Gold leaf electrodes (GLEs) for pathogen detection | Reduced material usage compared to solid gold electrodes |
| Prussian blue nanoparticles (PB NPs) [76] | Embedded redox probe for quality control during manufacturing | Monitoring electropolymerization and template extraction in MIP biosensors | Enables reproducibility, reducing waste from failed productions |
| Molecularly imprinted polymers (MIPs) [37] [76] | Biomimetic recognition elements with high stability | Allergen detection, metabolite sensing, protein detection | Reusable, longer shelf-life than biological receptors, reduced reagent consumption |
| Magnetic beads (MBs) [75] | Target preconcentration and separation | Pathogen detection, protein isolation, DNA extraction | Enables sample purification, reducing interference and improving sensitivity |
| Bioplastics [77] | Sustainable substrate material | Device housings, microfluidic chips | Renewable sourcing, biodegradable options |
| Plant-derived nanomaterials [79] | Green nanomaterials for sensing and signal amplification | Sustainable nano-biosensors, environmental monitoring | Biocompatible, reduced toxicity, from renewable sources |
Implementation Workflows for Scalable Biosensor Production
The following diagrams illustrate key processes and relationships in scalable, sustainable biosensor manufacturing.
Sustainable Electrode Fabrication Workflow
Quality Control Protocol for MIP Biosensors
The integration of scalable manufacturing approaches with sustainable design principles represents the future of biosensor technology, particularly for applications such as on-site allergen detection that require widespread deployment. Strategies including laser-ablated gold leaf electrodes, paper-based platforms, and quality-controlled molecularly imprinted polymers demonstrate that cost-effectiveness and environmental responsibility can coexist with high analytical performance.
Future developments in this field will likely focus on further minimizing environmental impact through advanced green nanomaterials, closed-loop recycling systems for biosensor components, and energy-efficient manufacturing processes. Additionally, the implementation of robust quality control frameworks will be essential for meeting regulatory requirements and ensuring consistent performance across production batches. As these technologies mature, they will enable the creation of biosensing systems that are not only technically sophisticated but also economically and environmentally sustainable.
Benchmarking Biosensor Efficacy: Validation, Comparison, and Regulatory Pathways
The Limit of Detection (LoD) represents the lowest concentration of an analyte that can be reliably distinguished from a blank sample, establishing a fundamental benchmark for biosensor performance [80]. In the context of rapid on-site allergen detection, achieving exceptionally low LoDs—down to 0.01 ng/mL—is paramount for identifying trace allergenic proteins that can trigger severe physiological responses in sensitized individuals. The LoD is mathematically defined as CLoD = ksB/a, where k is a statistical confidence factor (typically 3), sB is the standard deviation of blank measurements, and a is the analytical sensitivity (slope of the calibration curve) [80]. This application note establishes standardized protocols for determining, validating, and achieving ultra-sensitive detection capabilities essential for protecting consumer health through accurate allergen monitoring.
Theoretical Framework for LoD Calculation
Accurate LoD determination requires meticulous statistical analysis of calibration data and blank measurements. The International Union of Pure and Applied Chemistry (IUPAC) defines LoD through the relationship between blank signal variability and analytical sensitivity [80]. The critical parameters include:
- yB: Mean signal of blank measurements
- sB: Standard deviation of blank measurements
- yC: Critical value (signal threshold for detection decision)
- yLoD: Signal detection limit corresponding to CLoD
- α: Probability of false positive
- β: Probability of false negative
For a 95% confidence level (α = β = 0.05), the multiplier k equals 3.29, establishing that yLoD = yB + 3.29sB [80]. The corresponding concentration LoD is then calculated by incorporating the calibration sensitivity: CLoD = (yLoD - yB)/a = 3.29sB/a. This statistical foundation ensures reliable detection limits with defined confidence intervals for biosensor applications.
Table 1: Parameters for LoD Calculation
| Parameter | Symbol | Definition | Typical Value |
|---|---|---|---|
| Blank Mean | yB | Average signal of blank measurements | Determined experimentally |
| Blank Standard Deviation | sB | Standard deviation of blank measurements | Determined experimentally |
| Confidence Factor | k | Statistical multiplier based on confidence level | 3 for ~90% confidence |
| Analytical Sensitivity | a | Slope of calibration curve | Determined experimentally |
| Critical Value | yC | Signal threshold for detection decision | yB + ksB |
| Detection Limit Signal | yLoD | Signal corresponding to LoD | yB + ksB (when α=β) |
Experimental Protocols for LoD Determination
Blank Measurement Procedure
- Sample Preparation: Prepare a minimum of 10 independent blank solutions containing all assay components except the target analyte. Use the same buffer matrix as intended for sample analysis.
- Measurement Conditions: Process blanks identically to actual samples through the complete assay workflow, including incubation times, washing steps, and signal detection.
- Signal Acquisition: Measure blank signals using the established detection method (electrochemical, optical, etc.). Ensure measurement conditions remain constant throughout.
- Statistical Analysis: Calculate mean (yB) and standard deviation (sB) of blank measurements. Verify normal distribution of blank signals using appropriate statistical tests.
Calibration Curve Establishment
- Standard Preparation: Prepare a minimum of 5 standard solutions spanning the expected detection range, including concentrations near the anticipated LoD.
- Replication: Analyze each standard concentration in triplicate to account for measurement variability.
- Signal Measurement: Process standards using identical assay conditions as unknown samples.
- Linear Regression: Plot mean signal versus concentration and perform linear regression analysis. The slope (a) represents analytical sensitivity, while the y-intercept should approximate the blank signal.
- Linearity Validation: Verify linear range through correlation coefficient (R² > 0.99) and residual analysis.
LoD Calculation and Validation
- Initial Calculation: Compute preliminary LoD using the formula CLoD = 3.29sB/a for 95% confidence level.
- Verification Samples: Prepare and analyze samples at the calculated LoD concentration (n ≥ 5) to verify detection reliability.
- Acceptance Criteria: ≥95% of verification samples should produce signals distinguishable from blanks with statistical significance (p < 0.05).
- Protocol Documentation: Record all experimental parameters, including instrument settings, reagent lots, and environmental conditions.
Advanced Sensing Platforms Achieving Ultra-Sensitive Detection
Electrochemical Biosensors for Allergen Detection
The iEAT2 (integrated Exogenous Allergen Test 2) system represents a significant advancement in electrochemical sensing for food allergens, employing a multiplexed immunomagnetic approach with horseradish peroxidase (HRP)-based signal amplification [7] [3]. This system demonstrates detection capabilities below established allergic reaction thresholds for common allergens including gliadin (wheat), Ara h1 (peanut), and ovalbumin (egg white) [3]. The complete assay workflow from sample extraction to detection requires less than 15 minutes, making it suitable for rapid on-site analysis [7].
Optical Cavity-Based Biosensors
Recent optimization of 3-aminopropyltriethoxysilane (APTES) functionalization protocols for optical cavity-based biosensors has demonstrated substantial improvements in detection sensitivity [81]. Systematic comparison of ethanol-based, methanol-based, and vapor-phase APTES deposition methods revealed that methanol-based protocols (0.095% APTES) yielded a threefold improvement in LoD, achieving 27 ng/mL for streptavidin detection [81]. This enhancement highlights the critical importance of surface functionalization in achieving ultra-sensitive detection.
Molecularly Imprinted Polymer Sensors
Molecularly imprinted polymer (MIP)-based sensors have demonstrated exceptional performance for allergen detection in complex food matrices [37]. These sensors employ synthetic recognition elements tailored to specific allergenic markers such as genistein for soy allergen detection. When configured with differential pulse voltammetry detection, MIP sensors successfully identified soy allergens in 42 different food products representing over 300 ingredients, with verification against standard lateral flow immunoassays [37].
Table 2: Performance Comparison of Ultra-Sensitive Biosensing Platforms
| Platform | Detection Mechanism | Target Analyte | Reported LoD | Assay Time |
|---|---|---|---|---|
| iEAT2 Electrochemical System [3] | Immunomagnetic separation with HRP detection | Food allergens (gliadin, Ara h1, ovalbumin) | Below established allergic reaction thresholds | <15 minutes |
| Optical Cavity Biosensor [81] | Fabry-Perot interferometry with APTES functionalization | Streptavidin | 27 ng/mL (optimized) | Real-time monitoring |
| MIP-based Sensor [37] | Molecular imprinting with electrochemical detection | Soy allergen (genistein) | Clinically relevant levels | ~15 minutes |
| Capacitive Sensor [82] | Non-Faradaic EIS with surface functionalization | Model proteins | Sub-nanomolar range | Minutes to hours |
The Scientist's Toolkit: Essential Research Reagent Solutions
Table 3: Essential Reagents and Materials for Ultra-Sensitive Biosensor Development
| Reagent/Material | Function | Application Examples |
|---|---|---|
| Immunomagnetic Beads (e.g., Dynabeads M-270 Epoxy) [3] | Target capture and separation from complex matrices | Isolation of allergenic proteins from food extracts |
| Horseradish Peroxidase (HRP) Conjugates [3] | Signal amplification through enzymatic catalysis | Electrochemical detection with TMB substrate |
| 3-Aminopropyltriethoxysilane (APTES) [81] | Surface functionalization for bioreceptor immobilization | Creating uniform amine-terminated layers on sensor surfaces |
| Molecularly Imprinted Polymers [37] | Synthetic recognition elements | Selective binding of allergenic markers in complex foods |
| Screen-Printed Electrodes [37] | Disposable electrochemical transduction platforms | On-site electrochemical detection of allergens |
| TMB Substrate Solution [3] | Chromogenic/electroactive enzyme substrate | HRP-based signal generation in electrochemical assays |
| Bovine Serum Albumin (BSA) [81] | Blocking agent to reduce non-specific binding | Minimizing background signal in immunoassays |
Workflow Visualization for Ultra-Sensitive Detection
Figure 1: Workflow for ultra-sensitive allergen detection, integrating sample preparation, target capture, signal amplification, and data analysis for reliable LoD determination.
Technical Considerations for Achieving 0.01 ng/mL Sensitivity
Signal Amplification Strategies
Achieving detection limits approaching 0.01 ng/mL requires sophisticated signal amplification methodologies:
- Enzymatic Amplification: Horseradish peroxidase systems with TMB substrate provide 10-100x signal enhancement through enzymatic turnover [3].
- Nanomaterial Enhancement: Integration of gold nanoparticles, graphene oxides, and carbon nanotubes enhances electron transfer kinetics in electrochemical sensors [83] [84].
- Cascade Amplification: Combining multiple amplification strategies (e.g., enzymatic with nanomaterial) can yield exponential signal improvements.
Minimizing Background Interference
Ultra-sensitive detection necessitates rigorous background reduction:
- Surface Blocking: Optimized BSA concentration (0.5-5%) and incubation time (30-120 minutes) significantly reduce non-specific binding [81].
- Stringent Washes: Implement multiple wash cycles with optimized buffer formulations to remove loosely-bound constituents.
- Interference Shielding: Use of specialized electrodes (e.g., boron-doped diamond) minimizes fouling in complex matrices [82].
Method Validation and Quality Control
Precision and Accuracy Assessment
- Repeatability: Analyze six replicates of low-concentration samples (near LoD) within the same assay batch. Accept %CV ≤ 20%.
- Intermediate Precision: Assess across different days, analysts, or equipment. Accept %CV ≤ 25%.
- Accuracy Recovery: Spike known allergen concentrations into blank matrices. Accept recovery of 80-120%.
Cross-Validation with Reference Methods
- Correlative Analysis: Compare biosensor results with reference methods (ELISA, LC-MS/MS) using linear regression.
- Statistical Agreement: Demonstrate equivalence through Bland-Altman analysis or similar methodologies.
- Real-Sample Testing: Validate with naturally-incurred samples across relevant concentration ranges.
Achieving reliable detection sensitivity down to 0.01 ng/mL demands integrated optimization of biorecognition elements, transduction mechanisms, signal amplification strategies, and rigorous statistical validation. The protocols outlined herein provide a standardized framework for developing, validating, and implementing ultra-sensitive biosensor systems for allergen detection. As these technologies evolve, integration with emerging platforms including artificial intelligence for data analysis and smartphone-based detection systems will further enhance their utility for rapid on-site monitoring, ultimately strengthening food safety management and protecting consumer health [84].
The accurate detection of food allergens is a critical public health priority, as the only effective management strategy for affected individuals remains strict avoidance of allergenic foods. The gold-standard methods for allergen detection and diagnosis, such as the enzyme-linked immunosorbent assay (ELISA) and oral food challenges (OFCs), are well-established but present significant limitations including time consumption, high costs, and requirements for laboratory infrastructure and trained personnel [85] [6]. In recent years, biosensing technologies have emerged as promising alternatives, offering the potential for rapid, sensitive, and on-site detection of allergens [86] [20]. This application note provides a comparative analysis of these methodologies, framed within research on implementing biosensor systems for rapid on-site allergen detection. We summarize quantitative performance data, provide detailed experimental protocols for key biosensor configurations, and outline essential research reagents to facilitate further development in this field.
Established Diagnostic and Detection Methods
Traditional allergen analysis relies on several well-characterized techniques, each with distinct applications and limitations.
- Oral Food Challenge (OFC): The clinical gold standard for diagnosing food allergy. It involves supervised, incremental consumption of the suspected allergen. While highly accurate, OFCs are time-intensive, carry a risk of severe allergic reactions, and require close medical supervision [85].
- Enzyme-Linked Immunosorbent Assay (ELISA): The dominant laboratory technique for quantifying specific allergen proteins in food products. ELISA benefits from high sensitivity and specificity but typically requires 2-4 hours to perform, necessitates specialized laboratory equipment, and consumes relatively large volumes of reagents [6].
- Skin Prick Test (SPT) and Specific IgE (sIgE) Testing: These are primary tools for clinical sensitization assessment. They exhibit high sensitivity but variable specificity, often leading to false positives. Larger SPT wheal sizes or higher sIgE levels correlate with an increased probability of clinical allergy, though they do not reliably predict reaction severity [85].
Performance Data of Gold-Standard Methods
Table 1: Diagnostic Thresholds for Gold-Standard Clinical Tests
| Allergen | sIgE 95% PPV (kU/L) | SPT 95% PPV (Wheal Diameter, mm) | Key Limitations |
|---|---|---|---|
| Cow's Milk | 15 (≤2 yrs: 5) | ≥8 (≤2 yrs: 6) | Cutoffs are age-dependent and population-specific [85] |
| Egg | 7 (≤2 yrs: 2) | ≥7 (≤2 yrs: 4-5) | Does not apply to baked egg/milk [85] |
| Peanut | 15-34 | ≥8 (≤2 yrs: 4) | Intermediate results often require OFC for confirmation [85] |
| Sesame | ~50 (86% PPV) | ≥8 (estimated) | Lower specificity; PPV often not reaching 95% [85] |
Table 2: Performance of Traditional Food Allergen Detection Methods
| Method | Approx. Assay Time | Key Advantages | Key Limitations |
|---|---|---|---|
| ELISA | 2-4 hours | High sensitivity and precision; well-standardized | High reagent consumption; requires lab equipment; not portable [6] |
| Lateral Flow (LFA) | 10-20 minutes | Rapid, simple, low-cost; suitable for on-site use | Generally qualitative/semi-quantitative; multiplexing challenges [86] [87] |
| Liquid Chromatography-Mass Spectrometry (LC-MS/MS) | Several hours | High selectivity and accuracy; can detect multiple allergens | Very high cost; requires skilled technicians and extensive sample prep [86] |
| Polymerase Chain Reaction (PCR) | Several hours | High specificity for allergen source DNA | Does not detect allergenic proteins directly; complex sample prep [86] |
Emerging Biosensing Technologies
Biosensors are analytical devices that integrate a biological recognition element (e.g., antibody, aptamer) with a transducer to produce a measurable signal proportional to the target analyte concentration [88] [89]. Recent advances have focused on enhancing their sensitivity, specificity, and portability for on-site application.
Types of Biosensors for Allergen Detection
- Electrochemical Biosensors: Measure electrical changes (current, potential, impedance) resulting from antigen-antibody or aptamer-allergen binding. These sensors are promising for miniaturization and integration into portable devices [86] [90].
- Optical Biosensors: Include colorimetric, fluorescent, and surface plasmon resonance (SPR)-based systems. They transduce the binding event into a optical signal change. Smartphone-based analysis of colorimetric lateral flow assays is a growing area of development [86] [87] [20].
- Nanomaterial-Enhanced Biosensors: Incorporate nanoparticles (e.g., gold, carbon, graphene, quantum dots) to improve performance by increasing the surface area for biorecognition, enhancing signal transduction, and improving catalytic efficiency [88]. For instance, gold nanoparticle-based biosensors have been extensively applied for the detection of Ara h proteins in peanuts [88].
Performance Data of Emerging Biosensors
Table 3: Performance Comparison of Emerging Biosensor Formats for Peanut and Hazelnut Detection
| Biosensor Format | Detection Target | Limit of Detection (LOD) | Assay Time | Key Feature |
|---|---|---|---|---|
| Passive Flow-Through | THP, TPP | 1 ppm (THP), 5 ppm (TPP) in matrix | ~1-10 min | Excellent multiplexing capability, no hook-effect [87] |
| Active Flow-Through | THP, TPP | 0.5 ppm (THP), 1 ppm (TPP) in matrix | ~1-10 min | Higher sensitivity than passive flow; potential for user variability [87] |
| Lateral Flow (Carbon Nano) | THP, TPP | 0.5 ppm (both) in matrix | ~30 sec - 10 min | World-record speed (30 sec); smartphone readout compatible [87] |
| Microfluidic ELISA | Ara h 1, Gluten | Sub-ppm levels | 15-20 min | Quantitative; massive reduction in reagent use (5-10 µL) [6] |
| Aptamer-Fluorescent | Various Allergens | Varies by target | Minutes to <30 min | High specificity; adaptable to various targets [20] |
Table 4: Emerging Clinical Diagnostic Tests
| Test | Principle | Reported Performance | Stage |
|---|---|---|---|
| Basophil Activation Test (BAT) | Measures in vitro activation of basophils from patient blood in response to allergen | High diagnostic accuracy; incorporates functional response | Research/Clinical validation [85] |
| Mast Cell Activation Test (MAT) | Utilizes engineered or primary mast cells sensitized with patient serum IgE | AUC up to 0.97; Sensitivity 93%, Specificity 96% for peanut [91] |
Experimental Protocols
Protocol 1: Microfluidic ELISA for Allergen Detection
This protocol demonstrates a rapid, low-volume microfluidic ELISA for quantifying allergens like Ara h 1 (peanut) and gluten, adapting traditional ELISA to a miniaturized format [6].
Workflow Overview
Materials & Reagents
- PDMS Microfluidic Chip: Fabricated via standard photolithography/soft lithography, featuring a microchannel (~80 μm height) with multiple inlets and one outlet [6].
- Capture Antibodies: Monoclonal antibodies specific to the target allergen (e.g., anti-gliadin 14D5 for gluten, 2C12 for Ara h 1) [6].
- Detection Antibodies: HRP-conjugated or biotinylated antibodies (e.g., HRP-rabbit anti-gliadin, biotinylated 2F7 for Ara h 1) [6].
- TMB Substrate: 3,3',5,5'-Tetramethylbenzidine for colorimetric development [6].
- Washing Buffer: PBS with 0.05% Tween-20 [6].
- Blocking Buffer: PBS with 1% BSA [6].
- Custom Optical Sensor: A portable detector with a light-emitting diode (LED) and photodetector for measuring absorbance of the product [6].
Step-by-Step Procedure
- Chip Preparation: The PDMS microfluidic chip is plasma-treated and functionalized as needed. The capture antibody is immobilized within the microchannel, followed by flushing with blocking buffer for 5-10 minutes to passivate non-specific binding sites [6].
- Sample Introduction & Incubation: Introduce 5-10 µL of the extracted food sample or standard into the chip via the sample inlet. Incubate for 5 minutes to allow antigen-antibody binding. Flush the channel with 10 µL of washing buffer to remove unbound materials [6].
- Detection Antibody Incubation: Introduce 5-10 µL of the enzyme-conjugated detection antibody into the chip. Incubate for 5 minutes, followed by a second wash with 10 µL of washing buffer [6].
- Signal Development & Detection: Introduce 5-10 µL of TMB substrate solution. After a brief incubation (1-2 minutes), the flow is stopped, and the color development is measured. The optical sensor quantifies the color intensity by measuring the absorbance, which is correlated to the allergen concentration [6].
Protocol 2: Development of a Carbon Nanoparticle-based Lateral Flow Immunoassay (LFIA)
This protocol outlines the development of a rapid, smartphone-readable LFIA for multiplex allergen detection, such as peanut and hazelnut [87].
Workflow Overview
Materials & Reagents
- Nitrocellulose (NC) Membrane: A membrane with a capillary flow rate of 120-150 s/4 cm is recommended as a compromise between speed and sensitivity [87].
- Carbon Nanoparticles ("Spezial Schwartz 4"): Serve as the detection label, providing a dark black signal without the need for enzymatic development [87].
- Capture Antibodies: Monoclonal antibodies specific for target allergens (e.g., hazelnut 50-6B12, peanut 51-2A12/51-12D2) for test lines, and goat anti-mouse IgG for the control line [87].
- Conjugate Pads: Glass fiber or similar pads for dispensing the antibody-carbon nanoparticle conjugates.
- Running Buffer: 100 mM borate buffer with 1% BSA and 0.05% Tween-20 [87].
Step-by-Step Procedure
- Conjugate Preparation: Antibodies specific to the target allergens are conjugated to carbon nanoparticles via adsorption. The conjugate is dispensed onto the conjugate pad and dried [87].
- Membrane Preparation: Using a dispenser, the capture antibodies (for test lines T1, T2, etc.) and the control antibody (goat anti-mouse IgG) are striped onto the NC membrane. The membrane is then dried [87].
- Strip Assembly: The card is assembled by successively overlapping the sample pad, conjugate pad, NC membrane, and absorbent pad on a plastic backing. The card is then cut into individual strips of the desired width [87].
- Assay Execution: A processed food sample extract (in running buffer) is applied to the sample pad. The sample migrates by capillary action, rehydrating the conjugate. If the target allergen is present, it forms a complex with the conjugate, which is subsequently captured at the respective test line, forming a visible black line [87].
- Readout: Results are available within 10 minutes, and as quickly as 30 seconds for optimized assays. The signal can be interpreted visually or, for semi-quantification, using a smartphone camera with a device-independent color space analysis app to minimize inter-device variation [87].
The Scientist's Toolkit: Research Reagent Solutions
Table 5: Essential Materials for Allergen Biosensor Research
| Reagent/Material | Function | Example from Literature |
|---|---|---|
| Gold Nanoparticles (AuNPs) | Signal amplification and labeling in optical and electrochemical biosensors due to high conductivity and unique optical properties. | Used as a base for electrochemical immunosensors to detect Ara h 1 in peanuts [88]. |
| Carbon Nanoparticles | Label for lateral flow assays, providing a stable, non-enzymatic colorimetric signal. | "Spezial Schwartz 4" carbon nanoparticles used in multiplex LFIA for hazelnut and peanut [87]. |
| Monoclonal Antibodies | Biorecognition elements that provide high specificity to the target allergen protein. | Hazelnut (50-6B12) and peanut (51-2A12, 51-12D2) antibodies used in flow-through and LFIA formats [87]. |
| Nucleic Acid Aptamers | Synthetic single-stranded DNA/RNA oligonucleotides that bind targets with high affinity and specificity; offer advantages over antibodies in stability and production. | Used as recognition elements in fluorescent biosensors for various food allergens [20]. |
| Nitrocellulose Membranes | Porous matrix in lateral flow and flow-through assays that supports capillary flow and immobilization of capture molecules. | 140 CN membranes (Unisart) and Whatman nylon membranes used in LFIAs and active flow-through assays, respectively [87]. |
| Smartphone with Analysis App | Portable readout system for colorimetric assays; enables result digitization, sharing, and reduced subjective interpretation. | Used with device-independent color space (e.g., XYZ) to analyze carbon nanoparticle-based LFIA results from multiple phone models [87]. |
| Polydimethylsiloxane (PDMS) | Elastomeric polymer used for rapid prototyping of microfluidic chips via soft lithography; offers optical transparency and gas permeability. | Used to fabricate microfluidic chips with SU-8 master molds for microfluidic ELISA [6]. |
Biosensor technologies represent a significant advancement in food allergen detection, offering compelling advantages in speed, cost, portability, and potential for on-site use compared to traditional gold-standard methods. While techniques like ELISA and OFC remain benchmarks for laboratory quantification and clinical diagnosis, respectively, the integration of nanomaterials, novel biorecognition elements like aptamers, and portable readout systems is rapidly bridging the performance gap. Future research should focus on overcoming remaining challenges, including the development of robust sample preparation methods for complex food matrices, validation of biosensors across a wider range of processed foods, and the pursuit of standardized, multi-allergen detection platforms to better protect consumers and aid the food industry.
Assessing Reproducibility, Specificity, and Operational Lifespan
The implementation of robust biosensor systems for the rapid, on-site detection of food allergens represents a significant advancement in food safety and public health. For researchers and drug development professionals, the critical analytical parameters of reproducibility, specificity, and operational lifespan determine the transition of these technologies from laboratory prototypes to reliable field-deployable tools. Recurring challenges in biosensor development include maintaining consistent performance across multiple production batches, achieving high specificity against complex food matrices, and extending the functional longevity of devices compromised by biofouling and component degradation [62] [92]. This document provides a structured assessment of these parameters, supported by quantitative data, detailed experimental protocols for their evaluation, and a curated toolkit of essential research reagents.
Data Presentation: Performance Metrics of Allergen Biosensors
The following tables consolidate key performance metrics from recent advancements in biosensing platforms, providing a benchmark for evaluating sensor efficacy.
Table 1: Analytical Performance of Representative Biosensing Platforms
| Detection Target | Biosensor Type & Recognition Element | Dynamic Range | Limit of Detection (LOD) | Reference |
|---|---|---|---|---|
| Peanut Allergen | Electrochemical Immunosensor | 1 - 1000 ng/mL | 0.8 ng/mL | [62] |
| Gluten | Aptasensor with Nanozyme | 0.1 - 100 ppm | 0.05 ppm | [32] |
| Egg Allergen | Genosensor | 5 - 500 nM | 1.2 nM | [62] |
| Inflammatory Biomarkers | Electrochemical Sensor with Anti-fouling Coating | Not Specified | Functional for >3 weeks | [93] |
Table 2: Operational Stability and Lifespan Factors
| Parameter | Influencing Factors | Typical Range/Impact | Improvement Strategies |
|---|---|---|---|
| Reproducibility (CV%) | Bio-receptor immobilization uniformity; nanomaterial batch quality [92]. | <10% (high), 10-15% (moderate), >15% (low) | Automated fabrication; standardized surface chemistry [94]. |
| Specificity | Cross-reactivity with non-target proteins or food matrix components [62]. | Measured by % signal change with interferents. | Use of high-affinity aptamers or monoclonal antibodies; sample pre-treatment [32]. |
| Operational Lifespan | Biofouling; bioreceptor denaturation; electrode passivation [95] [93]. | Days to weeks for continuous monitors [95]. | Anti-fouling coatings (e.g., BSA-graphene [93]); sensor arrays with on-demand activation [95]. |
| Storage Stability | Temperature, humidity, and immobilization matrix stability [96]. | Months to years for shelf-stored devices. | Use of lyophilized reagents; stable nanomaterial composites (e.g., nanozymes [32]). |
Experimental Protocols
This section outlines detailed methodologies for quantifying the core parameters under investigation.
Protocol for Assessing Reproducibility
Objective: To determine the intra-assay and inter-assay precision (Coefficient of Variation, CV%) of the biosensor response.
- Sensor Fabrication: Fabricate a single batch of at least 10 identical biosensors according to your standard protocol (e.g., screen-printed electrode modified with specific nanomaterials and bioreceptors).
- Intra-Assay Precision:
- Prepare a standard solution of the target allergen at a concentration within the linear dynamic range of the sensor (e.g., 50 ng/mL for a peanut allergen).
- Measure the analytical signal (e.g., amperometric current) of this single standard solution using all 10 sensors from the same batch.
- Calculate the mean signal value and standard deviation. The CV% is calculated as (Standard Deviation / Mean) × 100.
- Inter-Assay Precision:
- Fabricate three separate batches of sensors (n=10 per batch) on different days.
- Measure the analytical signal for the same standard solution using all sensors from all batches.
- Calculate the CV% across the measurements from all 30 sensors.
- Analysis: A CV% of less than 10% is generally considered indicative of high reproducibility and reliable manufacturing consistency [92].
Protocol for Evaluating Specificity
Objective: To confirm the biosensor's response is specific to the target allergen and is not affected by common interferents.
- Sample Preparation:
- Prepare a solution containing only the target allergen at a known concentration (Ctarget).
- Prepare separate solutions containing potential interferents (e.g., other non-target allergenic proteins like ovalbumin or casein, or common food matrix components like fats or phenols) at concentrations 10-fold higher than Ctarget.
- Prepare a mixture containing the target allergen (C_target) and all interferents.
- Measurement:
- Measure the analytical signal for each solution using the same biosensor or sensors from the same batch.
- Perform each measurement in triplicate.
- Calculation:
- Cross-Reactivity (%) = (Signal from Interferent Solution / Signal from Target Solution) × 100.
- Recovery (%) = (Signal from Mixture Solution / Signal from Target Solution) × 100.
- Acceptance Criterion: A cross-reactivity of less than 5% for each interferent and a recovery between 85-115% for the mixture demonstrate high specificity [62] [32].
Protocol for Determining Operational Lifespan
Objective: To quantify the functional stability of the biosensor under continuous or repeated use conditions.
- Initial Calibration: Calibrate the biosensor by measuring the dose-response curve (signal vs. log[concentration]) for the target allergen on Day 0.
- Stability Monitoring:
- For Continuous Monitors: Immerse the sensor in a complex matrix (e.g., diluted food extract or spiked buffer) and continuously or intermittently monitor the signal for a known, fixed concentration of the allergen over time [93].
- For Intermittent-Use Sensors: Store the sensor in an appropriate buffer at a defined temperature. At regular intervals (e.g., daily), measure the signal response for the same standard concentration used in the initial calibration.
- Endpoint Definition: The operational lifespan is defined as the time point at which the sensor's signal output for the standard decreases to less than 80% of its initial value, indicating a significant loss of sensitivity [95] [96].
Visualization of Workflows and Relationships
Biosensor Integrity Assessment Workflow
The following diagram outlines the logical sequence and decision points for the comprehensive assessment of a biosensor's key performance parameters.
Key Biosensor Architectures and Failure Modes
This diagram illustrates two common biosensor designs and the primary factors that influence their operational lifespan.
The Scientist's Toolkit: Research Reagent Solutions
Table 3: Essential Materials for Allergen Biosensor Development and Testing
| Item | Function & Rationale |
|---|---|
| High-Affinity Monoclonal Antibodies | Serve as primary recognition elements for specific allergen epitopes, directly determining sensor sensitivity and specificity [62]. |
| DNA or RNA Aptamers | Synthetic oligonucleotide receptors selected via SELEX; offer advantages in stability, production cost, and modification over antibodies [62] [32]. |
| Nanozymes (e.g., Co-doped Hydroxyapatite) | Nanomaterials with enzyme-mimicking activity; provide stable, cost-effective signal generation for colorimetric or electrochemical detection [32]. |
| Conductive Nanomaterials (Graphene, CNTs) | Enhance electrode surface area and electron transfer kinetics, leading to lower detection limits and improved signal-to-noise ratios [62] [94]. |
| Anti-Fouling Coatings (BSA-Graphene) | A cross-linked lattice that forms a biobarrier, preventing non-specific adsorption and immune activation, thereby extending in vivo/implantable sensor lifespan [93]. |
| Nitrocellulose (NC) Membranes | Used in protective layers for sensor arrays; can be electrically decomposed on-demand to sequentially activate individual sensors, prolonging overall system lifetime [95]. |
| Magnetic Nanoparticles (MNPs) | Facilitate target allergen capture, isolation, and enrichment from complex food matrices, significantly improving assay sensitivity and reducing interference [92]. |
The transition of biosensors from research laboratories to commercially available products, particularly for rapid on-site allergen detection, requires meticulous navigation of regulatory landscapes and rigorous clinical validation. Biosensors are defined as integrated devices that use a biological recognition element (bioreceptor) in direct spatial contact with a transducer to detect and measure biological analytes [97]. The global biosensors market is projected to reach USD 35.5 billion by 2026, reflecting significant commercial potential and acceptance across research and clinical applications [98].
For food allergen detection, biosensors represent a paradigm shift from conventional laboratory-based methods like Enzyme-Linked Immunosorbent Assay (ELISA) toward decentralized, point-of-care diagnostics. These systems offer substantial advantages including faster analysis times (as quick as 15-20 minutes compared to hours for conventional ELISA), reduced sample and reagent consumption (5-10 μL versus hundreds of microliters), and portability for on-site testing [97] [3]. This application note provides a structured roadmap through the critical regulatory and validation processes required for successful commercialization.
Regulatory Framework Navigation
Risk-Based Classification and Regulatory Authorities
Biosensors are regulated as medical devices in most jurisdictions, with classification primarily determined by the potential risk posed to patients or users. The general principle is that "the higher the risk, the more stringent the regulatory requirements and processes" [98]. The table below summarizes the key regulatory bodies and classification systems across three major markets.
Table 1: Regulatory Authorities and Device Classification for Biosensors
| Market | Regulatory Authority | Governing Regulations | Risk Classification Framework | Examples for Allergen Detection Biosensors |
|---|---|---|---|---|
| United States | Food and Drug Administration (FDA), Center for Devices and Radiological Health (CDRH) [98] | Food, Drug & Cosmetics (FD&C) Act [98] | Class I (Low Risk), Class II (Moderate Risk), Class III (High Risk) [98] | Wearable sensors typically Class II or III [98] |
| European Union | Notified Bodies [98] | Medical Device Regulation (MDR), In Vitro Diagnostic Regulation (IVDR) [98] | Class I (Low Risk), Class IIa/b (Medium Risk), Class III (High Risk) [98] | Classified by intended purpose and inherent risks [98] |
| India | Central Drugs Standard Control Organization (CDSCO) [98] | Medical Device Rules (MDR 2017) [98] | Class A (Low Risk), Class B (Low-Moderate), Class C (Moderate-High), Class D (High Risk) [98] | Low-moderate risk devices typically Class A or B [98] |
The intended use of the biosensor critically determines its regulatory pathway. Standalone diagnostic biosensors (e.g., for gluten detection in food) and those integrated into multi-platform systems (e.g., wearable monitors) may be subject to different regulatory considerations [98].
Compliance Pathways and Key Considerations
Navigating the regulatory pathway requires careful planning from the early stages of development. The following diagram outlines the key stages in the regulatory navigation process for a biosensor.
Key stages in the regulatory pathway include:
- Pre-submission/Consultation: Engaging with regulatory bodies (e.g., FDA pre-submission process) early to gain feedback on proposed validation strategies and regulatory pathways [98].
- Technical Documentation: Compiling comprehensive evidence including design and manufacturing information, software validation, verification and validation data, and labeling [98].
- Quality Management: Implementing and adhering to Quality System Regulations (QSR) and Good Manufacturing Practices (GMP), which are mandatory across all markets [98].
- Post-Market Surveillance: Establishing robust systems for monitoring device performance and reporting adverse events after commercial release [98].
Clinical Validation Protocols
Principles of Analytical Validation
Analytical validation ensures the biosensor test method is reliable, reproducible, and fit for its intended purpose. This involves demonstrating acceptable performance across multiple parameters against a reference method or standard. The validation process must be thoroughly documented as part of the technical file for regulatory submission [98].
Table 2: Key Analytical Performance Parameters and Target Benchmarks
| Performance Parameter | Experimental Protocol | Acceptance Criteria Example | Example from Allergen Detection |
|---|---|---|---|
| Sensitivity/Limit of Detection (LOD) | Serial dilution of target analyte in matrix; LOD = mean blank + 3(SD blank) [97] | Detect levels below established allergic reaction thresholds (e.g., <20 ppm gluten) [97] [3] | iEAT2 detected gliadin, Ara h1, ovalbumin below ED01 (dose triggering reaction in 1% of allergic individuals) [3] |
| Specificity | Test against related non-target analytes and potential cross-reactants [97] | <1% cross-reactivity with common non-target substances | Microfluidic ELISA showed high specificity for wheat gluten and Ara h 1 in complex food matrices [97] |
| Accuracy/Precision | Repeated testing (n≥20) of low, medium, high QC samples; calculate CV [97] | Total CV <15% (or <20% at LOD) | Microfluidic ELISA demonstrated high precision comparable to commercial kits [97] |
| Linearity/Range | Test analyte across claimed measuring range (minimum 5 points) [97] | r² > 0.99 | Microfluidic ELISA displayed linear quantitation for gluten and Ara h 1 proteins [97] |
| Assay Time | Measure from sample application to result [97] [3] | Completion within 15-20 minutes for rapid on-site use [97] [3] | iEAT2 completed entire protocol in 15 min [3]; microfluidic ELISA reduced time from hours to 15-20 min [97] |
Experimental Protocol: On-Site Food Allergen Detection
The following detailed protocol is adapted from the iEAT2 system and microfluidic ELISA platforms for the rapid detection of common food allergens (e.g., gliadin, Ara h 1, ovalbumin) [97] [3].
Principle: The protocol utilizes an immunomagnetic separation approach coupled with electrochemical detection. Target allergens are extracted from food samples, captured by antibody-conjugated magnetic beads, and detected using enzyme-labeled detection antibodies that generate an electrochemical signal proportional to allergen concentration.
Workflow: The experimental workflow for the on-site detection of food allergens progresses from sample preparation through to electrochemical detection and data analysis.
Materials and Reagents
- Food samples (commercially available biscuits, flour, etc.)
- Allergen extraction buffer (e.g., commercial ELISA kit buffer)
- Phosphate Buffered Saline (PBS), pH 7.2-7.4
- Superparamagnetic beads (e.g., Dynabeads M-270 Epoxy, 6.7 × 10⁷ beads/mg)
- Monoclonal/polyclonal antibodies specific to target allergens (e.g., anti-gliadin, anti-Ara h 1)
- Horseradish peroxidase (HRP)-conjugated detection antibodies
- Electrochemical substrate (e.g., TMB/H₂O₂)
- Blocking buffer (e.g., 1% BSA in PBS)
Equipment
- Portable electrochemical sensor (e.g., iEAT2 reader)
- Microfluidic ELISA chip or multi-electrode array
- Centrifuge (capable of 3000× g)
- Vortex mixer
- Heating block or water bath
- Magnetic separation rack
- Micropipettes (10-1000 μL capacity)
Step-by-Step Procedure
Sample Preparation
- Homogenize 0.5 g of food sample and mix with 9.5 mL of allergen extraction buffer [97].
- Vortex for 30 seconds, then incubate in a boiling water bath for 10 minutes [97].
- Cool under running water, vortex again, and centrifuge at 3000× g for 20 minutes at room temperature [97].
- Filter the supernatant through a 0.2 μm syringe filter [97].
Immunomagnetic Capture
- Incubate 100 μL of food extract with 50 μL of antibody-conjugated magnetic beads for 5 minutes with constant mixing [3].
- Place the tube in a magnetic separation rack for 2 minutes to capture the beads. Carefully remove and discard the supernatant [3].
- Wash the beads twice with 200 μL of wash buffer (PBS with 0.05% Tween 20) while tube is in the magnetic rack [3].
Signal Generation
- Incubate the washed beads with 100 μL of HRP-conjugated detection antibody (diluted per manufacturer's recommendation) for 5 minutes [3].
- Capture beads magnetically and wash three times with 200 μL wash buffer to remove unbound detection antibody [3].
- Add 100 μL of electrochemical substrate (e.g., TMB) to the beads and incubate for 3 minutes to allow enzymatic signal development [3].
Electrochemical Detection
- Transfer 50 μL of the reaction mixture to the electrochemical cell of the portable sensor [3].
- Apply the appropriate detection potential (e.g., -0.1 V for TMB) and measure the resulting current [3].
- The measured current is directly proportional to the concentration of the target allergen in the sample [3].
Data Analysis
- Generate a standard curve using known concentrations of the purified target allergen (e.g., 0, 1, 5, 10, 20, 50 ppm) processed identically to the samples.
- Calculate the allergen concentration in unknown samples by interpolating from the standard curve.
- For qualitative assessment, establish a threshold current value above which a sample is considered positive for the allergen.
The Scientist's Toolkit: Research Reagent Solutions
Table 3: Essential Research Reagents for Allergen Detection Biosensor Development
| Reagent/Material | Function | Example Product/Catalog | Key Considerations |
|---|---|---|---|
| Superparamagnetic Beads | Solid support for antibody immobilization and target allergen capture; enable rapid separation in complex matrices [3] | Dynabeads M-270 Epoxy [3] | Uniform size distribution, high surface area, consistent binding capacity |
| Capture & Detection Antibodies | Biological recognition elements that provide specificity for target allergens (e.g., anti-gliadin, anti-Ara h 1) [97] | Monoclonal 2C12, Biotinylated 2F7 [97] | High affinity and specificity; minimal cross-reactivity; validated pair for sandwich immunoassay |
| Enzyme Conjugates | Signal generation through enzymatic amplification; HRP conjugates with substrates like TMB produce measurable electrochemical signals [97] [3] | HRP-conjugated rabbit anti-gliadin antibody [97] | High specific activity; stable conjugation; low non-specific binding |
| Electrochemical Substrate | Enzyme substrate that generates electroactive product upon reaction; critical for signal transduction [97] | 3,3',5,5'-Tetramethylbenzidine (TMB) [97] | Clean electrochemical behavior; low background; high signal-to-noise ratio |
| Microfluidic Chip Materials | Fabrication substrate for miniaturized fluidic channels; enables reduced reagent use and rapid analysis [97] | Polydimethylsiloxane (PDMS) [97] | Biocompatibility; optical clarity; gas permeability; ease of fabrication |
| Allergen Extraction Buffers | Efficient release of target allergens from complex food matrices while maintaining immunoreactivity [97] | Commercial ELISA kit extraction buffers [97] | Compatibility with downstream detection; effectiveness across diverse food types |
Successful commercialization of biosensors for rapid allergen detection requires an integrated strategy combining robust analytical performance, regulatory compliance, and thorough clinical validation. By adhering to structured regulatory pathways and implementing rigorous validation protocols as outlined in this document, researchers and developers can effectively translate innovative biosensing technologies from laboratory research to reliable commercial products that address critical needs in food safety and public health.
Conclusion
The integration of advanced materials like nanozymes, innovative transduction methods, and AI-driven design is poised to revolutionize on-site allergen detection. These next-generation biosensors offer a powerful combination of high sensitivity, rapid results, and point-of-care usability that traditional methods lack. The future of this field lies in overcoming current challenges related to real-world matrix effects and scalability through continued interdisciplinary collaboration. The successful translation of these technologies from the lab to the field will not only enhance food safety protocols and regulatory compliance but also pave the way for personalized allergy management, fundamentally improving patient outcomes and quality of life for millions affected by food allergies.
References
- 1. The Global Burden of Food Allergy [https://pubmed.ncbi.nlm.nih.gov/40669935/]
- 2. Biosensing Based on Nanoparticles for Food Allergens ... [https://pmc.ncbi.nlm.nih.gov/articles/PMC5948517/]
- 3. Scalable electrochemical system for rapid on-site detection ... [https://www.sciencedirect.com/science/article/abs/pii/S0956566325000168]
- 4. Research progress on detection methods for food allergens [https://www.sciencedirect.com/science/article/abs/pii/S0889157524009402]
- 5. Allergy Rates by Country 2025 [https://worldpopulationreview.com/country-rankings/allergy-rates-by-country]
- 6. Rapid Detection of Food Allergens by Microfluidics ELISA- ... [https://www.mdpi.com/2079-6374/6/2/24]
- 7. Scalable electrochemical system for rapid on-site detection of ... [https://pubmed.ncbi.nlm.nih.gov/39832405/]
- 8. North America Leads Allergy Diagnostics Market, Projected ... [https://finance.yahoo.com/news/north-america-leads-allergy-diagnostics-150600801.html]
- 9. Research gaps and future needs for allergen prediction in ... [https://pmc.ncbi.nlm.nih.gov/articles/PMC10911423/]
- 10. Introduction to biosensors - PMC [https://pmc.ncbi.nlm.nih.gov/articles/PMC4986445/]
- 11. Biosensor [https://en.wikipedia.org/wiki/Biosensor]
- 12. Spectrometer-free plasmonic biosensor for rapid detection ... [https://pubmed.ncbi.nlm.nih.gov/41093524/]
- 13. Transducer Technologies for Biosensors and Their Wearable ... [https://pmc.ncbi.nlm.nih.gov/articles/PMC9221076/]
- 14. Detection with Biosensors - an overview [https://www.sciencedirect.com/topics/biochemistry-genetics-and-molecular-biology/detection-with-biosensors]
- 15. Biosensors for Whole-Cell Bacterial Detection - PMC [https://pmc.ncbi.nlm.nih.gov/articles/PMC4135896/]
- 16. Development and application of novel biosensors for ... [https://www.sciencedirect.com/science/article/abs/pii/S0026265X24020502]
- 17. Perspectives on systematic optimization of ultrasensitive ... [https://pmc.ncbi.nlm.nih.gov/articles/PMC11403992/]
- 18. Food Allergenicity Evaluation Methods: Classification, ... [https://pmc.ncbi.nlm.nih.gov/articles/PMC12191692/]
- 19. Beyond ELISA: the future of biomarker validation [https://www.drugtargetreview.com/article/154316/beyond-elisa-the-future-of-biomarker-validation/]
- 20. Aptamer-Based Fluorescent Biosensor for the Rapid and ... [https://pmc.ncbi.nlm.nih.gov/articles/PMC8623274/]
- 21. Innovations shaping the future of food allergen testing [https://allergenbureau.net/innovations-shaping-the-future-of-food-allergen-testing/]
- 22. Integrating biotechnology into diagnostic labs: Innovations ... [https://www.sciencedirect.com/science/article/pii/S2590262825000565]
- 23. Diagnostic accuracy of aptamer-based biosensors for the ... [https://www.sciencedirect.com/science/article/pii/S2405844025017463]
- 24. A Systematic Review of Food Allergy: Nanobiosensor and ... [https://pmc.ncbi.nlm.nih.gov/articles/PMC7760337/]
- 25. Nano-biosensor platforms for detecting food allergens [https://www.sciencedirect.com/science/article/pii/S2214180417301137]
- 26. Voltammetric Immunosensor to Track a Major Peanut ... [https://pmc.ncbi.nlm.nih.gov/articles/PMC8615361/]
- 27. High-sensitivity Ara h1 detection with a praseodymium ... [https://www.sciencedirect.com/science/article/abs/pii/S0308814625021739]
- 28. Tropomyosin Analysis in Foods Using an Electrochemical ... [https://www.mdpi.com/2673-4583/5/1/62]
- 29. Visual detection of tropomyosin, a major shrimp allergenic ... [https://pmc.ncbi.nlm.nih.gov/articles/PMC10077205/]
- 30. Tracking a Major Egg Allergen to Assess Commercial Food ... [https://www.mdpi.com/2079-6374/12/12/1109]
- 31. Nanozymes expanding the boundaries of biocatalysis [https://www.nature.com/articles/s41467-025-62063-8]
- 32. Enzyme- and nanozyme-based food allergen detections [https://www.sciencedirect.com/science/article/pii/S0924224425001529]
- 33. A Comprehensive Review of Nanozyme Construction ... [https://www.sciencedirect.com/science/article/pii/S2666053925001122]
- 34. Cu 2-x Se@Bi 2 MoO 6 nanozyme-based immunoassay ... [https://www.sciencedirect.com/science/article/abs/pii/S0308814625000585]
- 35. Nanozyme-Powered Multimodal Sensing for Pesticide ... [https://www.mdpi.com/2304-8158/14/11/1957]
- 36. Electrochemical Biosensors: A Prospective Insight to ... [https://www.sciencedirect.com/science/article/abs/pii/S2451910325001358]
- 37. Rapid and accurate electrochemical sensor for food ... [https://www.nature.com/articles/s41598-021-00241-6]
- 38. Detecting egg white allergens using bio/nano-sensors; a ... [https://www.sciencedirect.com/science/article/abs/pii/S0001868625001794]
- 39. Electrochemical Biosensors Driving Model Transformation ... [https://www.mdpi.com/2304-8158/14/15/2669]
- 40. A colorimetric and fluorometric dual-mode biosensor for ... [https://www.sciencedirect.com/science/article/abs/pii/S092540052500752X]
- 41. Paper-based colorimetric sensor for histamine detection ... [https://www.nature.com/articles/s41598-025-15873-1]
- 42. Progress in Fluorescence Biosensing and Food Safety ... [https://pmc.ncbi.nlm.nih.gov/articles/PMC9953818/]
- 43. LAMP-Based Point-of-Care Biosensors for Rapid Pathogen ... [https://pmc.ncbi.nlm.nih.gov/articles/PMC9775414/]
- 44. Exploring innovations in point-of-care diagnostics for the ... [https://www.sciencedirect.com/science/article/pii/S2543106425000018]
- 45. Colorimetric LAMP microfluidic chip for detecting three ... [https://www.nature.com/articles/s41598-018-26982-5]
- 46. Advancements and applications of loop-mediated ... [https://www.frontiersin.org/journals/microbiology/articles/10.3389/fmicb.2024.1406632/full]
- 47. Dual-color blending based visual LAMP for food allergen ... [https://pmc.ncbi.nlm.nih.gov/articles/PMC9039889/]
- 48. A colorimetric loop-mediated isothermal amplification ... [https://www.sciencedirect.com/science/article/pii/S2405844024165097]
- 49. A molecular test based on RT-LAMP for rapid, sensitive ... [https://www.nature.com/articles/s41598-021-95799-6]
- 50. Development and Evaluation of a Novel Loop-Mediated ... [https://pmc.ncbi.nlm.nih.gov/articles/PMC404656/]
- 51. Commercial Opportunity or Addressing Unmet Needs—Loop ... [https://pmc.ncbi.nlm.nih.gov/articles/PMC11394392/]
- 52. The Magnitude and Impact of Food Allergens ... [https://pmc.ncbi.nlm.nih.gov/articles/PMC11011628/]
- 53. The Magnitude and Impact of Food Allergens ... [https://www.mdpi.com/2304-8158/13/7/994]
- 54. Reagent-free detection of multiple allergens in gluten ... [https://www.sciencedirect.com/science/article/abs/pii/S0889157523001989]
- 55. Mass Spectrometry-Based Method for Multiple Allergens ... [https://www.mdpi.com/2304-8158/14/5/726]
- 56. AllergenScreener [https://www.bruker.com/en/products-and-solutions/mass-spectrometry/ms-solutions/allergenscreener.html]
- 57. Highly sensitive optoelectrical biosensor for multiplex ... [https://pubmed.ncbi.nlm.nih.gov/32755808/]
- 58. Research Progress on Multiplexed Pathogen Detection ... [https://pmc.ncbi.nlm.nih.gov/articles/PMC12191064/]
- 59. a promising analytical tool for on-site detection of mycotoxins [https://www.nature.com/articles/s41538-025-00444-5]
- 60. Emerging electrochemical biosensing approaches for ... [https://www.sciencedirect.com/science/article/abs/pii/S0924224422000474]
- 61. Design and Optimization of a Biosensor Surface ... [https://pmc.ncbi.nlm.nih.gov/articles/PMC8399133/]
- 62. Recent Advances in Electrochemical Sensing Strategies ... [https://pmc.ncbi.nlm.nih.gov/articles/PMC9313194/]
- 63. Strategy to optimize the surface functionalization of ... [https://www.sciencedirect.com/science/article/pii/S0169433225012449]
- 64. Optimization of Surface Functionalizations for Ring ... [https://www.mdpi.com/1424-8220/24/10/3107]
- 65. Flow Cell Design for Effective Biosensing - PMC [https://pmc.ncbi.nlm.nih.gov/articles/PMC3574664/]
- 66. Bioinks and biofabrication techniques for biosensors ... [https://www.sciencedirect.com/science/article/pii/S2590006424002461]
- 67. Determining Matrix Effects in Complex Food Samples [https://www.waters.com/blog/understanding-sample-complexity-determining-matrix-effects-in-complex-food-samples/?srsltid=AfmBOopzKwh56c0dNBa-NOZ7psgE9k7FoNg4eRgwvmQ_3XSnzfLJulYE]
- 68. Analytical techniques and challenges for acrylamide testing [https://www.biotage.com/blog/analytical-techniques-and-challenges-for-acrylamide-testing]
- 69. Development and quantitative analysis of a biosensor ... [https://pmc.ncbi.nlm.nih.gov/articles/PMC8794804/]
- 70. The State of AI Design in 2025: Architectures, Data, and ... [https://medium.com/@fahey_james/the-state-of-ai-design-in-2025-architectures-data-and-the-next-frontier-of-intelligent-systems-e5219409bbbc]
- 71. Intelligent Biosensors Promise Smarter Solutions in Food ... [https://pmc.ncbi.nlm.nih.gov/articles/PMC10815208/]
- 72. AI helps scientists design better sensors for pollutants and ... [https://pme.uchicago.edu/news/ai-helps-scientists-design-better-sensors-pollutants-and-beyond]
- 73. Integration of Artificial Intelligence in Biosensors for ... [https://www.mdpi.com/2079-6374/15/10/690]
- 74. Detecting low-contrast text in websites using Machine ... [https://superlinear.eu/insights/articles/detecting-low-contrast-text-in-websites-using-machine-learning-a-guide]
- 75. A Cost-Effective and Rapid Manufacturing Approach for ... [https://pmc.ncbi.nlm.nih.gov/articles/PMC11944730/]
- 76. A novel strategy for controllable electrofabrication of ... [https://www.nature.com/articles/s41598-025-93025-1]
- 77. Sustainable Biosensor Design → Term [https://prism.sustainability-directory.com/term/sustainable-biosensor-design/]
- 78. Different approaches for fabrication of low-cost ... [https://www.sciencedirect.com/science/article/pii/S2451910321002076]
- 79. Emerging Trends in Smart and Sustainable Nano-Biosensing [https://www.sciencedirect.com/science/article/pii/S0926669024020855]
- 80. On the Determination of Uncertainty and Limit of Detection in ... [https://pmc.ncbi.nlm.nih.gov/articles/PMC6068557/]
- 81. Improvement of the optical cavity-based biosensor's limit ... [https://www.nature.com/articles/s41598-025-92151-0]
- 82. Capacitive Sensors for Label-Free Detection in High-Ionic ... [https://pmc.ncbi.nlm.nih.gov/articles/PMC12384789/]
- 83. Recent advances in nano-enhanced biosensors [https://www.sciencedirect.com/science/article/pii/S2214180425000492]
- 84. Emerging nano sensing technologies for the detection of ... [https://pubs.rsc.org/en/content/articlehtml/2025/ra/d5ra06960b?page=search]
- 85. Improving Diagnostic Accuracy in Food Allergy - PMC [https://pmc.ncbi.nlm.nih.gov/articles/PMC7794657/]
- 86. Recent progresses on emerging biosensing technologies ... [https://www.sciencedirect.com/science/article/abs/pii/S0924224424001614]
- 87. A Critical Comparison between Flow-through and Lateral Flow Immunoassay Formats for Visual and Smartphone-Based Multiplex Allergen Detection - PMC [https://pmc.ncbi.nlm.nih.gov/articles/PMC6956089/]
- 88. A Systematic Review of Food Allergy: Nanobiosensor and Food Allergen Detection - PMC [https://www.ncbi.nlm.nih.gov/pmc/articles/PMC7760337/]
- 89. Biosensor-Integrated Drug Delivery Systems as New ... [https://pmc.ncbi.nlm.nih.gov/articles/PMC9496590/]
- 90. Food Allergens: Translation of Sensory Devices from Lab to Commercial Market | Food Analytical Methods [https://link.springer.com/article/10.1007/s12161-025-02887-8]
- 91. New Test Shows Promise in Accuracy of Food Allergy ... [https://www.pharmacytimes.com/view/new-test-shows-promise-in-accuracy-of-food-allergy-diagnostics]
- 92. Editorial: Nano-(bio)sensors for on-site monitoring [https://pmc.ncbi.nlm.nih.gov/articles/PMC11392894/]
- 93. Implantable biosensors get a major longevity boost [https://wyss.harvard.edu/news/implantable-biosensors-get-a-major-longevity-boost/]
- 94. Biosensing Based on Nanoparticles for Food Allergens ... [https://www.mdpi.com/1424-8220/18/4/1087]
- 95. Energy-Efficient, On-Demand Activation of Biosensor ... [https://pmc.ncbi.nlm.nih.gov/articles/PMC9138492/]
- 96. An overview of stability and lifetime of electrochemical ... [https://www.sciencedirect.com/science/article/abs/pii/B9780443153341000225]
- 97. Rapid Detection of Food Allergens by Microfluidics ELISA ... [https://pmc.ncbi.nlm.nih.gov/articles/PMC4931484/]
- 98. Biosensors in wearable medical devices: Regulatory ... [https://www.sciencedirect.com/science/article/pii/S0003450925000380]