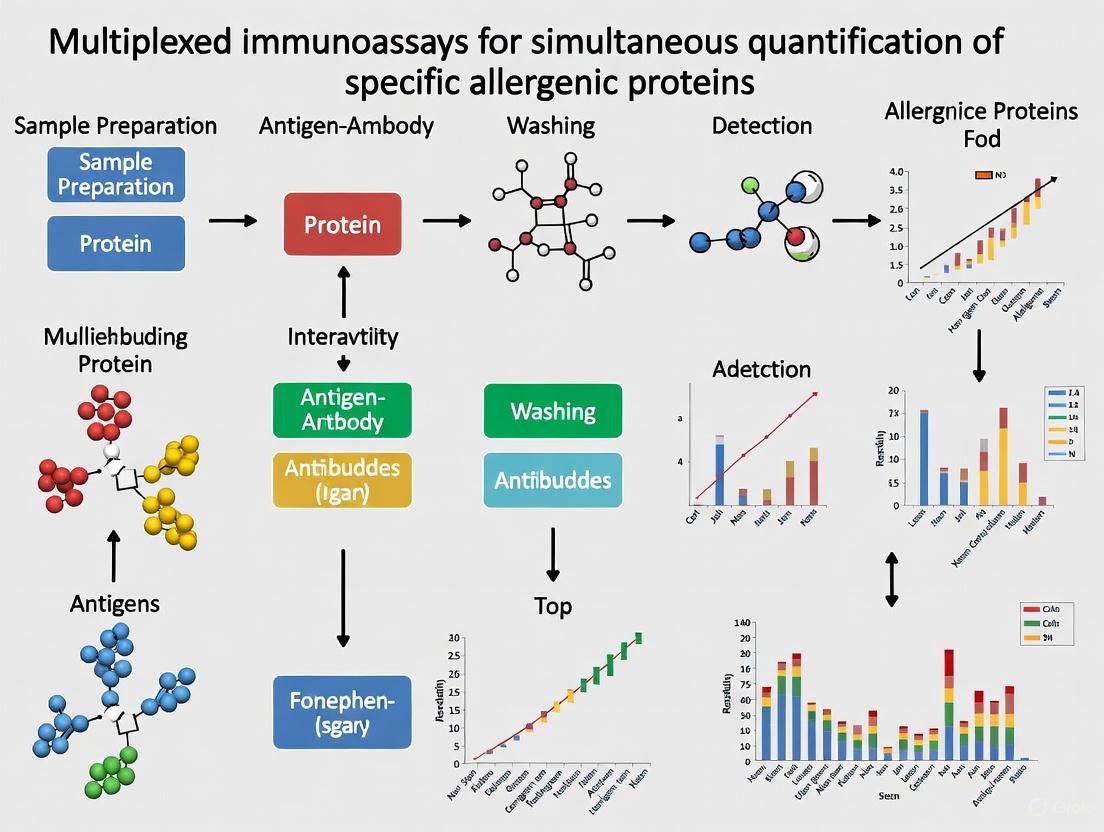
Multiplexed Immunoassays for Allergenic Protein Quantification: A Comprehensive Guide for Biomedical Researchers
This article provides a comprehensive overview of multiplexed immunoassays for the simultaneous quantification of specific allergenic proteins, a transformative approach in allergy research and diagnostics.
Multiplexed Immunoassays for Allergenic Protein Quantification: A Comprehensive Guide for Biomedical Researchers
Abstract
This article provides a comprehensive overview of multiplexed immunoassays for the simultaneous quantification of specific allergenic proteins, a transformative approach in allergy research and diagnostics. It covers the foundational principles of component-resolved diagnostics (CRD) and the technological shift from singleplex to multiplex platforms. The content details methodological applications for risk stratification in food-induced anaphylaxis and explores key troubleshooting strategies for assay interference. A comparative analysis of leading multiplex platforms—including Luminex, MSD, Olink, and NULISA—is presented, evaluating their sensitivity, dynamic range, and applicability in clinical and research settings. Aimed at researchers, scientists, and drug development professionals, this resource synthesizes current advancements and practical guidance for implementing multiplex immunoassays to achieve precise, personalized allergy management.
The Foundation of Precision Allergen Analysis: From Singleplex to Multiplex Paradigms
Defining Component-Resolved Diagnostics (CRD) and Its Role in Allergy
Component-resolved diagnostics (CRD), also known as molecular allergy testing, represents a paradigm shift in the diagnosis of IgE-mediated allergic diseases. Unlike traditional tests that use whole allergen extracts, CRD utilizes purified native or recombinant allergenic proteins to detect specific IgE (sIgE) antibodies against individual allergenic molecules [1]. This approach allows for precise characterization of a patient's molecular sensitization profile, moving beyond crude extract-based testing to identify reactivity to specific protein components within an allergen source [1] [2].
The fundamental principle of CRD lies in its ability to distinguish between genuine sensitization and cross-reactivity caused by structurally similar proteins present in different allergen sources [1] [3]. This discriminatory capability has profound implications for clinical management, risk assessment, and personalized treatment strategies for allergic patients, particularly in complex cases where multiple sensitizations are present or when the clinical relevance of sensitization is uncertain [3] [4].
Technical Foundations of CRD
Molecular Allergen Components
The International Union of Immunological Societies (IUIS) has established a systematic nomenclature for allergens, where each allergenic molecule is identified by the first three letters of the genus, the first letter of the species, and a number indicating the order of discovery [1]. For example, Ara h 2 refers to the second allergen discovered from Arachis hypogaea (peanut), while Gal d 1 refers to the first allergen from Gallus domesticus (hen's egg) [1] [3].
These allergenic components can be categorized based on their protein families and biological functions, which often correlate with their clinical behavior. Key categories include:
- Stable proteins (e.g., lipid transfer proteins, storage proteins) associated with systemic reactions and persistent allergies
- Labile proteins (e.g., PR-10 proteins) typically associated with mild symptoms and pollen-related food syndromes [2] [4]
The composition of these components within common food allergens is detailed in Table 1.
Table 1: Major Allergen Components in Common Food Allergies
| Allergen Source | Component | Protein Name | Clinical Significance | Stability |
|---|---|---|---|---|
| Cow's Milk | Bos d 8 | Casein | Major allergen, heat-stable, persistence marker | Heat-resistant |
| Cow's Milk | Bos d 5 | β-lactoglobulin | Major whey protein | Heat-labile |
| Cow's Milk | Bos d 4 | α-lactalbumin | Major whey protein | Heat-labile |
| Hen's Egg | Gal d 1 | Ovomucoid | Major allergen, heat-stable, severe reactions | Heat-resistant |
| Hen's Egg | Gal d 2 | Ovalbumin | Major allergen, heat-labile | Heat-labile |
| Peanut | Ara h 1 | Vicilin | Storage protein, severe reactions | Heat-stable |
| Peanut | Ara h 2 | 2S albumin | Major allergen, severe reactions | Heat-stable |
| Peanut | Ara h 8 | PR-10 protein | Bet v 1-homolog, pollen-cross-reactivity | Heat-labile |
CRD Platform Technologies
CRD can be implemented through various technological platforms, ranging from singleplex to highly multiplexed assays:
Singleplex Assays
Singleplex systems, such as the ImmunoCAP platform, measure sIgE to individual allergen components in separate test reactions. These provide quantitative results and are widely used in clinical practice for targeted component testing when a specific sensitization pattern is suspected [5].
Multiplex Microarray Assays
Multiplex technologies enable simultaneous determination of sIgE to numerous allergenic molecules from a single small serum sample [5]. The ImmunoCAP ISAC system is currently the most established microarray platform, testing for 112 allergenic components from 51 allergen sources in a single assay [5]. The test procedure follows these key steps:
- Allergen immobilization: Picogram quantities of purified allergens are covalently bound to a polymer-coated slide in microarray format
- Sample incubation: Patient serum is applied, allowing allergen-specific antibodies to bind to their target molecules
- Detection: Fluorescently labeled anti-human IgE antibody is added to detect bound sIgE
- Signal measurement: Fluorescence is measured using a microarray scanner, with signal intensity correlating to sIgE concentration
- Data analysis: Results are reported in ISAC Standardized Units (ISU-E) with semiquantitative interpretation categories [5]
Table 2: Comparison of CRD Platform Technologies
| Platform | Format | Number of Components | Throughput | Sample Volume | Key Features |
|---|---|---|---|---|---|
| ImmunoCAP | Singleplex | Individual components | High | ~50 μL/test | Quantitative, established cutoff values |
| ImmunoCAP ISAC | Multiplex microarray | 112 components | Medium | 30-50 μL | Comprehensive sensitization profile |
| FABER | Multiplex microarray | 244 components | Medium | 30-50 μL | Extended component panel |
| MARIA for Foods | Multiplex immunoassay | 17 food allergens | High | Variable | Designed for food allergen detection in matrices |
| Lateral Flow Assays | Point-of-care | Limited panels | Low | Small volumes | Rapid results, minimal equipment |
Research Applications and Clinical Utility
Risk Stratification and Severity Assessment
CRD has demonstrated significant value in stratifying clinical risk and predicting reaction severity in food allergy:
- Peanut allergy: Sensitization to Ara h 2 is a strong predictor of clinically relevant peanut allergy, with a positive predictive value of approximately 90% for systemic reactions [3]. In contrast, isolated sensitization to Ara h 8 (a PR-10 protein) typically indicates pollen-food syndrome with mild oropharyngeal symptoms [4].
- Cow's milk allergy: sIgE to casein (Bos d 8) at levels >1.8 kUA/L increases the risk of anaphylaxis in children by up to six times (specificity 77%, sensitivity 65%) [3].
- Hen's egg allergy: Ovomucoid (Gal d 1) -specific IgE at levels ≥10 kU/L has a specificity of 95% and PPV of approximately 90% for predicting severe reactions to both raw and cooked egg [3].
Discrimination of Cross-Reactivity
A major strength of CRD is its ability to distinguish true co-sensitization from cross-sensitization due to protein homology across different allergen sources [1] [2]. This is particularly valuable in several clinical scenarios:
- Pollen-associated food allergy syndrome: Patients with birch pollen allergy (sensitized to Bet v 1) often show cross-reactivity to PR-10 proteins in various plant foods (e.g., Mal d 1 in apple, Pru p 1 in peach) but typically experience only mild oral symptoms [2] [4].
- Latex-fruit syndrome: Cross-reactivity between latex (Hev b proteins) and various fruits (e.g., avocado, banana, kiwi) can be elucidated through component testing [2].
- Bird-egg syndrome: The relationship between bird allergens and egg yolk components (Gal d 5) can be clarified through CRD [1].
Prognostic Monitoring and Tolerance Development
CRD provides valuable prognostic biomarkers for predicting the natural course of food allergies and monitoring tolerance development:
- Persistent cow's milk allergy: Patients with persistent CMPA show stable IgE epitope-binding patterns, while development of tolerance is associated with decreased epitope binding by IgE and increased corresponding epitope binding by IgG4 [1].
- Baked milk tolerance: Children who tolerate baked milk products mainly generate IgE antibodies against conformational CMP epitopes (destroyed by high temperature), while those reactive to baked milk produce IgE against sequential CMP epitopes (especially casein) [1].
- Tolerance prediction: Monitoring casein-specific and beta-lactoglobulin-sIgE concentrations and IgE/IgG4 ratios can help predict which patients will develop tolerance to CM [1].
Experimental Protocols for Multiplex Allergen Quantification
MARIA for Foods Multiplex Array Protocol
The Multiplex Array for Indoor Allergens (MARIA) technology has been adapted for simultaneous quantification of specific food allergen proteins [6]. This protocol enables measurement of 17 allergens representing all foods regulated in the US, EU, and Japan.
Materials and Reagents
- Magnetic polystyrene beads (6.5 μm) containing unique fluorophores (Luminex Corporation)
- Monoclonal antibodies specific for target allergen proteins
- Purified allergen reference standards for quantification
- Biotinylated detection antibodies (monoclonal or polyclonal)
- Streptavidin-PE reporter fluorophore
- Luminex xMAP compatible analyzer (e.g., Luminex 200, FLEXMAP 3D, or MAGPIX)
- Assay buffers: Coupling buffer, washing buffer, blocking buffer
Bead Coupling Procedure
- Bead activation: Resuspend magnetic beads and activate surface carboxyl groups using EDC/sulfo-NHS chemistry
- Antibody coupling: Incubate activated beads with specific monoclonal antibodies (2-10 μg per 1.25 million beads) in coupling buffer for 2 hours with rotation
- Blocking: Block remaining active sites with blocking buffer containing protein stabilizers
- Storage: Resuspend coupled beads in storage buffer and store at 4°C until use
Multiplex Assay Workflow
- Sample preparation: Extract food samples in appropriate extraction buffer (PBS containing 0.005% Tween 20 recommended)
- Assay setup: Combine coupled bead mixture with standards, controls, or samples in 96-well plate
- Incubation: Incubate for 60-90 minutes with shaking to allow allergen capture
- Detection: Add biotinylated detection antibody cocktail and incubate for 60 minutes
- Signal development: Add streptavidin-PE and incubate for 30 minutes
- Reading: Analyze using Luminex analyzer, measuring median fluorescence intensity (MFI) for each bead region
Quality Control and Validation
- Standard curves: Generate for each allergen covering a 5-log dynamic range
- Intra-assay precision: CV ≤15% with recovery within 70-130%
- Inter-assay precision: CV ≤20% across multiple runs
- Specificity: Demonstrate minimal cross-reactivity between analytes
- Sensitivity: Determine limit of detection (LOD) and limit of quantification (LOQ) for each allergen
Diagram 1: MARIA Multiplex Assay Workflow for Allergen Quantification
The Scientist's Toolkit: Essential Research Reagents and Platforms
Table 3: Research Reagent Solutions for CRD and Multiplex Allergen Analysis
| Reagent/Platform | Function | Application Examples | Key Features |
|---|---|---|---|
| Recombinant Allergens | Defined antigen sources for IgE detection | Component-specific IgE measurement | High purity, batch-to-batch consistency, defined epitopes |
| Monoclonal Antibodies | Specific capture/detection of allergen components | MARIA array, ELISA development | Specificity for single epitopes, standardized reagents |
| Purified Allergen Standards | Quantification reference materials | Standard curves for multiplex assays | Certified concentrations, essential for harmonization |
| Luminex xMAP Beads | Multiplex assay solid phase | Simultaneous detection of multiple allergens | Magnetic or non-magnetic, multiple regions |
| Fluorescent Reporters | Signal generation | Streptavidin-PE, quantum dots | High sensitivity, multiple emission spectra |
| Microarray Platforms | High-throughput sIgE profiling | ISAC, FABER tests | Comprehensive sensitization profiles, minimal sample volume |
| Lateral Flow Strips | Rapid point-of-care testing | Quick allergen screening | No specialized equipment, rapid results |
Data Interpretation and Analytical Considerations
Quantitative and Semiquantitative Interpretation
CRD results require careful interpretation that considers both quantitative measurements and clinical relevance:
ISAC platform: Reports results in ISAC Standardized Units (ISU-E) with four interpretation categories:
- <0.3 ISU-E: Negative
- 0.3-1.0 ISU-E: Low-level positive
- 1.0-15.0 ISU-E: Moderately high
- ≥15.0 ISU-E: Very high [5]
Singleplex assays: Provide quantitative results in kUA/L with established clinical decision points for specific components [1] [3]
Limitations and Challenges
Despite its advanced capabilities, CRD has several important limitations:
- Diagnostic accuracy: No identified sIgE cutoff has shown specificity and sensitivity as accurate as the oral food challenge (OFC), which remains the gold standard for food allergy diagnosis [1].
- Clinical interpretation: Requires expertise to avoid over-prescribing unnecessary elimination diets and adrenaline auto-injectors based on sensitization patterns without clinical correlation [1].
- Analytical variability: Multiplex assays may show higher coefficients of variation in the lowest measurement range (<1.0 ISU-E) [5].
- Component availability: Not all relevant allergen components are available in current test systems [5].
Diagram 2: Molecular Basis of IgE-Mediated Allergy and CRD Measurement Principle
Future Directions and Research Applications
The evolution of CRD and multiplex allergen analysis continues to transform both clinical allergy practice and research:
- High-throughput multiplexing: New platforms like NULISA offer 250-plex capability with attomolar sensitivity, though validation in allergy applications is ongoing [7].
- Mass spectrometry applications: LC-MS/MS methods are being developed for allergen detection in complex food matrices, providing orthogonal validation for immunoassays [8] [6].
- Point-of-care technologies: Lateral flow immunoassays (LFIAs) are evolving with multiplex capabilities using spatial separation of detection sites and multiple colored labels for simultaneous detection of several allergens [9].
- Biomarker discovery: Integration of CRD with basophil activation tests (BAT) and epitope mapping approaches may provide enhanced biomarkers for reaction severity prediction [10].
For researchers implementing multiplex allergen analysis, the MARIA for Foods platform demonstrates how monoclonal antibody-based multiplex arrays can achieve standardized, specific quantification of allergen proteins across diverse food matrices, supporting applications in risk assessment, therapeutic product standardization, and exposure science [6].
Limitations of Traditional Singleplex Assays and Allergen Extracts
In the field of allergy research and diagnostics, the accurate quantification of specific allergenic proteins is paramount for risk assessment, clinical diagnosis, and the development of safer food products. For decades, the scientific community has relied on traditional methodologies centered on singleplex immunoassays and measurements against crude allergen extracts [11]. These techniques, particularly the enzyme-linked immunosorbent assay (ELISA), have been considered the 'workhorse' for allergen detection due to their robustness and established protocols [12] [13].
However, the characterization of complex, multifactorial diseases—and the allergenic potential of foods—often requires the analysis of multiple biomarkers to implement optimized therapeutic regimens or safety protocols [12] [13]. The limitations of traditional approaches become significantly apparent in this context. This application note details the specific constraints of singleplex assays and allergen extracts, framing them within the compelling rationale for a transition to multiplexed immunoassays for the simultaneous quantification of specific allergenic proteins.
Critical Limitations of Traditional Approaches
The Problem with Allergen Extracts
The use of crude allergen extracts as standards and capture materials introduces substantial variability and uncertainty into allergen analysis.
- Complex and Variable Composition: Crude extracts are heterogeneous mixtures of allergenic and non-allergenic proteins, sugars, lipids, and other matrix components from the source material [11]. The exact composition is not defined and can vary dramatically between production batches, cultivars, and cultivation conditions [11] [5].
- Uncertain Analytical Target: Immunoassays using these extracts are calibrated against the variable extract itself, not a pure allergenic protein [14]. This leads to ambiguity about what is actually being measured, making it difficult to correlate results with clinical allergenicity and hindering method harmonization between different kits and laboratories [14].
- Impact of Processing: Food processing can denature proteins, alter their solubility, and modify epitopes [11]. The ability of an antibody to recognize a target protein in a crude extract can be significantly diminished if processing changes the protein's structure, potentially leading to false negatives [11]. Furthermore, processing may induce the formation of new epitopes or expose hidden ones, which may not be present in the native extract used for calibration [11].
The Inefficiency of Singleplex Assays
While singleplex assays like ELISA are reliable for measuring a single analyte, they are poorly suited for comprehensive allergen profiling.
- High Consumption of Sample and Reagents: Profiling a sample for multiple allergens requires running a separate singleplex assay for each target. This consumes large volumes of often precious and limited sample, as well as significant quantities of reagents, thereby increasing costs [12] [13].
- Low Analytical Throughput: Running assays sequentially for multiple allergens is time-consuming and labor-intensive, limiting the number of samples that can be processed and delaying results [12].
- Insufficient for Complex Profiles: Allergic sensitization often involves recognition of multiple proteins, either from a single source or across different sources [5]. A singleplex approach provides a fragmented view and cannot efficiently capture the complete IgE-sensitization profile of a patient, which is critical for predicting severity and planning treatment [5].
The table below summarizes the core limitations of these traditional approaches.
Table 1: Core Limitations of Traditional Singleplex Assays and Allergen Extracts
| Aspect | Limitation | Impact on Research/Diagnostics |
|---|---|---|
| Extract Composition | Ill-defined, variable mixture of allergenic/non-allergenic components [14] [11] | Lack of standardization; poor reproducibility and comparability between labs [14] |
| Analytical Target | Ambiguous; measurement is against a variable extract, not a defined protein [14] | Results difficult to correlate with clinical relevance; unclear what is being quantified [14] |
| Processing Effects | Altered protein extractability and antibody binding due to denaturation/modification [11] | Risk of underestimating allergen content in processed foods (false negatives) [11] |
| Assay Throughput | Single analyte measured per test run [13] | High sample volume requirement; low efficiency for multi-allergen panels; increased time and cost [12] [13] |
| Diagnostic Resolution | Cannot efficiently map complex sensitization profiles to multiple proteins [5] | Limited ability to stratify patients, predict severity, or guide specific immunotherapy [5] |
Experimental Evidence: Quantifying the Limitations
Recovery Challenges from Complex Matrices
The accuracy of any immunoassay is contingent on the efficient extraction of the target protein from the sample matrix. Research has demonstrated that this is a major point of failure for traditional methods, especially with processed foods.
A systematic study aimed to optimize the extraction of 14 specific allergens from incurred food matrices. The results highlight the profound challenge of obtaining reliable recovery, particularly in challenging matrices like chocolate or baked goods, using even optimized buffers.
Table 2: Allergen Recovery from Processed Food Matrices Using Optimized Buffers
| Matrix | Processing Condition | Typical Recovery Range | Key Challenges |
|---|---|---|---|
| Chocolate Dessert | Non-baked | Often below 50% [14] | Interference from polyphenols, fats, and other compounds that bind proteins and impede extraction [14]. |
| Baked Biscuit | Thermal Processing (185°C, 15 min) | Lower than raw dough, often below optimal 50-150% range [14] | Heat-induced protein denaturation, aggregation, and matrix interactions that reduce solubility and antibody recognition [14] [11]. |
| Raw Biscuit Dough | Non-baked | 50-150% (with optimized buffers) [14] | Serves as a baseline, but recovery is still highly dependent on buffer composition (e.g., need for additives like fish gelatine or PVP) [14]. |
This evidence indicates that a "universal" extraction buffer is elusive, and that matrix effects can lead to a significant underestimation of allergen content, posing a risk to allergic consumers [14].
Comparability Issues Between Assay Formats
Data generated using different assay platforms may not be directly comparable, a critical consideration when merging datasets or transitioning technologies. A direct comparison of a multiplex immunoassay with established singleplex ELISAs revealed significant proportional biases.
For instance, compared to R&D Systems ELISAs, the Mesoscale Discovery (MSD) multiplex assay significantly overestimated IL-1β and IFN-γ, while underestimating IL-6 [15]. These were not constant biases but proportional, meaning the discrepancy changed with the analyte concentration. Correlations were also not consistently high, particularly for TNF-α (r=0.31) [15].
Crucially, these measurement differences can distort established biological relationships. The study simulated the effect by merging singleplex and multiplex data on the association between sugar-sweetened beverage intake and IL-6. The well-established positive association observed with singleplex data (+0.16 pg/mL per serving/day) was attenuated by 45% and became non-significant when only multiplex data were used [15]. This demonstrates that switching platforms mid-study can introduce significant bias and alter scientific conclusions.
Research Reagent Solutions
Transitioning to more advanced methodologies requires a specific set of reagents. The following table outlines essential materials for developing specific and multiplexed allergen analysis.
Table 3: Key Research Reagent Solutions for Advanced Allergen Analysis
| Reagent / Material | Function and Importance | Specific Examples / Notes |
|---|---|---|
| Defined Allergen Standards | Purified natural or recombinant allergenic proteins used for calibration and antibody generation. Essential for moving away from crude extracts [14]. | Recombinant Bet v 1, purified nGal d 1, recombinant Ara h 2 [14] [5]. |
| Specific Mono-/Polyclonal Antibodies | Antibodies raised against specific allergen components. Provide improved specificity and avoid cross-reactivities associated with antibodies raised against complex extracts [14]. | Critical for developing allergen-specific immunoassays [14]. |
| Optimized Extraction Buffers | Buffers designed to disrupt matrix interactions and maximize solubilization of specific allergens from complex, processed foods [14]. | Carbonate bicarbonate with 10% fish gelatine; PBS with 2% Tween, 1 M NaCl, 10% fish gelatine, and 1% PVP [14]. |
| Multiplex Solid Phases | The platform for simultaneous analysis, such as fluorescently-coded microspheres or planar microarray chips [12] [5] [16]. | Luminex xMAP beads, planar glass/silicon chips (e.g., MSD), nitrocellulose-based arrays [12] [16]. |
| High-Affinity Detection Probes | Labeled antibodies or other ligands for signal generation in a multiplex format. Require distinct emission spectra for parallel detection [5] [17]. | Fluorescently-labeled (e.g., FAM, VIC) anti-IgE or other detection antibodies [5] [17]. |
Experimental Protocol: Evaluating Allergen Recovery from Processed Matrices
This protocol is adapted from studies focused on optimizing the extraction of specific allergens from challenging, incurred food matrices to validate immunoassay accuracy [14].
Objective: To quantify the recovery efficiency of specific allergenic proteins from a processed food matrix (e.g., baked biscuit, chocolate dessert) using optimized extraction buffers.
Materials:
- Incurred food matrix (prepared with a known concentration of allergen source material)
- Placebo matrix (allergen-free)
- Allergen source material (e.g., peanut flour, milk powder) for calibration curves
- Optimized extraction buffers (e.g., Buffer D: 50 mM carbonate/bicarbonate, 10% fish gelatine, pH 9.6; Buffer J: PBS, 2% Tween-20, 1 M NaCl, 10% fish gelatine, 1% PVP, pH 7.4) [14]
- Centrifuge and vortex mixer
- Orbital incubator
- Allergen-specific multiplex array or ELISA kit
Procedure:
- Sample Preparation: Weigh out 1 g of homogenized incurred sample and placebo control into separate centrifuge tubes.
- Extraction: Add 10 mL of pre-warmed extraction buffer to each tube (1:10 w/v ratio). Vortex mix for 30 seconds to fully suspend the sample.
- Incubation: Incubate the samples in an orbital incubator at 60°C for 15 minutes, shaking at 175 rpm. This elevated temperature aids in solubilizing proteins.
- Clarification: Centrifuge the extracts at 1250 rcf for 20 minutes at 4°C to pellet insoluble debris.
- Supernatant Collection: Carefully collect the clarified supernatant from the middle of the tube, avoiding the surface lipid layer and the bottom pellet.
- Analysis: Analyze the extracts and a dilution series of the allergen source material (for calibration) using the allergen-specific immunoassay (multiplex or ELISA).
- Calculation: Calculate the percentage recovery for each specific allergen using the formula: Recovery (%) = (Measured concentration in incurred matrix / Theoretical concentration in incurred matrix) × 100
Workflow and Relationships Diagram
The following diagram illustrates the logical workflow and comparative pathways of traditional versus specific protein-based analysis, highlighting the key limitations and decision points.
Diagram 1: Workflow comparison of traditional and specific protein analysis pathways. The traditional path (left) is characterized by its reliance on crude extracts and singleplex methods, leading to significant limitations. The specific protein path (right) utilizes defined standards and multiplex technologies to achieve superior analytical outcomes.
Core Principles of Multiplex Immunoassay Technology
Multiplex immunoassay technology represents a significant advancement over traditional single-analyte immunoassays by enabling the simultaneous detection and quantification of multiple analytes from a single sample. Within food safety and allergy research, this technology has proven particularly valuable for the comprehensive analysis of specific allergenic proteins, addressing a critical need for accurate risk assessment and diagnostic applications [11] [6]. The core principle underpinning this methodology is the ability to measure multiple specific biomarkers concurrently, thereby conserving precious samples, reducing reagent costs, and providing a coherent data set for complex biological interpretations [18] [19]. For researchers investigating allergenic proteins, multiplex platforms offer unprecedented capability to profile complex sensitization patterns and detect multiple potential food allergens in a single run, transforming approaches to allergy diagnostics and food safety monitoring [20] [6].
Basic Technological Principles
Fundamental Concepts and Architecture
Multiplex immunoassays share the basic immunological principles of traditional sandwich ELISA, where an analyte is captured between a solid-phase-bound antibody and a detection antibody. The revolutionary advancement lies in the creation of a multi-analyte detection system through spatial or spectral encoding of the solid phase [18] [6]. This encoding allows multiple distinct immunoassays to occur simultaneously within the same reaction vessel, with the resulting signals deconvoluted based on their spatial location or spectral signature.
The assay workflow follows a logical progression from sample preparation to data interpretation, as illustrated below:
Two primary platform architectures dominate multiplex immunoassay technology: planar arrays and bead-based suspension arrays. Planar arrays immobilize capture antibodies in discrete, predefined locations on a flat surface such as a microscope slide or the bottom of a microtiter plate well [18]. In contrast, bead-based suspension arrays use microscopic beads as the solid phase, with each bead set coded by unique fluorescent intensities or ratios to represent a specific analyte [6] [19]. The bead-based approach, particularly the xMAP technology from Luminex Corporation, has gained widespread adoption due to its flexibility, scalability, and compatibility with standard laboratory equipment [6] [19].
Detection and Signal Measurement
Signal detection in multiplex immunoassays employs various mechanisms, with fluorescent and chemiluminescent detection being most common. In bead-based systems, two lasers excite the beads: one identifies the bead type based on its internal fluorescent code, while the second quantifies the analyte-bound detection antibody reporter fluorescence [21]. This dual-laser system enables simultaneous identification of the assay being measured and quantification of the analyte concentration.
For planar arrays, detection typically involves scanning the array surface with a high-resolution detector to measure signal intensity at each predefined spot [18] [22]. Advanced detection systems may utilize innovative technologies such as magnetic nanotags, which offer advantages including real-time read-out capabilities, reduced sensitivity to matrix effects, and elimination of washing steps that could disrupt low-affinity interactions [22].
Application to Allergenic Protein Research
Multiplex Approaches for Food Allergen Detection
In the context of allergenic protein research, multiplex immunoassays have been successfully developed to simultaneously quantify specific food allergen proteins from peanut, tree nuts, cow's milk, egg, soy, fish, shellfish, sesame, mustard, and celery [6]. These assays target the major allergen molecules that directly cause allergic reactions, such as Ara h 1, Ara h 2, and Ara h 3 from peanut; Gal d 1 and Gal d 2 from egg; and Bos d 5 from milk [6]. This molecular approach represents a significant advancement over traditional food allergen detection methods that often target undefined protein mixtures from a food source.
The "MARIA for Foods" multiplex array exemplifies this application, utilizing the Luminex xMAP platform with magnetic polystyrene beads containing unique fluorophores as the assay surface [6]. Allergen-specific monoclonal antibodies are covalently coupled to carboxyl groups on the bead surface to capture specific food allergens in solution. Bound allergens are then detected using a cocktail of biotinylated allergen-specific monoclonal antibodies followed by streptavidin conjugated to a fluorescent reporter (R-phycoerythrin) [6]. This approach allows for the simultaneous measurement of up to 17 allergens representing all foods regulated in the US, EU, and Japan, providing an efficient tool for risk assessment and standardization of therapeutic products for food allergy.
Multiplex Allergy Diagnostics
Beyond food safety testing, multiplex immunoassays have revolutionized allergy diagnostics by enabling component-resolved diagnostics, which identifies sensitization to specific allergen molecules rather than whole allergen extracts [11] [20]. Commercial multiplex allergy assays such as ISAC, ALEX, and EUROLINE utilize microarray technology to measure specific IgE antibodies against multiple allergenic components simultaneously from a small serum sample [20]. This approach reveals broad patterns of IgE-mediated sensitization, helping clinicians identify causative allergens, distinguish true primary allergies from cross-reactivities, and assess the risk of severe systemic reactions [20].
A particularly innovative application in this field is the multiplex allergen microarray-based immunoassay with IgE-binding inhibition, which enables the identification of numerous allergenic proteins recognized by IgE from allergic patients with a single test [11]. This method is especially valuable for evaluating how food processing affects allergenicity, as it can detect modifications in allergenic proteins that alter their capacity to bind IgE and cause allergic reactions [11].
Table 1: Performance Characteristics of Representative Multiplex Food Allergen Array
| Parameter | Performance Specification | Application Context |
|---|---|---|
| Dynamic Range | 5-log range | Covers clinically relevant concentrations [6] |
| Intra-assay Precision | CV ≤15% | Meets analytical validation criteria [6] |
| Inter-assay Precision | CV ≤15% | Ensures reproducibility across runs [6] |
| Recovery Rate | 70-130% | Validates accuracy in complex matrices [6] |
| Detection Limit | 3-100 ppm (incurred allergens in chocolate) | Sufficient for food allergen detection [6] |
Detailed Experimental Protocol
Bead-Based Multiplex Immunoassay Protocol
The following protocol describes a standardized procedure for bead-based multiplex immunoassay applicable to allergenic protein detection, adapted from established methodologies [6] [19]:
Materials Required:
- Magnetic carboxylated microspheres (Luminex Corporation)
- Purified allergens or allergen-specific monoclonal antibodies
- Phosphate Buffered Saline (PBS)
- Reaction Buffer (1% Bovine Serum Albumin in PBS)
- Rinsing Buffer (0.1% BSA-PBS with 0.05% Tween 20)
- Biotinylated detection antibodies
- R-phycoerythrin conjugated streptavidin
- 1-ethyl-3-(3-dimethyl aminopropyl) carbodiimide (EDAC)
- Sulfo-N-Hydroxysulfosuccinimide (Sulfo-NHS)
- Microplate shaker
- Luminex analyzer or compatible bead array reader
Coupling Protocol (Day 1):
- Bead Activation: Resuspend magnetic carboxylated microspheres and aliquot 1.25×10^6 beads per analyte into a microfuge tube. Pellet beads using a magnetic separator and remove supernatant.
- Wash Beads: Resuspend beads in 100 μL ultrapure water and pellet again. Remove supernatant completely.
- Activate Carboxyl Groups: Resuspend beads in 80 μL of 100 mM monobasic sodium phosphate, pH 6.2. Add 10 μL of 50 mg/mL Sulfo-NHS (freshly prepared) and 10 μL of 50 mg/mL EDAC (freshly prepared). Mix gently and incubate for 20 minutes at room temperature with constant mixing.
- Couple Capture Antibody/Allergen: Pellet beads and remove supernatant. Wash once with 250 μL of 50 mM MES, pH 5.0. Resuspend beads in 500 μL of 50 mM MES, pH 5.0, containing 50 μg of purified allergen or capture antibody. Incubate for 2 hours at room temperature with constant mixing.
- Block Remaining Active Groups: Pellet beads and remove supernatant. Block with 500 μL of PBS-TBN (PBS with 0.1% BSA, 0.02% Tween-20, and 0.05% sodium azide, pH 7.4) for 30 minutes at room temperature with mixing.
- Store Coupled Beads: Pellet beads, remove supernatant, and resuspend in 500 μL PBS-TBN. Count beads and adjust concentration to 1×10^7 beads/mL. Store protected from light at 4°C until use.
Assay Protocol (Day 2):
- Prepare Bead Mix: Create a working bead mixture by combining coupled beads for each analyte at a concentration of 1,000 beads per analyte per well in Reaction Buffer.
- Add Samples and Standards: Aliquot 50 μL of bead mixture into each well of a 96-well filter plate. Add 50 μL of standard, sample, or control to appropriate wells in duplicate.
- Incubate: Seal the plate and incubate for 2 hours at room temperature with continuous shaking at 350±20 rpm.
- Wash: Remove solution by vacuum filtration and wash beads three times with 100 μL Rinsing Buffer.
- Add Detection Antibodies: Add 50 μL of biotinylated detection antibody cocktail (prepared in Reaction Buffer at optimized concentrations) to each well.
- Incubate: Seal the plate and incubate for 1 hour at room temperature with shaking.
- Wash: Remove solution by vacuum filtration and wash beads three times with 100 μL Rinsing Buffer.
- Add Reporter: Add 50 μL of R-phycoerythrin conjugated streptavidin (diluted 1:100 in Reaction Buffer) to each well.
- Incubate: Seal the plate and incubate for 30 minutes at room temperature with shaking, protected from light.
- Wash and Resuspend: Remove solution by vacuum filtration, wash beads three times with 100 μL Rinsing Buffer, then resuspend in 100 μL Rinsing Buffer.
- Read Plate: Analyze immediately on Luminex analyzer, measuring at least 50 beads per analyte per well.
Critical Protocol Considerations
Several factors require special attention to ensure assay performance:
- Sample Quality: Food extracts must be prepared carefully as matrix components can interact with allergenic proteins, potentially modifying their immunological behavior [11].
- Antibody Specificity: Monoclonal antibodies should be thoroughly characterized for specificity to target allergenic proteins to minimize cross-reactivity [6].
- Interference Management: For IgE detection assays, consider including inhibition procedures for cross-reactive carbohydrate determinants (CCDs) that can complicate results [20].
- Standardization: Use purified allergen reference standards to ensure quantitative accuracy and inter-laboratory comparability [6].
Data Analysis and Normalization
The analysis of multiplex immunoassay data requires specialized statistical approaches to ensure robust biological interpretation. A stepwise approach to data analysis is recommended [23]:
Step 1: Data Acquisition and Cleanup Combine raw data with clinical/experimental annotations (e.g., cases vs. controls, severe vs. mild allergy). When multiple datasets are analyzed, implement normalization to bridge projects by adjusting medians from overlapping samples. Address missing data points, QC warnings, and remove non-representative samples [23].
Step 2: Quality Control and Exploratory Data Analysis Assess the overall data structure using principal component analysis (PCA) plots to identify outliers, non-normally distributed data, and other unusual configurations. Evaluate samples falling outside standard ranges for potential exclusion [23].
Step 3: Statistical Analysis Select appropriate statistical tests matching the biological question. Visualization through box plots and volcano plots can help present key results. Adjust for multiple testing to reduce false discovery rates, and annotate results based on existing knowledge of key proteins or pathways of interest [23].
Step 4: Biological Interpretation Apply biological context by assessing how differentially expressed or detected proteins relate to the disease or pathway of interest. Utilize comprehensive annotation databases with literature-derived information on pathway coverage and disease-related biomarkers [23].
Mixed-effects modeling has emerged as a powerful statistical framework for normalizing and analyzing multiplex bead-based immunoassay data [21]. This approach estimates both technical and biological sources of variance, with normalization achieved by subtracting the technical effects from measured values. Mixed-effects modeling enhances detection of true biological effects with greater precision and sensitivity while providing insight into the relative contributions of various technical factors to measurement variation [21].
Table 2: Comparison of Commercial Multiplex Allergy Assay Platforms
| Platform | Solid Phase | Allergen Components | Sample Volume | Key Features |
|---|---|---|---|---|
| ISAC | Microscope glass slide with polymer coating | Defined recombinant and natural allergens | 30-100 μL | High multiplexing capacity; standardized allergen coupling [20] |
| EUROLINE | Line blot strip with membrane areas | Allergens coupled in optimized way for each allergen | ~150 μL | Flexible design; overnight incubation option [20] |
| ALEX | Nitrocellulose membrane with nano-beads | Extensive allergen panel including extracts | Information missing | Combins extracts and molecular components; dedicated cartridge [20] |
The Scientist's Toolkit: Essential Research Reagents
Table 3: Research Reagent Solutions for Multiplex Allergen Detection
| Reagent Category | Specific Examples | Function and Application Notes |
|---|---|---|
| Solid Phase Matrices | Magnetic carboxylated microspheres (Luminex) | Provide scaffold for antibody coupling; spectral coding enables multiplexing [6] [19] |
| Capture Reagents | Allergen-specific monoclonal antibodies | Bind target analytes with high specificity; critical for assay sensitivity [6] |
| Detection Systems | Biotinylated antibodies + R-phycoerythrin-streptavidin | Signal generation; amplification system enhances detection limits [6] |
| Reference Standards | Purified natural or recombinant allergens (Ara h 2, Gal d 1, etc.) | Enable quantitative measurements; essential for assay standardization [6] |
| Buffer Systems | PBS with BSA and Tween-20 | Maintain protein stability; reduce non-specific binding [22] [19] |
| Coupling Reagents | EDAC, Sulfo-NHS | Facilitate covalent attachment of proteins to solid phase [19] |
Multiplex immunoassay technology provides a powerful framework for the simultaneous quantification of specific allergenic proteins, offering significant advantages in efficiency, sample conservation, and data richness compared to traditional single-analyte approaches. The core principles of spectral or spatial encoding of the solid phase, parallel immunoassay processing, and sophisticated data deconvolution have enabled transformative applications in food safety research and clinical allergy diagnostics. As the technology continues to evolve, ongoing efforts to standardize allergen reagents, improve assay sensitivity, and develop more robust data analysis pipelines will further enhance the value of multiplex immunoassays for researchers and clinicians working to understand and manage food allergies. The implementation of carefully optimized protocols, appropriate statistical tools, and rigorous quality control measures ensures that multiplex immunoassay data provides reliable, actionable insights into the complex world of allergenic proteins.
The quantification of specific allergenic proteins is a critical component of food safety research, therapeutic development, and clinical diagnostics. Traditional monoplex methods, such as Enzyme-Linked Immunosorbent Assays (ELISA), require separate tests for each target analyte, consuming substantial quantities of often precious and limited samples [13]. The emergence of multiplexed immunoassays represents a paradigm shift, enabling the simultaneous quantification of numerous allergenic proteins in a single reaction vessel. This application note details how this innovative approach specifically addresses two fundamental constraints in biomedical research: limited sample volume and the demand for greater experimental efficiency. By allowing researchers to extract significantly more data from a single sample, multiplexing is particularly transformative for studies involving rare clinical samples, longitudinal monitoring, and comprehensive allergen profiling where material is often irreplaceable [24] [25]. The core principle is the ability to measure multiple analytes in a single well, thereby conserving sample and reagents while generating a cohesive and comparable dataset that minimizes inter-assay variability [26].
Quantitative Advantages: A Data-Driven Comparison
The transition from monoplex to multiplex assays offers concrete, measurable benefits. The following tables summarize the key advantages, translating them into quantitative metrics relevant for researchers designing experiments for allergenic protein quantification.
Table 1: Comparative Analysis of Monoplex vs. Multiplex Immunoassays
| Parameter | Monoplex Immunoassay (e.g., ELISA) | Multiplex Immunoassay (e.g., Bead-Based Array) |
|---|---|---|
| Analytes per Sample | One | Dozens (e.g., 17+ allergenic proteins) [6] |
| Sample Volume Required | 50-100 µl per analyte | 25-50 µl for all analytes in the panel [27] [24] |
| Data Point Generation | Linear with number of assays | Exponential; single test generates a full profile |
| Dynamic Range | Typically 3-4 logs | Up to 5 logs or more, as demonstrated in food allergen arrays [6] |
| Inter-Assay Variability | Higher (multiple plates, days, operators) | Lower (all analytes measured under identical conditions) [26] |
Table 2: Exemplary Efficiency Gains in a Hypothetical 10-Allergen Study
| Experimental Task | Monoplex Workflow | Multiplex Workflow | Efficiency Gain |
|---|---|---|---|
| Total Sample Volume | 500 µl (10 assays × 50 µl) | 50 µl (1 assay) | 90% reduction |
| Total Hands-On Time | ~10 hours | ~2 hours | 80% reduction |
| Reagent Consumption | 10 plates or strips | 1 well of a 96-well plate | Significant savings |
| Data Consistency | 10 separate standard curves | 1 unified standard curve per analyte | Enhanced comparability |
Detailed Experimental Protocol: Multiplex Array for Food Allergens
The following protocol is adapted from methodologies successfully employed for the simultaneous quantification of 17 major food allergen proteins, including targets like Ara h 1 and Ara h 2 (peanut), Gal d 1 and Gal d 2 (egg), and Bos d 5 (milk) [6]. This protocol outlines a bead-based fluorescent multiplex immunoassay using the Luminex xMAP technology.
Principle
Magnetic polystyrene beads, each with a unique fluorescent signature (MagPlex beads), are coupled with allergen-specific monoclonal antibodies. These beads form the solid phase for a sandwich immunoassay. When a sample containing the target allergenic proteins is added, the antigens are captured by the bead-bound antibodies. After washing, a cocktail of biotinylated detection antibodies is added, forming a sandwich complex. The signal is generated by adding a streptavidin-phycoerythrin (SAPE) conjugate, and the fluorescence is measured using a dual-laser analyzer. One laser identifies the bead region (and thus the specific allergen), while the other quantifies the phycoerythrin signal, which is proportional to the amount of captured allergen [6].
Materials and Reagents
- MagPlex Microspheres: Pre-coupled with allergen-specific capture antibodies (e.g., anti-Ara h 2, anti-Gal d 1).
- Allergen Standard Curves: Purified, recombinant, or natural allergen proteins for each target.
- Biotinylated Detection Antibodies: A cocktail of monoclonal antibodies specific to the target allergens.
- Streptavidin-Phycoerythrin (SAPE): Signal amplification reagent.
- Assay Buffer: A phosphate-based buffer with protein blockers (e.g., BSA) to minimize non-specific binding [25].
- Wash Buffer: Phosphate Buffered Saline (PBS) with a detergent (e.g., Tween-20).
- 96-Well Microplate: A black, clear-bottom plate compatible with the magnetic washer and analyzer.
- Magnetic Plate Washer: For efficient separation of beads during washing steps.
- Luminex Analyzer: Such as a Bio-Plex or MAGPIX instrument.
Procedure
- Bead Preparation: Resuspend the coupled MagPlex beads by vortexing and sonicating. Combine the required bead regions into a single master mix in assay buffer.
- Plate Setup: Add 50 µl of the bead master mix to each well of the microplate.
- Standard and Sample Addition:
- Prepare a serial dilution of the allergen standards in assay buffer.
- Add 50 µl of standard, sample, or control to the appropriate wells. Use a representative control sample (e.g., a pooled serum or incurred food matrix) in duplicate on each plate for normalization [26].
- Incubation: Seal the plate and incubate for 90-120 minutes on a plate shaker (e.g., 500 rpm) at room temperature, protected from light.
- Washing: Place the plate on a magnetic washer. After bead separation, carefully aspirate the supernatant. Wash the beads twice with 100 µl of wash buffer.
- Detection Antibody Incubation: Add 50 µl of the biotinylated detection antibody cocktail to each well. Reseal, and incubate for 45-60 minutes with shaking.
- Washing: Repeat the magnetic washing step twice.
- SAPE Incubation: Add 50 µl of the SAPE solution to each well. Reseal, and incubate for 15-30 minutes with shaking, protected from light.
- Final Washing and Resuspension: Perform a final magnetic wash. After aspiration, resuspend the beads in 100-125 µl of assay buffer.
- Analysis: Run the plate on the Luminex analyzer. The instrument will measure at least 50 beads per region and report the median fluorescence intensity (MFI) for each analyte.
Data Analysis
- Use the standard curve for each allergen to convert MFI values into concentration units (e.g., µg/g or ng/mL).
- The standard curves typically exhibit a 5-log dynamic range [6].
- Data analysis software (e.g., Bio-Plex Manager) automatically fits the standard curve (often using a 5-parameter logistic model) and calculates sample concentrations.
- Intra- and inter-assay precision should be monitored, with coefficients of variation (CV) ideally ≤15% and recovery within 70-130% [6].
Workflow Visualization: From Sample to Data
The following diagram illustrates the streamlined, parallel-processing workflow of a multiplex immunoassay compared to the sequential nature of monoplexing, highlighting the points of efficiency gain.
The Scientist's Toolkit: Essential Research Reagent Solutions
Success in multiplex immunoassay development and execution relies on a set of core components. The selection and quality of these reagents are paramount for achieving high specificity, sensitivity, and reproducibility.
Table 3: Key Research Reagents for Multiplex Allergen Immunoassays
| Reagent / Solution | Critical Function | Key Considerations for Allergen Research |
|---|---|---|
| Capture Beads | Solid phase for immobilizing allergens; unique spectral signature identifies the assay. | Beads must be coupled with highly specific monoclonal antibodies against defined allergenic proteins (e.g., Ara h 6, Gal d 2) to ensure accurate molecular quantification [6]. |
| Allergen Standards | Purified proteins used to generate the calibration curve for quantification. | Recombinant or purified natural allergens are essential. Must be well-characterized to ensure the assay measures the correct, clinically relevant protein [6]. |
| Detection Antibody Cocktail | A mixture of biotinylated antibodies that bind captured allergens for signal generation. | Antibody pairs must be screened for optimal performance together in a multiplex format. A universal buffer must be found that works for all antibodies in the cocktail [25]. |
| Assay Diluent | Buffer matrix for diluting standards and samples. | Must be optimized to minimize matrix effects from complex food or clinical samples and to reduce non-specific binding, which is crucial for low-abundance allergens [25]. |
| Signal Amplification Reagent | Streptavidin-conjugated Phycoerythrin (SAPE) binds to biotin, providing a fluorescent signal. | Provides high sensitivity, enabling detection of low-level contaminations. Stability of the conjugate is critical for inter-assay reproducibility. |
Multiplexed immunoassays offer an undeniable strategic advantage in the field of allergenic protein research by directly addressing the critical challenges of sample volume conservation and experimental efficiency. The ability to simultaneously quantify a comprehensive panel of specific allergenic proteins—from peanut, egg, milk, and beyond—from a single, minimal sample volume transforms experimental design possibilities [6]. This approach not only preserves precious and irreplaceable samples but also generates higher-quality, more consistent data by eliminating inter-assay variability. As the demand for precise, component-resolved diagnostics and rigorous food safety monitoring grows, the adoption of multiplexed methodologies will continue to be a cornerstone of efficient and impactful scientific inquiry.
Immunoglobulin E (IgE)-mediated allergy is a type I hypersensitivity disorder affecting over 25% of the population in developed countries [28]. This condition occurs when susceptible individuals produce IgE antibodies against harmless environmental antigens (allergens), leading to symptoms ranging from mild rhinitis to life-threatening anaphylaxis [28]. The fundamental biological mechanism involves the binding of IgE to high-affinity FcεRI receptors on mast cells and basophils, where subsequent allergen-mediated cross-linking of receptor-bound IgE triggers immediate release of inflammatory mediators [28]. The allergenic potency of proteins is determined not merely by their presence but by structural and immunological characteristics, particularly the arrangement and properties of B-cell epitopes recognized by IgE antibodies. Advances in molecular allergology have revealed that the spatial distribution, density, and cross-reactivity of these epitopes critically influence the magnitude of effector cell activation and clinical manifestations [28] [29]. Within the framework of allergenic protein research, multiplexed immunoassays provide powerful tools for simultaneous quantification of specific IgE antibodies against numerous allergenic molecules, enabling detailed sensitization profiling that surpasses extract-based diagnostics [5]. This application note examines the biological foundation of IgE-epitope interactions and details experimental protocols for epitope characterization using advanced multiplexing platforms.
Biological Foundations of IgE-Mediated Allergy
The IgE Activation Cascade
The IgE-mediated allergic response initiates when allergens cross-link specific IgE antibodies bound to FcεRI receptors on mast cells and basophils. Early research by Landsteiner demonstrated that polyvalent antigens are required to trigger anaphylaxis, whereas monovalent haptens cannot induce this response [28]. This cross-linking activates intracellular signaling pathways leading to immediate release of preformed mediators (e.g., histamine) and synthesis of newly formed mediators (e.g., leukotrienes and prostaglandins) [28]. These mediators collectively cause vasodilation, increased vascular permeability, bronchoconstriction, and immune cell recruitment—manifesting as acute allergic inflammation.
Epitope Characteristics Governing Allergenic Activity
Recent research has identified several epitope properties that determine allergenic potency:
Epitope Proximity: The spatial arrangement of IgE binding sites on an allergen surface significantly impacts immune complex formation and effector cell activation. Studies with engineered allergens demonstrate that closely spaced epitopes form compact, ring-shaped immune complexes that potently induce basophil degranulation, while distantly spaced epitopes form open, chain-like complexes with reduced allergenic activity [28].
Epitope Cross-Reactivity: Many patients exhibit IgE antibodies that recognize structurally similar epitopes across different allergen sources. Protein families with high cross-reactivity include tropomyosins (shellfish, mites), lipid transfer proteins, and pathogenesis-related proteins (PR-10) [29]. Cross-reactive carbohydrate determinants (CCDs) were historically considered clinically irrelevant, though the α-Gal epitope (galactose-α-1,3-galactose) represents a notable exception, causing delayed anaphylaxis to red meat following tick bites [29].
Epitope Diversity: The number of distinct epitopes recognized by a patient's IgE repertoire (epitope diversity) correlates with allergy severity and persistence. Patients with persistent milk or egg allergy typically possess IgE antibodies targeting sequential epitopes, whereas those who outgrow these allergies primarily recognize conformational epitopes [30].
The following diagram illustrates the fundamental IgE activation mechanism and how epitope proximity influences immune complex formation and signaling strength:
Quantitative Analysis of Epitope-Specific IgE Responses
Performance Comparison of Multiplex Assay Platforms
Table 1: Technical Performance Characteristics of Multiplex Allergy Assays
| Assay Platform | Allergens/Components Detected | Sensitivity | Reproducibility (CV) | Sample Volume | Measurement Range |
|---|---|---|---|---|---|
| ImmunoCAP ISAC 112 [5] | 112 single allergens from 51 sources | High for majority of components | Average CV <20% for intra- and inter-assay | Minimal (serum/plasma) | 0.3-100 ISU-E (semiquantitative) |
| Bead-Based Epitope Assay (BBEA) [30] | Customizable peptide libraries (e.g., 66 milk epitopes, 50 peanut epitopes) | Greater than peptide microarrays | High intra- and inter-laboratory reproducibility | Minimal (serum/plasma) | MFI converted to binding scores |
| AllerBead with PC-PURE [31] | 8 most common pediatric food allergens | 96% sensitivity vs ImmunoCAP | High specificity (97%) | Minimal (capillary blood compatible) | Quantitative sIgE concentrations |
| Microarray-based (ADAM) [5] | 22 allergen extracts, 4 single allergens | Limited published data | Limited published data | Standard serum volumes | Semiquantitative |
Key Findings from Epitope Proximity Studies
Table 2: Impact of IgE Epitope Arrangement on Immune Complex Formation and Function
| Epitope Configuration | Immune Complex Structure | Basophil Activation Potential | In Vivo Anaphylactic Severity | Experimental Model |
|---|---|---|---|---|
| Closely spaced epitopes (adjacent positions) [28] | Compact, ring-shaped complexes | High degranulation response | Severe body temperature drop (core symptom) | Engineered myoglobin allergens with grafted Phl p 1 epitopes |
| Distantly spaced epitopes (different molecular ends) [28] | Open, short-chain complexes | Reduced degranulation response | Milder anaphylactic response | Engineered myoglobin allergens with grafted Phl p 1 epitopes |
| Monovalent epitopes [28] | No complex formation | No activation (can induce "antianaphylaxis") | No response | Hapten studies |
Experimental Protocols for Epitope Characterization
Bead-Based Epitope Assay (BBEA) for High-Throughput Epitope Profiling
The BBEA enables simultaneous quantification of antibodies binding to multiple sequential epitopes using minimal serum volumes [30].
Protocol Steps:
- Epitope Coupling: Covalently couple synthesized peptides (representing sequential epitopes) to unique fluorescent-coded magnetic microspheres (Luminex beads) using standard carbodiimide chemistry.
- Master Library Preparation: Combine epitope-coupled beads to create a multiplexed master library. Dispense into 96-well microplates.
- Sample Incubation: Add patient serum or plasma (typically 1:10 dilution) to wells containing the bead library. Incubate for 2 hours with shaking at room temperature.
- Detection: After washing, add fluorophore-labeled secondary antibodies (anti-human IgE or IgG4). Incubate for 1 hour protected from light.
- Signal Measurement: Analyze using a Luminex instrument with dual-laser detection (red laser classifies beads, green laser quantifies bound antibody via median fluorescence intensity [MFI]).
- Quality Control: Include control wells with only master library and secondary antibodies to quantify non-specific binding. Exclude samples with average bead counts <30 per peptide.
- Data Normalization: Apply log2 transformation with added constant (0.5) to MFI values, then subtract average non-specific binding values to generate normalized binding scores.
Technical Considerations:
- The assay demonstrates minimal well position effects, allowing replicates to be placed in adjacent wells without introducing bias [30].
- Plate effects (batch variability) can account for 8-31% of total variability but are correctable using multivariable linear modeling [30].
- The protocol supports customization of peptide libraries and detection antibodies based on research requirements.
The following workflow diagram outlines the key procedural steps in the BBEA protocol:
Photocleavage-Based Purification for Multiplex Allergy Testing
The PC-PURE (Photocleavage-Based Affinity Purification) method eliminates matrix effects that impair multiplex immunoassay performance [31].
Protocol Steps:
- Capture Antibody Immobilization: Incubate photocleavable anti-IgE antibodies with patient serum, forming complexes with total IgE.
- Purification: Wash complexes to remove serum matrix components (lipids, heterophile antibodies, other proteins) that cause interference.
- Photocleavage Release: Expose complexes to UV light at specific wavelength, cleaving the photocleavable linker and releasing purified IgE.
- Multiplex Detection (AllerBead Assay): Incubate purified IgE with allergen-coated coded microspheres targeting the eight most common pediatric food allergens (milk, soy, wheat, egg, peanuts, tree nuts, fin fish, shellfish).
- Quantification: Detect bound allergen-specific IgE using fluorescent anti-IgE antibodies and Luminex technology.
Validation Data:
- Implementation of PC-PURE with AllerBead demonstrated 96% sensitivity and 97% specificity compared to ImmunoCAP reference standard [31].
- Without PC-PURE purification, sensitivity decreased to 59%, highlighting the critical impact of matrix effects on multiplex assay performance [31].
Table 3: Key Reagents and Bioinformatics Tools for Epitope and Allergen Research
| Resource Category | Specific Tools/Reagents | Key Features/Functions | Research Applications |
|---|---|---|---|
| Allergen Databases | Structural Database of Allergenic Proteins (SDAP 2.0) [32] | 3,354 data entries (1,657 sequences, 334 structures, 1,565 AlphaFold2 models); integrated bioinformatics tools | Epitope similarity analysis, cross-reactivity prediction, structural modeling |
| AllergenPro [33] | 2,434 allergen records; FAO/WHO, motif-based, and epitope-based prediction tools | Allergenicity prediction, cross-reactivity assessment | |
| Assay Platforms | Luminex xMAP Technology [30] | Bead-based multiplex immunoassay platform; customizable peptide coupling | High-throughput epitope profiling (BBEA), antibody repertoire analysis |
| ImmunoCAP ISAC 112 [5] | Microarray-based multiplex assay for 112 allergen components | Component-resolved diagnostics, sensitization pattern analysis | |
| Engineering Tools | Scaffold Protein Systems [28] | Engineered myoglobin derivatives with grafted IgE epitopes | Controlled investigation of epitope proximity effects on immune complex formation |
| Specialty Reagents | Photocleavable Antibodies [31] | UV-cleavable capture antibodies for biomarker purification | Matrix effect elimination in multiplex assays (PC-PURE protocol) |
The biological basis of IgE-mediated allergy extends beyond mere allergen recognition to encompass sophisticated mechanisms governed by epitope proximity, cross-reactivity, and diversity. The strategic implementation of multiplexed immunoassays—including bead-based epitope assays, microarray platforms, and innovative purification techniques—provides researchers with powerful methodological approaches to dissect these complex IgE-epitope interactions at unprecedented resolution. The experimental protocols and resources detailed in this application note establish a foundation for advanced research into allergenic protein epitopes, supporting development of improved diagnostic, prognostic, and therapeutic strategies for allergic diseases. As these technologies continue to evolve, they will further elucidate the intricate relationship between epitope-specific antibody repertoires and clinical allergy phenotypes, ultimately enabling more personalized management of allergic conditions.
Methodological Applications in Allergy Research and Clinical Stratification
Multiplexed immunoassays have become indispensable in allergenic protein research, enabling the simultaneous quantification of multiple specific allergens from a single sample. These advanced platforms address critical limitations of traditional single-analyte methods like ELISA, which prove insufficient for characterizing complex allergic sensitization profiles and detecting cross-reactive proteins. This application note provides a detailed technical comparison of four leading multiplex immunoassay platforms—Luminex xMAP, MSD, Olink PEA, and NULISA—within the context of allergenic protein research. We present standardized experimental protocols, performance characteristics, and pathway analyses to guide researchers in selecting appropriate methodologies for specific applications in food allergy, respiratory allergy, and biomarker discovery.
The following table summarizes the core characteristics and performance metrics of the four multiplex platforms relevant to allergenic protein research.
Table 1: Comparative Analysis of Multiplex Immunoassay Platforms
| Platform | Core Technology | Plex Level | Sensitivity | Dynamic Range | Sample Volume | Key Applications in Allergy Research |
|---|---|---|---|---|---|---|
| Luminex xMAP | Bead-based array with fluorescent barcoding [34] | High (15+ allergens) [34] | Varies by assay; sufficient for ≤10 μg/g in food samples [34] | 3-5 log [6] | ~50 μL [34] | Multiplex food allergen detection (xMAP FADA) [34]; Specific allergen quantification (MARIA) [6] |
| MSD (Meso Scale Discovery) | Electrochemiluminescence on multi-array spots [35] | High | High (compared to ImmunoCAP and SPT) [35] | Not specified | 25 μL [35] | Respiratory allergy sensitization profiling [35] |
| Olink PEA | Proximity Extension Assay with DNA barcoding [36] | Medium (92-plex panels) [36] | High sensitivity for low-abundance proteins [36] | Broad [36] | 50 μL [36] | Biomarker discovery for seasonal allergic rhinitis [36]; Asthma endotyping [37] |
| NULISA | Sequential immunocomplex capture and release with NGS readout [38] | Very High (250-plex panels) [39] | Attomolar (fg/mL) [39] [38] | Up to 12 logs [38] | Not specified | Comprehensive inflammatory profiling [39] |
Platform-Specific Experimental Protocols
Luminex xMAP for Food Allergen Detection (xMAP FADA Protocol)
The xMAP Food Allergen Detection Assay (xMAP FADA) enables simultaneous detection of 15 food allergens plus gluten and sesame, utilizing built-in analytical redundancy with complementary antibody bead sets for confirmatory analysis [34].
Materials:
- xMAP FADA kit (Radix BioSolutions) containing antibody-conjugated magnetic beads
- Phosphate Buffered Saline (PBS) with 0.05% Tween-20 or UD Buffer
- SDS and β-mercaptoethanol for reduced-denatured extracts
- Luminex MAGPIX or FLEXMAP 3D instrument
Extraction Protocol:
- Sample Preparation: Homogenize food samples and aliquot 1g into 50mL conical tubes
- Dual Extraction:
- Buffered-detergent extraction: Use PBS with 0.05% Tween-20 (1:10 sample:buffer ratio)
- Reduced-denatured extraction: Use 0.5% SDS/2% β-mercaptoethanol for problematic matrices
- Extraction Conditions: Vortex for 30 seconds, incubate at 60°C for 15 minutes with orbital shaking at 175 rpm [14]
- Clarification: Centrifuge at 1,250 rcf for 20 minutes at 4°C, collect supernatant
Assay Procedure:
- Bead Preparation: Combine 29 antibody-conjugated bead sets targeting different allergens
- Assay Incubation: Mix 50μL sample extract with antibody-bead cocktail, incubate 2 hours with shaking
- Detection: Add biotinylated detection antibodies, incubate 1 hour, then add streptavidin-PE
- Analysis: Analyze on Luminex instrument, collect median fluorescent intensity (MFI)
- Data Analysis: Apply ratio analysis between complementary bead sets to distinguish cross-reactive antigens
Performance Characteristics: The xMAP FADA successfully detected allergens in food matrices including meat sausage, orange juice, baked muffins, and dark chocolate at concentrations ≤10 μg/g in the original food sample, with inter-laboratory %CV for ratio analyses <20% [34].
MSD Multiplex Immunoassay for Respiratory Allergens
Materials:
- MSD MULTI-ARRAY 96-well plates pre-coated with allergen extracts
- MSD Read Buffer T
- MSD MESO SECTOR S 600 instrument
- Allergen-specific standards and controls
Assay Protocol:
- Sample Preparation: Dilute serum or plasma samples 1:10 with diluent
- Plate Preparation: Add 25μL standards, controls, and samples to assigned wells
- Incubation: Incubate plate for 2 hours at room temperature with shaking
- Washing: Wash plate 3× with PBS-Tween wash buffer
- Detection: Add sulfo-tag labeled detection antibodies, incubate 2 hours
- Reading: Add Read Buffer, analyze plate on MSD instrument
- Data Analysis: Generate standard curves for each allergen, calculate specific IgE concentrations
Performance Characteristics: The MSD multiplex immunoassay showed ≥78% sensitivity for most allergens compared to SPT and ImmunoCAP, with specificity ≥87% (majority 100%) [35]. The assay demonstrated high comparability with conventional methods except for house dust mite, with low inter- and intra-assay variation and good reproducibility.
Olink PEA for Allergy Biomarker Discovery
Materials:
- Olink Target 96 Inflammation panel (Olink Bioscience)
- Thermal cycler and qPCR instrument or next-generation sequencer
- 50μL serum or plasma per sample
Assay Protocol:
- Sample Preparation: Dilute samples if necessary, aliquot into 96-well plate
- Assay Setup: Add incubation controls and PEA probe mix (paired antibodies with DNA oligonucleotides)
- Hybridization: Incubate 1 hour at 4°C followed by 1 hour at room temperature
- Extension & Detection:
- Transfer solution to PCR plate
- Perform extension reaction (20 cycles) to create DNA barcodes
- Quantify barcodes by qPCR or NGS
- Data Analysis: Normalize data using internal controls, express results in NPX (Normalized Protein Expression) values
Performance Characteristics: The Olink platform identified 36 significantly upregulated inflammation-related proteins in seasonal allergic rhinitis patients, with within-run precision CV of 7% and between-run precision CV of 21% for specific targets like Allergin-1 [36] [40]. The platform successfully identified key biomarkers including GDNF, IL-18R1, and IL-15RA strongly correlated with SAR symptoms [36].
NULISA for Comprehensive Inflammatory Profiling
Materials:
- NULISAseq Inflammation Panel 250 (Alamar Biosciences)
- ARGO HT System for automated processing
- NGS library preparation reagents
- Illumina sequencing platform
Assay Protocol:
- Sample Preparation: Dilute plasma/serum samples according to panel requirements
- Immunoassay Setup:
- Add samples to wells containing target-specific capture probes
- Incubate to form primary immune complexes
- Sequential Capture:
- Add universal capture probes to immobilize complexes
- Wash to remove non-specifically bound material
- Signal Amplification:
- Release target-specific barcodes via strand displacement
- Amplify barcodes via PCR for NGS readout
- Sequencing & Analysis:
- Pool libraries and sequence on Illumina platform
- Map reads to target-specific barcodes for quantification
Performance Characteristics: NULISA achieves attomolar sensitivity (low fg/mL) with up to 12-log dynamic range, enabling detection of low-abundance inflammatory biomarkers critical for allergy research [39] [38]. The fully automated workflow generates results in <15 hours with <30 minutes hands-on time.
Signaling Pathways in Allergic Inflammation
The following diagrams illustrate key signaling pathways involved in allergic inflammation that can be investigated using these multiplex platforms.
Diagram 1: Allergic inflammation signaling pathways. Key inhibitory receptor Allergin-1 (MILR1) negatively regulates IgE-mediated mast cell activation and suppresses type I immediate hypersensitivity reactions [40].
Multiplex Assay Workflows
Diagram 2: Comparative workflows for multiplex immunoassay platforms. Each platform employs distinct detection mechanisms while enabling simultaneous measurement of multiple allergenic proteins.
Research Reagent Solutions
Table 2: Essential Research Reagents for Multiplex Allergen Analysis
| Reagent Category | Specific Examples | Function in Allergen Research |
|---|---|---|
| Capture/Detection Antibodies | Allergen-specific monoclonal antibodies (e.g., anti-Ara h 2, anti-Gal d 1) [6] | Enable specific quantification of clinically relevant allergen molecules in multiplex arrays |
| Extraction Buffers | PBS with 2% Tween-20, 1M NaCl; Carbonate bicarbonate with fish gelatine [14] | Optimize recovery of specific allergens from complex processed food matrices |
| Reference Standards | Purified natural or recombinant allergens (e.g., Ara h 1, Bos d 5, Gal d 2) [6] | Provide standardized quantification and harmonization across laboratories |
| Blocking Agents | Fish gelatine (10%), PVP (1%), Non-fat dry milk (2.5%) [14] | Reduce non-specific binding and matrix interference in complex samples |
| Signal Amplification Reagents | Streptavidin-phycoerythrin (xMAP), SULFO-TAG (MSD), DNA polymerases (Olink/NULISA) [34] [35] [36] | Enhance detection sensitivity for low-abundance allergens |
The selection of an appropriate multiplex immunoassay platform for allergenic protein research depends on specific application requirements. Luminex xMAP offers proven performance for food allergen detection with built-in confirmatory analysis. MSD provides robust respiratory allergen profiling with high sensitivity and specificity. Olink PEA enables comprehensive biomarker discovery with excellent data quality, while NULISA represents the cutting edge in sensitivity and multiplexing capacity for inflammatory profiling. Understanding the technical capabilities, protocols, and performance characteristics of each platform enables researchers to design optimal strategies for quantifying specific allergenic proteins across diverse research applications.
Biomarker Discovery and Profiling Complex Immune Responses
Multiplexed immunoassays have revolutionized the study of complex immune responses by enabling the simultaneous quantification of numerous protein biomarkers from miniscule sample volumes [41]. This capability is particularly transformative for allergy research, a field characterized by heterogeneous diseases driven by intricate networks of immune cells and signaling proteins. The ability to comprehensively profile allergenic proteins and their corresponding immune responses provides researchers and drug development professionals with unprecedented insights into disease endotypes, patient stratification, and therapeutic monitoring [42] [43].
This application note details standardized protocols for implementing multiplexed immunoassays in biomarker discovery for allergic diseases. We provide performance comparisons of leading platforms, detailed experimental methodologies for analyzing complex immune responses, visualization of key workflows, and essential reagent solutions to facilitate robust, reproducible research in this rapidly advancing field.
Multiplexed Immunoassay Platforms: A Comparative Analysis
Selecting an appropriate multiplex platform is critical for successful biomarker discovery. The choice involves balancing sensitivity, multiplexing capacity, sample volume requirements, and data output characteristics. Below we compare three advanced platforms recently evaluated for profiling protein biomarkers in challenging sample matrices.
Table 1: Comparison of Multiplex Immunoassay Platforms
| Platform Feature | Meso Scale Discovery (MSD) | NULISA | Olink |
|---|---|---|---|
| Technology Principle | Electrochemiluminescence (ECL) | Nucleic Acid Linked Immuno-Sandwich Assay | Proximity Extension Assay (PEA) |
| Assay Multiplexity | Custom panels (e.g., 43-plex) | Preconfigured 250-plex panel | Preconfigured 92-plex panel |
| Sensitivity (Detectability of Shared Proteins) | 70% (Highest) | 30% | 16.7% |
| Sample Volume Requirement | Higher | Lower | Lower |
| Data Output | Absolute Protein Concentrations | Relative Quantification | Relative Quantification (NPX) |
| Key Advantage | Superior sensitivity; enables sample normalization | High-plex capability with minimal sample | High specificity; minimal cross-reactivity |
A recent head-to-head comparison of these platforms for analyzing stratum corneum tape strips (SCTS)—a non-invasive sampling method challenged by extremely low protein yield—demonstrated that MSD provided the highest detection sensitivity, identifying 70% of shared proteins compared to 30% for NULISA and 16.7% for Olink [7]. This high sensitivity is paramount when analyzing limited or low-abundance samples. Furthermore, MSD uniquely provided absolute protein concentrations, enabling normalization for variable sample content, a crucial feature for quantitative analyses [7]. Conversely, NULISA and Olink required smaller sample volumes and fewer assay runs, making them suitable for volume-limited studies where high-plex profiling is prioritized over absolute quantification [7].
Experimental Protocol: Biomarker Profiling in Allergic Contact Dermatitis
This protocol outlines the procedure for multiplexed analysis of protein biomarkers from stratum corneum tape strips, a method applicable to various inflammatory skin diseases including allergic and irritant contact dermatitis [7].
Sample Collection and Preparation
- Tape Stripping: Using circular adhesive tape strips (e.g., DSquame, 1.5 cm²), apply to the skin site of interest (e.g., patch test reaction or control site). Press down with consistent pressure for 5 seconds before removing with tweezers. Collect 10 consecutive strips per site and store immediately at -80°C [7].
- Sample Selection: For analysis, select tapes from the middle of the collection series (e.g., the 4th, 6th, and 7th strips), where cytokine concentrations have been shown to be most stable [7].
- Protein Extraction:
- Add 0.8 mL of extraction buffer (PBS containing 0.005% Tween 20, pH 7.4) to the 4th tape strip in a sample vial.
- Sonicate the sample in an ice bath for 15 minutes using an ultrasound cleaner.
- Transfer the resulting extract to the 6th tape strip, and subsequently use this extract for the 7th tape strip. This sequential extraction concentrates proteins from multiple tapes into a single extract.
- Centrifuge the final extract briefly to pellet any insoluble debris.
- Aliquot the supernatant into 200 µL portions and store at -80°C until analysis [7].
Multiplex Immunoassay Analysis
- Platform Selection and Setup: Based on the comparative data in Section 2, select an appropriate platform (e.g., MSD, NULISA, or Olink). Reconstitute all reagents and prepare standards and quality controls (QC) according to the manufacturer's instructions.
- Assay Execution:
- Thaw samples on ice and centrifuge at high speed for 10 minutes to remove any precipitates.
- Dilute samples to the optimal concentration determined for the chosen platform (e.g., a 1:1000 dilution may be suitable for pre-vaccination/timepoint samples, while a 1:100,000 dilution may be needed for post-vaccination/timepoint samples with high antibody titers) [44].
- Load samples, standards, and QCs onto the assay plate in predetermined replicates (e.g., standards in duplicate, QCs in quadruplicate).
- Follow the manufacturer's protocol for incubation steps, washes, and addition of detection antibodies.
- Data Acquisition and Validation:
- Run the plate on the appropriate instrument (e.g., MSD QuickPlex SQ120, Luminex analyzer, or Olink reading station).
- Validate the assay run by ensuring that QC samples fall within acceptable pre-defined ranges and that standard curves exhibit a strong fit (e.g., R² > 0.99).
- For absolute quantification, use the standard curve to interpolate sample concentrations. For relative quantification (e.g., Olink NPX), use the normalized protein expression values provided by the platform's software [7] [44].
Data Analysis
- Normalization: Normalize data if required (e.g., using absolute concentrations from MSD to account for variable tape strip protein content) [7].
- Statistical Analysis: Perform statistical analyses (e.g., t-tests, ANOVA, correlation analyses) to identify biomarkers that are significantly differentially expressed between experimental groups (e.g., control vs. dermatitis-affected skin). Calculate interclass correlation coefficients (ICC) to assess agreement between different platforms for shared proteins [7].
Figure 1: Experimental workflow for multiplexed biomarker profiling from skin tape strips, highlighting key steps from sample collection through data analysis.
Advanced Application: Bead-Based Epitope Assay for Food Allergy
Beyond soluble protein biomarkers, mapping IgE-binding epitopes is instrumental for developing novel diagnostics and prognostic tools for food allergy. The Bead-Based Epitope Assay (BBEA) enables high-throughput, sensitive profiling of epitope-specific antibody repertoires [30].
BBEA Protocol
- Epitope Library Design: Design a library of peptides representing sequential epitopes from major allergens (e.g., 50 epitopes from Ara h 1, Ara h 2, and Ara h 3 for peanut allergy) based on published literature [30].
- Bead Coupling: Covalently couple each unique peptide to distinctly fluorescent-coded magnetic microspheres (Luminex beads). Combine coupled beads to create a multiplex master epitope library [30].
- Assay Procedure:
- Add the master epitope library to a 96-well microplate.
- Incubate with patient serum or plasma.
- Add fluorophore-labeled secondary antibodies (e.g., anti-IgE or anti-IgG4).
- Include control wells with only the master library and secondary antibody to measure non-specific binding (NSB).
- Read the plate on a Luminex instrument, which uses a red laser to classify beads and a green laser to quantify median fluorescence intensity (MFI) from the secondary antibody [30].
- Data Processing:
- Perform quality control, excluding samples with average bead counts <30 per peptide.
- Normalize MFI data using log₂ transformation and subtract the average NSB signal to generate specific binding scores.
- Use statistical modeling (e.g., linear mixed-effects models) to identify and eliminate technical artifacts such as plate effects [30].
BBEA demonstrates high reliability, reproducibility, and greater sensitivity for epitope detection compared to peptide microarrays. It allows researchers to correlate the pattern and diversity of epitope-specific IgE with clinical outcomes such as allergy severity and persistence [30].
The Scientist's Toolkit: Key Research Reagent Solutions
Successful implementation of multiplexed immunoassays relies on a suite of specialized reagents and tools. The following table outlines essential solutions for researchers in this field.
Table 2: Essential Research Reagents for Multiplexed Allergy Biomarker Discovery
| Research Reagent | Function & Application | Example Use-Case |
|---|---|---|
| Stratum Corneum Tape Strips | Non-invasive sampling of skin surface proteins. | Collection of stratum corneum samples from patients with contact dermatitis for cytokine analysis [7]. |
| Luminex Magnetic Microspheres | Color-coded beads serving as solid phase for multiplexed assays. | Coupling with allergenic peptides for Bead-Based Epitope Assays (BBEA) to detect epitope-specific antibodies [30]. |
| Photocleavable Capture Antibodies | Affinity purification and concentration of biomarkers from complex samples. | Implementation of PC-PURE method to eliminate matrix effects in multiplex microsphere-based allergy tests (AllerBead) [31]. |
| SULFO-TAG Conjugated Detection Antibodies | Enable electrochemiluminescent detection in MSD assays. | Detection of antigen-specific IgG in a validated multiplex MSD assay for malaria vaccine immunogenicity [44]. |
| Multiplex Assay Quality Controls (QC) | Monitor assay performance, precision, and reproducibility across runs. | Inclusion of High, Medium, and Low QC samples in MSD assay validation to ensure inter-assay precision [44]. |
Figure 2: The impact of matrix effects on multiplex immunoassays and a technological solution. Complex samples contain interfering substances that can bind non-specifically to assay surfaces, compromising data quality. The PC-PURE method uses photocleavable antibodies to purify and concentrate target biomarkers prior to analysis, thereby mitigating these effects and ensuring robust results [31].
Multiplexed immunoassays provide a powerful toolkit for deconvoluting complex immune responses in allergic diseases. The protocols and platforms detailed herein—from high-sensitivity protein quantification in skin tape strips to high-resolution epitope mapping in food allergy—enable researchers to generate comprehensive, high-quality biomarker data. Adherence to standardized protocols and careful selection of reagent solutions, as outlined in this application note, is fundamental for achieving reliable and translatable findings. As these technologies continue to evolve and integrate with other omics approaches, they will undoubtedly accelerate the development of predictive diagnostics and targeted therapeutics in the field of allergy and immunology.
The precise risk stratification of patients with immunoglobulin E (IgE)-mediated food allergies is a critical objective in modern allergology. A key research focus involves correlating sensitization to specific allergenic proteins with clinical outcomes to predict reaction severity. This application note delineates the role of component-resolved diagnostics (CRD) and multiplexed immunoassays in quantifying specific allergens—Ara h 2 (peanut), nBos d 5 (milk, also known as Bos d 8), and Gal d 1 (egg)—for advanced risk assessment. We present quantitative data, detailed experimental protocols, and visual workflows to support researchers and drug development professionals in implementing these tools for refined patient stratification and therapeutic monitoring.
Core Allergen Components and Clinical Risk Profiles
Sensitization to specific stable allergen components is a significant predictor for the persistence and severity of food allergies. The following table summarizes the key characteristics and clinical relevance of the major allergens discussed [45].
Table 1: Molecular and Clinical Profiles of Major Food Allergens
| Allergen (Source) | Protein Family / Function | Clinical Significance & Risk Correlation | Prevalence of Sensitization |
|---|---|---|---|
| Ara h 2 (Peanut) | 2S albumin; Seed storage protein & trypsin inhibitor [45] | Major allergen; marker for severe systemic reactions and anaphylaxis; one of the most potent peanut allergens [45]. | ~62-85% in peanut-allergic populations; up to 97% when co-sensitized with Ara h 1 & 3 [45]. |
| nBos d 5 (Cow's Milk) | Lipocalin (Whey protein Beta-lactoglobulin) [5] | A major milk allergen. Stability can contribute to severe reactions, though clinical thresholds for milk are often lower than for other foods [46]. | Highly prevalent in milk-allergic individuals. |
| Gal d 1 (Egg White) | Ovomucoid (Glycoprotein) [5] | A major and stable egg allergen resistant to digestion and heat. Correlates with persistent egg allergy and a marker for reaction upon ingestion of both raw and cooked egg [47]. | Highly prevalent in egg-allergic individuals, especially those reactive to heated egg. |
Quantitative data from controlled challenge studies provide critical thresholds for risk assessment. The following table compiles population threshold data for these foods, which is vital for characterizing the sensitivity of allergic cohorts [46].
Table 2: Population Threshold Doses from Challenge Studies
| Food Allergen | ED10 (Eliciting Dose for 10% of Population) | Key Clinical Findings |
|---|---|---|
| Peanut (Roasted) | 106.5 mg (95% CI: 59.7–190.6 mg) [46] | Peanuts elicit more severe reactions than egg, milk, or hazelnut. Reaction severity is associated with increasing age, not a low threshold dose [46]. |
| Cow's Milk | 2.9 mL (95% CI: 1.5–5.4 mL) [46] | Patients exhibit lower threshold doses (in mg of food) compared to egg and peanut. Even when adjusted for protein content, thresholds are not directly comparable across foods [46]. |
| Hen's Egg | 42.9 mg (95% CI: 24-76.8 mg) of whole egg [46] | The distribution of patient thresholds is often bimodal, with individuals clustering at either very high or very low sensitivity levels [46]. |
Multiplexed Immunoassay for Allergen Quantification
Experimental Protocol: Simultaneous Quantification of Specific Allergens
Principle: A fluorescent bead-based multiplex immunoassay enables the simultaneous, accurate, and sensitive quantification of specific allergenic proteins in complex matrices, such as food extracts or immunotherapy preparations [48].
Workflow Overview:
Materials & Reagents:
- Monoclonal Antibodies: Specific for target allergens (e.g., Ara h 1, Ara h 2, Ara h 6, Bos d 5, Gal d 1) [48].
- Fluorescently Coded Microspheres: As the solid phase for antibody coupling.
- Biotinylated Detection Antibodies: A pool of antibodies specific for the different target allergens.
- Streptavidin-Conjugated Fluorochrome: e.g., Streptavidin-PE.
- Purified Natural Allergen Standards: For calibration curve generation.
- Wash Buffers and Blocking Agents.
Detailed Procedure:
- Bead Coupling: Covalently couple allergen-specific monoclonal antibodies to distinct sets of fluorescent beads, following standard carbodiimide chemistry protocols [48].
- Assay Setup:
- Combine the coupled beads to create a multiplexed bead array.
- Incubate the bead array with standard solutions or test samples (e.g., dissolved food, diagnostic extracts, oral immunotherapy preparations).
- Wash to remove unbound proteins.
- Detection:
- Incubate with a pool of biotinylated allergen-specific antibodies.
- Wash to remove unbound detection antibodies.
- Incubate with streptavidin-conjugated fluorochrome.
- Perform a final wash to remove unbound conjugate [48].
- Analysis:
- Measure fluorescence using a dual-laser microarray scanner. One laser identifies the bead set (allergen identity), and the second quantifies the bound analyte (allergen quantity) [48].
- Quantify allergens by interpolating signals against a standard curve of purified allergens. Correlate results with established singleplex ELISA for validation (R² = 0.82 to 0.98) [48].
Key Advantages and Research Applications
- High Sensitivity: Demonstrates up to a 40-fold increase in sensitivity compared to traditional ELISA, with accurate detection as low as 20 pg/ml [48].
- Reveals Allergen Profile Variability: The assay can identify significant differences in the relative ratios of specific allergens (e.g., Ara h 1:Ara h 2:Ara h 6) between commercial products, diagnostic extracts, and oral immunotherapy (OIT) formulations [48].
- Application in OIT Research: This technology enables precise assessment of the potency and consistency of food extracts used in clinical trials for OIT, helping to standardize dosing and potentially reduce risks associated with variable allergen content [48].
The Scientist's Toolkit: Essential Research Reagents
The following table catalogs key reagents essential for research in molecular allergology and the development of multiplexed assays.
Table 3: Key Research Reagent Solutions
| Research Reagent | Function / Description | Example Application |
|---|---|---|
| Recombinant Allergens | Defined, pure single allergens produced recombinantly. | Used as standards in immunoassays, for coupling in microarray chips (e.g., ISAC), and for probing specific immune responses in vitro [5]. |
| Allergen-Specific Monoclonal Antibodies | Antibodies with high specificity for a single allergenic protein or epitope. | Core reagents for developing specific capture/detection in immunoassays like the multiplex array or ELISA [48]. |
| Fluorescently Coded Microspheres | Polymer beads with unique fluorescent signatures. | Serve as the solid phase for multiplexed immunoassays; different bead sets are coupled to different antibodies to allow simultaneous detection [48]. |
| ImmunoCAP ISAC 112 Chip | A commercial microarray for component-resolved diagnostics. | Simultaneously measures sIgE to 112 allergen components from a small serum sample, generating extensive sensitization profiles for clinical research [5]. |
| Biotinylated Antibodies & Streptavidin-Conjugates | Amplification system for detection. | Biotinylated secondary antibodies provide a binding site for streptavidin-enzyme/fluorochrome conjugates, enhancing assay signal and sensitivity [48] [49]. |
Integrated Risk Stratification Workflow
Combining patient history, component-resolved diagnostics, and cellular assays provides a powerful framework for risk stratification, as illustrated below.
Supporting Evidence for the Workflow:
- sIgE to Ara h 2: High specific IgE levels to Ara h 2 or polysensitization to Ara h 1, 2, and 3 are strongly associated with an increased risk of severe, systemic reactions and anaphylaxis upon peanut exposure [45].
- Cellular Markers: In infants with milk or egg allergy, increased allergen-induced IL-4 expression in peripheral blood mononuclear cells (PBMCs) was identified as a significant marker of clinical allergy, even in the absence of increased GATA-3 mRNA, suggesting a non-T-cell origin for this cytokine in early life food allergy [50].
- Clinical History: A history of uncontrolled asthma is a major risk factor for severe reactions, not only in food allergy but also in the context of allergen immunotherapy, highlighting the importance of this clinical parameter in overall risk assessment [51] [52].
The integration of multiplexed immunoassays and component-resolved diagnostics represents a paradigm shift in food allergy research and clinical management. The precise quantification of key allergens like Ara h 2, nBos d 5, and Gal d 1 provides actionable data for stratifying patients according to their individual risk of severe reactions. The protocols and data outlined herein offer researchers a robust framework for standardizing allergen measurements, refining patient cohorts for clinical trials, and ultimately contributing to the development of safer and more effective therapeutic interventions.
Applications in Food Processing and Allergenicity Assessment
Within food safety and clinical research, the accurate assessment of allergenic proteins in processed foods is paramount for protecting sensitized individuals. The complexities of food matrices and the protein modifications induced by processing have historically challenged conventional, single-analyte immunoassays. This application note details how multiplexed immunoassays enable the simultaneous quantification of specific allergenic proteins, providing researchers and drug development professionals with a powerful tool for comprehensive allergenicity assessment. These methodologies are crucial for evaluating the effects of food processing on allergen content, developing hypoallergenic foods, and ensuring regulatory compliance [14] [11].
The transition from total protein measurement to specific allergen quantification represents a significant advancement. Allergen-specific immunoassays target clinically relevant proteins known to cause allergic responses, offering improved specificity, standardisation, and reporting clarity compared to traditional kits that use polyclonal antibodies against complex commodity extracts [14]. Furthermore, the move toward multiplexing allows for the concurrent analysis of multiple allergens from a single sample aliquot, increasing throughput and conserving valuable sample material [11] [7].
Multiplexed Immunoassay Platforms: Principles and Advantages
Multiplex immunoassays function on the core principle of simultaneously detecting multiple protein targets in a single analysis. Unlike single-plex ELISAs, which are limited to one analyte per test, multiplex platforms use a combination of capture and detection antibodies specific to different allergenic proteins, allowing for the creation of a detailed allergen profile from a minimal sample volume [11] [7].
Key Technological Advantages
- Comprehensive Profiling: The ability to identify numerous IgE-binding proteins, including some that may be previously unknown, with a single test provides an unparalleled view of a food's allergenicity [11].
- High Throughput: By analysing multiple targets simultaneously, multiplex assays significantly reduce hands-on time, increase sample throughput, and decrease the per-analyte cost compared to running multiple single-plex ELISAs [14].
- Sample Volume Conservation: Techniques like the NULISA and Olink platforms require small sample volumes (as low as 10 µL), which is critical when sample material is limited [7].
- Standardised Quantification: The use of purified, clinically relevant allergen calibrants in systems like MARIA for Foods improves the accuracy and harmonisation of results across different laboratories and studies [14].
Comparison of Detection Platforms
Various platforms are available, each with distinct strengths. Table 1 compares three prominent multiplex immunoassay technologies based on a recent study evaluating their performance with challenging samples.
Table 1: Comparison of Multiplex Immunoassay Platforms for Protein Biomarker Analysis
| Feature | Meso Scale Discovery (MSD) | NULISA | Olink |
|---|---|---|---|
| Detection Mechanism | Electrochemiluminescence | Nucleic Acid Linked Immuno-Sandwich Assay | Proximity Extension Assay |
| Sensitivity (in SC samples) | Highest (70% detectability) | Moderate (30% detectability) | Lower (16.7% detectability) |
| Sample Volume Required | Moderate | Low | Low |
| Data Output | Absolute protein concentrations | Relative quantification | Relative quantification |
| Key Advantage | Provides absolute quantification, enabling normalization for variable sample content | Attomolar sensitivity; large pre-configured panel | Targeted panels with relevance to specific pathways (e.g., inflammation) |
Adapted from a comparative study of multiplex immunoassays for biomarker analysis in stratum corneum tape strips, which highlighted MSD's superior detectability in a complex matrix [7].
Experimental Protocols for Allergen Assessment
A critical challenge in food allergen analysis is the efficient extraction of proteins from complex, processed matrices. The following optimized protocol is designed to maximize the recovery of specific allergens for subsequent multiplex immunoassay quantification.
Optimized Extraction of Allergens from Processed Food Matrices
Objective: To efficiently extract a wide range of specific allergens from challenging food matrices (e.g., chocolate dessert, baked biscuits) for multiplex immunoassay analysis [14].
Materials:
- Food Samples: Incurred chocolate dessert, raw biscuit dough, and baked biscuit matrices.
- Extraction Buffers: The two most effective buffers identified were:
- Buffer D: 0.05 M sodium carbonate/sodium bicarbonate, 10% fish gelatine, pH 9.6.
- Buffer J: PBS, 2% Tween-20, 1 M NaCl, 10% fish gelatine, 1% PVP, pH 7.4.
- Equipment: Vortex mixer, orbital incubator (e.g., Stuart SI500), centrifuge capable of cooling to 4°C.
Procedure:
- Sample Preparation: Homogenize the food sample into a fine powder or paste.
- Weighing: Accurately weigh 1 g of the prepared sample into a suitable extraction tube.
- Buffer Addition: Add 10 mL of pre-warmed extraction buffer (Buffer D or J) to achieve a 1:10 sample-to-buffer ratio.
- Extraction: Vortex mix the sample for 30 seconds to ensure thorough suspension.
- Incubation: Incubate the mixture for 15 minutes in an orbital incubator set to 60°C and 175 rpm.
- Clarification: Centrifuge the extracts at 1250 rcf for 20 minutes at 4°C.
- Collection: Carefully collect the clarified supernatant from the middle of the tube, avoiding the pellet and any separated insoluble material.
- Analysis: Proceed with multiplex immunoassay analysis (e.g., MARIA, MSD) of the extracted supernatants.
Notes: Buffers containing additives like fish gelatine and PVP were critical for disrupting matrix interactions and solubilising allergens, particularly in polyphenol-rich matrices like chocolate. Thermal processing (baking) was observed to lower allergen recoveries, necessitating optimized extraction [14].
Multiplex Immunoassay Workflow (MARIA for Foods)
Objective: To simultaneously quantify multiple specific allergens in food extracts using a multiplex array.
Materials:
- Multiplex Allergen Array: Bead-based array with allergens covalently coupled to distinct regions.
- Food Extracts: Prepared per the protocol in Section 3.1.
- Allergen-Specific Antibodies: Monoclonal or polyclonal antibodies against target allergens.
- Detection Reagents: Fluorescently labelled secondary antibodies and associated wash buffers.
- Reader: Luminex or similar array reader.
Procedure:
- Incubation: Incubate the food extract with the allergen-coupled bead mixture.
- Binding: Allow specific allergens in the extract to bind to their corresponding immobilized antibodies on the beads.
- Detection: Add a cocktail of biotinylated allergen-specific detection antibodies, followed by a streptavidin-phosphor conjugate.
- Reading: Measure the signal intensity using a multiplex array reader.
- Quantification: Interpolate allergen concentrations from standard curves generated with purified allergen standards.
The following diagram illustrates the logical workflow from sample preparation to data analysis.
Data Presentation and Analysis
The effectiveness of the optimized extraction protocol is demonstrated by the recovery rates of specific allergens from various processed food matrices. Table 2 summarizes quantitative recovery data for key allergens, highlighting the performance across different matrix types.
Table 2: Recovery of Specific Allergens from Processed Food Matrices Using Optimized Extraction Buffers
| Allergen Source | Specific Allergen | Chocolate Dessert | Raw Biscuit | Baked Biscuit |
|---|---|---|---|---|
| Peanut | Ara h 2 | 65-80% | 85-110% | 70-95% |
| Egg | Gal d 1 (Ovotransferrin) | 55-70% | 90-120% | 75-100% |
| Milk | Bos d 9 (Casein) | 60-75% | 95-130% | 80-105% |
| Hazelnut | Cor a 9 | 50-65% | 80-110% | 65-90% |
| Soy | Gly m 6 | 70-85% | 88-115% | 72-98% |
Data adapted from a study optimizing the simultaneous extraction of 14 food allergens from incurred matrices. Recoveries within 50-150% were generally considered acceptable, with chocolate and thermally processed matrices showing lower yields [14].
The Scientist's Toolkit: Research Reagent Solutions
Successful implementation of multiplexed allergen quantification relies on a set of essential reagents and materials. The following table details key solutions and their functions in the experimental workflow.
Table 3: Essential Research Reagents for Multiplexed Allergen Analysis
| Reagent/Material | Function & Importance | Example Formulation |
|---|---|---|
| Optimized Extraction Buffers | Disrupts protein-matrix interactions, solubilises allergens, and mitigates the effects of interfering compounds (e.g., polyphenols, fats). | PBS, 2% Tween-20, 1 M NaCl, 10% fish gelatine, 1% PVP, pH 7.4 [14] |
| Fish Gelatine | A protein-based blocking additive that reduces non-specific binding and improves allergen recovery by competing for binding sites. | 10% (w/v) in extraction buffer [14] |
| Polyvinylpyrrolidone (PVP) | A non-protein additive that binds and removes polyphenols (common in chocolate), preventing them from interfering with the immunoassay. | 1% (w/v) in extraction buffer [14] |
| Allergen-Specific Antibodies | Monoclonal or polyclonal antibodies that provide the high specificity required to quantify individual clinically relevant allergenic proteins. | Antibodies targeting specific allergens like Ara h 2 (peanut) or Bos d 9 (milk) [14] |
| Purified Allergen Calibrants | Highly purified native or recombinant allergen proteins used to generate standard curves, enabling accurate and standardised quantification. | Purified Cor a 9 (hazelnut) or Gal d 1 (egg) for calibration [14] |
| Multiplex Bead Arrays | The solid phase of the assay, where capture molecules are immobilized on colour-coded beads to enable simultaneous detection of multiple targets. | Bead sets for MARIA or MSD platforms [14] [7] |
Multiplexed immunoassays represent a transformative approach for the specific quantification of allergenic proteins in food processing and allergenicity assessment. The methodologies and data presented herein provide researchers with a robust framework for overcoming the analytical challenges posed by complex and processed food matrices. The combination of optimized, shared extraction buffers and highly specific multiplex detection platforms enables accurate, high-throughput analysis that is critical for advancing food safety, developing novel therapeutic foods, and informing evidence-based regulatory policies. As this technology continues to evolve, its application will be instrumental in deepening our understanding of how processing modulates food allergenicity and in enhancing consumer protection for individuals with food allergies.
Supporting Drug and Vaccine Development through Cytokine Modulation Studies
Cytokines are secreted signaling proteins that act as essential messengers of the immune system, regulating diverse aspects of immunity, inflammation, and cell survival [53] [54]. Their ability to control immune function has generated significant clinical interest for treating cancer, autoimmune diseases, and infectious diseases, though their therapeutic application has been limited by pleiotropy—the ability to act on many cell types and impact diverse biological functions, often resulting in dose-limiting toxicity or lack of efficacy [54]. Recent advances in understanding cytokine receptor pharmacology have unlocked new opportunities for tailoring cytokine function through protein engineering, creating a new field of cytokine pharmacology focused on overcoming these limitations [54].
The integration of multiplexed immunoassays into cytokine studies has revolutionized our ability to decipher complex cytokine networks by enabling the simultaneous quantification of multiple cytokines in small sample volumes [55] [56]. These analytical advances provide researchers with powerful tools to monitor immune responses with unprecedented resolution, accelerating the development of cytokine-based therapies and cytokine-adjuvanted vaccines [57]. This application note details how multiplexed cytokine analysis platforms support critical decision-making in preclinical and clinical development of immunotherapies and vaccines, with particular emphasis on practical methodologies for researchers in pharmaceutical and biotechnology settings.
Cytokine Analysis Technologies and Methodologies
Multiplexed Immunoassay Platforms
Multiplexed immunoassays represent a significant advancement over traditional single-analyte methods, allowing researchers to capture the complexity of cytokine networks while conserving precious samples. The most prominent technologies include bead-based arrays like Luminex xMAP technology, flow cytometry-based multiplex assays, and newer platforms such as Meso Scale Discovery (MSD-ECL) [53] [55] [56]. These systems use color-coded beads or spatial arrays conjugated with capture antibodies for specific cytokines, enabling simultaneous quantification of dozens of analytes in a single sample.
Table 1: Comparison of Major Cytokine Analysis Platforms
| Platform | Multiplexing Capacity | Sensitivity | Sample Volume | Key Advantages | Common Applications |
|---|---|---|---|---|---|
| Luminex xMAP | Up to 100-plex | High (pg/mL) | 25-50 µL | High multiplex capacity, pre-configured panels available | Comprehensive immune monitoring, biomarker discovery |
| Flow Cytometry-Based | 12-50 plex | High (pg/mL) | 50-100 µL | Widely available instruments, rapid one-step protocols available | Clinical research, immune cell profiling |
| MSD-ECL | 10-40 plex | Ultra-high (fg-pg/mL) | 25-50 µL | Broad dynamic range, low background | Pharmacodynamic studies, low-abundance cytokines |
| ELISA | Single-plex | High (pg/mL) | 50-100 µL | Gold standard, high specificity | Targeted analysis, validation studies |
Recent innovations have further simplified these methodologies. A 2025 study demonstrated a one-step flow cytometry-based 12-plex cytokine assay that incorporates lyophilized reagents to eliminate cold storage requirements and reduce operational time [55]. This simplified protocol maintains performance comparable to conventional approaches while enabling more convenient reagent transport, storage, and detection procedures—particularly valuable for clinical settings and multi-site trials [55].
Experimental Protocol: Multiplex Cytokine Analysis via Flow Cytometry
Principle: This protocol describes a simplified one-step flow cytometry-based approach for simultaneous quantification of 12 cytokines in cell culture supernatants or serum samples, adapted from established methodologies [55]. The assay uses capture-antibody-modified fluorescent microspheres and phycoerythrin-labeled detection antibodies in a single reaction mixture.
Reagents and Materials:
- Carboxylated fluorescently encoded microspheres (12 distinct populations)
- Capture antibodies against target cytokines (e.g., IL-2, IL-4, IL-6, IL-10, IL-12, TNF-α, IFN-γ)
- Phycoerythrin (PE) conjugation kit
- Biotinylated secondary antibodies (for conventional method)
- Streptavidin-PE conjugate (for conventional method)
- Assay buffer (0.15 M PBS, pH 7.4, 0.1% BSA)
- Lyophilization buffer (0.15 M PBS, pH 7.4, 0.1% BSA, 5% trehalose, 5% mannitol)
- Washing buffer (0.15 M PBS, 0.05% Tween-20, pH 7.4)
- Reading buffer (0.15 M PBS, pH 7.4)
- Cytokine standards for calibration curve
- 96-well microtiter plates
- Beckman Coulter DxFlex flow cytometer or equivalent
Procedure:
- Sample Preparation: Collect cell culture supernatants by centrifugation at 300×g for 10 minutes. Clarify serum samples by centrifugation at 1000×g for 15 minutes. Store samples at -80°C until analysis.
Reconstitution of Lyophilized Reagents: Add 100 µL of sample or standard to each well of a 96-well plate containing lyophilized reagent beads. For conventional methods, first add 50 µL of capture microspheres to each well.
Immunoassay Incubation: Incubate plates with shaking at room temperature for 1.5 hours (one-step method) or 2 hours (conventional method). The one-step method incorporates both capture and detection in a single mixture.
Washing: For conventional methods only: After incubation, wash plates three times with washing buffer to remove unbound components. For one-step method, proceed directly to step 5.
Signal Detection: Add reading buffer to each well and analyze immediately using a flow cytometer with capability to detect microsphere fluorescence and PE signal.
Data Analysis: Generate standard curves for each cytokine using known concentrations. Calculate cytokine concentrations in unknown samples by extrapolation from standard curves. Normalize data to total protein content or cell counts as appropriate.
Technical Notes:
- Optimal lyophilization conditions include flash-freezing in liquid nitrogen followed by vacuum drying for 12 hours
- Include quality control samples with known cytokine concentrations in each assay run
- For intracellular cytokine staining, additional steps including cell stimulation, permeabilization, and fixation are required before antibody staining
- The one-step method reduces total assay time from approximately 3 hours to 1.5 hours compared to conventional approaches [55]
Applications in Vaccine Development
Cytokine Adjuvants in mRNA Vaccines
Cytokine adjuvants represent a promising strategy to enhance vaccine efficacy, particularly for promoting robust T-cell responses. Recent research has demonstrated the potential of incorporating cytokine-encoding mRNA into vaccine formulations. A 2025 study showed that adding interleukin-12 (IL-12) mRNA to mRNA-based vaccines significantly enhanced CD8+ T cell responses against SARS-CoV-2, influenza, and provided improved protection against melanoma and listeria infection [57].
The practical advantage of cytokine mRNA adjuvants includes the ability to reduce vaccination frequency and dose-related adverse events while maintaining or enhancing immunogenicity [57]. This approach leverages decades of cytokine biology research to rationally design vaccine adjuvants that can be tailored to specific pathogens or disease states. For instance, ongoing research is exploring whether IL-12 could improve vaccine candidates for HIV, while other studies focus on deploying this approach across species for avian influenza [57].
Precision Adjuvant Strategies for Substance Use Disorder Vaccines
Cytokine modulation plays a critical role in the development of vaccines for substance use disorders (SUDs), where the poor immunogenicity of small-molecule haptens requires potent adjuvants to generate effective immune responses [58]. Research in precision adjuvant strategies has identified five major adjuvant classes with distinct cytokine modulation profiles: aluminum-salt adjuvants, emulsion adjuvants, toll-like receptor (TLR) agonists, protein immunopotentiators, and cytokine modulators [58].
These adjuvants work through different mechanisms to shape immune responses. For example, comparative analyses reveal pronounced drug-specific and carrier-specific variability in adjuvant efficacy, with case studies illustrating the superior performance of complementary TLR-agonist pairs in nicotine nanovaccines versus their limited effect in oxycodone vaccines [58]. These findings support a precision vaccinology paradigm that tailors adjuvant strategies to each drug class and delivery vehicle, with cytokine profiling essential for guiding rational adjuvant design [58].
Table 2: Cytokine Modulation Profiles of Major Adjuvant Classes
| Adjuvant Class | Key Cytokines Modulated | Immune Response Polarization | Applications in SUD Vaccines | Considerations |
|---|---|---|---|---|
| Aluminum Salts | IL-1β, IL-18, IL-33 | Th2-skewed | Nicotine, opioids | Established safety profile, limited cell-mediated immunity |
| Emulsion Systems | IL-1β, TNF-α, IL-6 | Balanced Th1/Th2 | Stimulants, opioids | Versatile, compatible with multiple antigens |
| TLR Agonists | Type I IFNs, IL-6, IL-12, TNF-α | Th1-skewed | Nicotine, cocaine | Potent CD8+ T cell activation, potential toxicity |
| Protein Immunopotentiators | IL-1β, IL-17, IL-22 | Mucosal immunity | Opioids with mucosal delivery | Tissue-targeted responses |
| Cytokine Modulators | Direct delivery of IL-12, IL-2, etc. | Tunable based on cytokine | All SUD vaccine types | Precise control, engineering required |
Applications in Therapeutic Development
Engineered Cytokines for Targeted Immunotherapy
Protein engineering approaches have enabled the development of cytokine variants with tailored therapeutic properties. These engineered cytokines overcome the limitations of natural cytokines by modulating receptor binding affinity, altering cellular specificity, and fine-tuning signaling output [54]. For instance, IL-2 variants with reduced affinity for IL-2Rα exhibit selective expansion of effector CD8+ T cells and natural killer cells with reduced activation of regulatory T cells—addressing a major limitation of native IL-2 therapy [54].
Table 3: Engineered Cytokines in Clinical Development
| Engineered Cytokine | Engineering Strategy | Pharmacological Profile | Therapeutic Application | Key Biological Effects |
|---|---|---|---|---|
| IL-2 (NARA1leukin) | Antibody fusion reducing affinity for IL-2Rα | Full agonist | Cancer | Selective expansion of effector CD8+ T cells and NK cells |
| IL-2 (N88D, FcMut24) | Reduced affinity for IL-2Rβ | Partial agonist | Autoimmunity | Selectively activates Treg cells but not effector T cells |
| IL-10 (10-DE) | Reduced affinity for IL-10Rβ | Partial agonist | Autoimmunity, chronic inflammation | Retains anti-inflammatory effects on myeloid cells with reduced IFNγ induction |
| IL-22 (22-B3) | Reduced affinity for IL-10Rβ | Biased agonist | Autoimmunity, GVHD | Retains STAT3-mediated tissue protection without STAT1-mediated inflammation |
| IL-12 (3xAla) | Reduced affinity for IL-12Rβ1 | Partial agonist | Cancer | Selectively stimulates IFNγ induction by T cells over NK cells |
The development of these optimized cytokines relies heavily on multiplexed cytokine analysis to characterize their immunomodulatory profiles and validate their mechanism of action. For example, cytokine profiling can confirm that engineered IL-10 variants maintain anti-inflammatory properties on myeloid cells while minimizing pro-inflammatory effects on T cells [54].
Neuroimmune Modulation in Neuropsychiatric Disorders
Cytokine networks are increasingly recognized as important contributors to neuropsychiatric disorders, with Major Depressive Disorder (MDD) now understood as a neuroinflammatory condition characterized by dysregulated cytokine networks [59]. Clinical studies demonstrate that diverse antidepressant classes consistently reduce pro-inflammatory markers (IFN-γ, TNF-α, IL-6) while enhancing anti-inflammatory cytokines (IL-10, TGF-β) [59]. These immunomodulatory effects are particularly relevant for treatment-resistant cases with elevated baseline inflammation.
Emerging interventions directly target these neuroimmune pathways, including low-dose IL-2 immunotherapy, vagus nerve stimulation, and microbiota-targeted therapies [59]. These approaches appear most effective when guided by inflammatory biomarkers, suggesting a path toward personalized treatment strategies for depression. Multiplexed cytokine analysis enables the identification of patient subgroups most likely to benefit from these interventions based on their inflammatory profiles [59].
The Scientist's Toolkit: Essential Research Reagents
Table 4: Key Research Reagent Solutions for Cytokine Studies
| Reagent Category | Specific Examples | Function | Application Notes |
|---|---|---|---|
| Capture Antibodies | Anti-IL-6, Anti-TNF-α, Anti-IFN-γ | Antigen recognition in immunoassays | Critical for assay specificity; recommend clone validation for each species |
| Bead Arrays | Luminex xMAP beads, flow cytometry beads | Solid support for multiplex assays | Pre-conjugated panels available for specific research areas |
| Cytokine Standards | Recombinant human/mouse cytokine panels | Calibration and quantification | Essential for generating standard curves; species-matched |
| Detection Antibodies | Biotinylated, PE-conjugated antibodies | Signal generation in immunoassays | Secondary antibodies or direct conjugates for detection |
| Assay Buffers | PBS with carrier proteins, preservatives | Maintain assay integrity and stability | Lyophilization stabilizers (trehalose, mannitol) enhance shelf life |
| Cell Culture Supplements | Recombinant IL-2, IFN-γ, TGF-β | Immune cell stimulation and differentiation | Concentration and timing critical for specific cell responses |
| Signal Amplification Reagents | Streptavidin-PE, enzyme substrates | Enhance detection sensitivity | Critical for low-abundance cytokines |
Cytokine Signaling Pathways
Cytokine Signaling Pathway illustrates the canonical cytokine signaling cascade. Cytokines initiate signaling by engaging their cognate receptors, typically comprising a high-affinity cytokine-specific subunit and a shared receptor subunit [54]. This engagement induces receptor dimerization, bringing together associated Janus kinases (JAKs) which trans-phosphorylate each other and the receptor intracellular domains [54]. The phosphorylated receptors then recruit signal transducer and activator of transcription (STAT) proteins, which are subsequently phosphorylated by JAKs, leading to STAT dimerization, nuclear translocation, and regulation of target gene transcription [54].
Multiplex Cytokine Analysis Workflow
Multiplex Cytokine Analysis Workflow outlines the standardized procedure for simultaneous quantification of multiple cytokines. The process begins with proper sample collection and preparation to maintain cytokine stability [55] [56]. Samples are then applied to 96-well plates containing capture antibody-conjugated beads, followed by incubation with detection antibodies [55]. After washing to remove unbound components, the signal is detected using flow cytometry or similar platforms [55]. Data analysis involves generating standard curves for each cytokine and normalizing results to account for technical variations [56]. This workflow enables comprehensive immune monitoring with minimal sample consumption.
Cytokine modulation studies supported by multiplexed immunoassay platforms provide critical insights for advancing drug and vaccine development. The integration of robust cytokine analysis methodologies enables researchers to decipher complex immune responses, optimize therapeutic candidates, and identify biomarkers for patient stratification. As cytokine engineering approaches become increasingly sophisticated and multiplexed analysis technologies continue to evolve, these tools will play an indispensable role in realizing the full potential of immunotherapies across diverse disease areas including infectious diseases, cancer, substance use disorders, and neuropsychiatric conditions. The protocols and methodologies detailed in this application note provide a foundation for implementing these approaches in both basic research and translational development settings.
Troubleshooting and Optimization Strategies for Robust Multiplex Assays
Multiplexed immunoassays represent a powerful tool for the simultaneous quantification of specific allergenic proteins, enabling comprehensive sensitization profiles in a single analysis. However, the accuracy of these advanced diagnostics is perpetually challenged by nonspecific interference, which can generate misleading results and compromise research integrity. Among the most prevalent and impactful interferents are human anti-mouse antibodies (HAMA) and rheumatoid factor (RF), alongside general antibody cross-reactivity. HAMA refers to human antibodies that react against mouse immunoglobulins, a common component in immunoassays that utilize murine monoclonal antibodies. RF, an autoantibody often associated with rheumatoid arthritis, is an IgM antibody that binds to the Fc region of human IgG. The structural homology between the Fc domains of human IgG and those of several animal species explains why RF can also bind non-specifically to animal-derived antibodies used in immunoassays [60]. In the context of sandwich immunoassays, which form the basis of many multiplex platforms, both HAMA and RF can act as heterophilic antibodies, creating false bridges between capture and detection antibodies even in the absence of the target analyte. This interference leads to false-positive signals, artificially elevating reported analyte concentrations and potentially resulting in erroneous data interpretation [61] [62] [60]. Furthermore, the post-COVID-19 immunological landscape has seen an increase in autoantibodies, including RF, even in individuals with no prior autoimmune disease, underscoring the growing relevance of robust interference mitigation strategies in contemporary research [60].
Mechanisms of Interference
HAMA Interference
HAMA interference arises when subjects have developed antibodies against murine immunoglobulins, typically through prior exposure to mouse-derived therapeutic monoclonal antibodies or diagnostic reagents. In a sandwich immunoassay, the ideal scenario involves the target analyte forming an exclusive bridge between the solid-phase capture antibody and the labeled detection antibody. HAMA disrupts this specificity by directly cross-linking the capture and detection antibodies via its paratopes that recognize epitopes on the mouse antibodies. Since most capture and detection antibodies in commercial immunoassays are murine monoclonals, HAMA can effectively create a complete assay complex without the target analyte present. The resulting signal is indistinguishable from that generated by a true positive sample, leading to a false elevation in the measured concentration of the analyte. The risk of HAMA interference is particularly acute in populations treated with mouse monoclonal antibodies, but it can also occur in individuals without known exposure [61] [63].
Rheumatoid Factor Interference
Rheumatoid Factor (RF) primarily interferes through its ability to bind to the Fc regions of immunoglobulins. In a sandwich immunoassay, RF, which is typically an IgM autoantibody, can use its multiple antigen-binding sites to simultaneously bind the Fc portion of the capture antibody and the Fc portion of the detection antibody. This Fc-mediated bridging creates an artifactual signal chain that mimics the presence of the target antigen. The pentameric structure of IgM RF grants it high avidity, enhancing its interference potential. RF is found in approximately 5–10% of the general population and in about 70-80% of patients with rheumatoid arthritis, making it a common source of concern [60]. A 2021 study demonstrated that RF levels increased after SARS-CoV-2 infection, even in individuals with no prior autoimmune disease, broadening the population in which this interference must be considered [60]. The homology between human and animal IgG Fc regions allows RF to cross-react with assay antibodies derived from multiple species [60].
Cross-Reactivity
Cross-reactivity represents another form of analytical interference, distinct from the heterophilic antibody mechanisms of HAMA and RF. It occurs when an antibody pair in an immunoassay interacts with a molecule other than the targeted analyte, often because proteins in the sample are structurally similar to the analyte of interest [62]. This is a particular challenge in multiplexed allergenic protein profiling, where homologous proteins from different allergen sources may share epitopes. For instance, within a peanut allergen panel, cross-reactivity can occur between similar proteins like Ara h 2 and Ara h 6, or between a genuine peanut allergen and a cross-reactive carbohydrate determinant (CCD) from an unrelated pollen source [64]. Unlike heterophilic interference, which is largely nonspecific, cross-reactivity is an issue of limited antibody specificity and can lead to both false positives and an inaccurate representation of a patient's true IgE sensitization profile.
The following diagram illustrates the mechanisms of HAMA and RF interference in a standard sandwich immunoassay, contrasting them with an optimally functioning assay.
Detection and Evaluation Protocols
Accurately identifying and quantifying interference is a critical step in validating multiplex immunoassay data. The following protocols provide detailed methodologies for detecting HAMA, RF, and nonspecific cross-reactivity.
Protocol for Detecting HAMA Interference
Principle: This protocol uses a specialized ELISA to detect the presence of human anti-mouse antibodies in patient serum that could interfere with murine antibody-based immunoassays.
Materials:
- HAMA ELISA Kit: (e.g., from Alpha Diagnostic International) [61]
- Microplate Reader: Capable of measuring absorbance at 450 nm.
- Test Serum Samples: And appropriate positive/negative controls.
Procedure:
- Plate Coating: The provided microplate is pre-coated with mouse IgG.
- Sample Incubation: Dilute test serum samples 1:100 in the provided dilution buffer. Add 100 µL of diluted sample, standards, and controls to respective wells. Incubate for 60 minutes at room temperature.
- Washing: Wash the plate 3 times with the provided wash buffer to remove unbound proteins.
- Detection Antibody Incubation: Add 100 µL of horseradish peroxidase (HRP)-conjugated anti-human IgG antibody to each well. Incubate for 60 minutes at room temperature.
- Washing: Repeat the washing step 3 times.
- Substrate Addition: Add 100 µL of TMB (3,3',5,5'-Tetramethylbenzidine) substrate to each well. Incubate for 15-20 minutes in the dark.
- Reaction Stop: Add 100 µL of stop solution (e.g., 1M sulfuric acid).
- Absorbance Measurement: Read the absorbance at 450 nm within 30 minutes.
Interpretation:
- Calculate the mean absorbance of the negative controls. According to kit manufacturers, a mean absorbance of 0.088 at 450 nm is typically negative, while samples from patients treated with mouse monoclonal antibodies often have an absorbance around 0.559 [61].
- Samples with absorbance values significantly above the negative control threshold indicate the presence of HAMA, posing a risk for assay interference.
Protocol for Evaluating RF and Heterophilic Antibody Interference Using Blocking Tubes
Principle: Heterophilic antibody blocking tubes (HBT) contain blocking reagents that inactivate HAMA and RF. A significant change in analyte measurement after HBT treatment indicates likely interference.
Materials:
- Heterophilic Blocking Tubes (HBT): (e.g., Scantibodies Laboratories Inc.) [61]
- Platform-Specific Immunoassay Reagents: (e.g., Phadia ImmunoCAP 250 for tryptase or other biomarkers).
- Rheumatoid Factor Assay: (e.g., nephelometry on a BNII analyzer).
Procedure:
- Sample Aliquotting: Split each patient serum sample into two equal aliquots (e.g., 500 µL each).
- HBT Treatment: Add one aliquot to an HBT tube. Mix gently by inversion and incubate for 1 hour at room temperature.
- Parallel Testing: The second aliquot remains untreated as a control.
- Analyte Measurement: Assay both the HBT-treated and untreated aliquots for the target analyte (e.g., mast cell tryptase) and for RF in a single run to minimize inter-assay variation.
- HAMA Validation (Optional): Measure HAMA in pre- and post-blocked sera to validate the blocking performance of the HBT tubes.
Interpretation:
- A reduction in the measured analyte concentration of >17% after HBT treatment is considered a significant indicator of heterophilic antibody interference [61]. In one study, 17% of RF-positive samples showed such a decrease, with 57% of those reverting from elevated to normal range values post-blocking [61].
- A significant decrease in RF levels post-HBT (up to 75% has been observed) further confirms RF-mediated interference [61].
Protocol for Assessing Cross-Reactivity in Multiplex Panels
Principle: This protocol evaluates the specificity of antibody pairs used in a multiplex panel by testing against a panel of structurally similar analytes to identify potential cross-reactions.
Materials:
- Multiplex Assay Platform: (e.g., Luminex xMAP or microarray-based system).
- Purified Recombinant Allergens/Proteins: Including the target analyte and homologous proteins from related sources.
- Assay Buffer.
Procedure:
- Panel Preparation: Create a sample panel containing high-purity preparations of the target analyte and potential cross-reactants (e.g., homologous proteins from different species, or isoforms).
- Spiking Experiment: Spike each purified protein individually into a naive matrix (e.g., assay buffer or pooled human serum from non-allergic donors) at a known, physiologically relevant concentration.
- Multiplex Assay Run: Process each spiked sample through the standard multiplex assay procedure.
- Data Analysis: Analyze the signal generated on all assay spots (for all analytes) from each spiked sample.
Interpretation:
- Specific Assay: A specific antibody pair will generate a strong signal only on its corresponding spot when its target analyte is present.
- Cross-Reactivity: A signal generated on a non-corresponding spot indicates that the antibody pair for that spot is cross-reacting with the spiked protein. The percentage cross-reactivity can be calculated as: (Signal on non-target spot / Signal on target spot when target is spiked) * 100%.
- This is crucial for validating allergen components, such as ensuring that an Ara h 2-specific assay does not cross-react with Ara h 6 [64].
Table 1: Expected Outcomes for Interference Detection Tests
| Interference Type | Detection Method | Positive Result Indicator | Clinical/Research Implication |
|---|---|---|---|
| HAMA | HAMA ELISA | High Absorbance (>0.559 A₄₅₀) [61] | High risk of false positives in murine IgG-based assays |
| RF | Nephelometry/Turbidimetry | RF > 14 IU/ml [61] | Risk of Fc-mediated false positives |
| Heterophilic Antibodies (General) | HBT Blocking Assay | >17% reduction in analyte post-HBT [61] | Confirmation of heterophilic antibody interference |
| Cross-Reactivity | Specificity/Spiking Experiment | Signal generation for non-target homologous analytes | Misclassification of sensitization profile |
Mitigation Strategies and Reagent Solutions
Once interference is identified, several strategies can be employed to mitigate its effects, ensuring the reliability of multiplex immunoassay data. The most effective approaches often involve a combination of reagent engineering, buffer formulation, and sample pre-treatment.
Reagent Engineering and Selection
- Use of Recombinant Antibody Fragments: Replacing conventional full-length antibodies with recombinant Fab or scFv fragments eliminates the Fc region, which is the primary binding target for RF. This engineering strategy directly removes the mechanism for Fc-mediated interference [60].
- Antibody Isotype and Species Selection: When full-length antibodies are necessary, selecting antibodies from species with lower Fc homology to human IgG can reduce RF binding. Additionally, using chicken IgY antibodies, which do not bind to RF or human anti-animal antibodies, can be an effective alternative [63].
Buffer Composition and Blocking Agents
The formulation of assay diluents is critical for minimizing interference in multiplex settings. Specially designed buffers can contain a cocktail of blocking agents to address multiple interference pathways simultaneously [62].
- Animal Sera/IgG: Traditional blockers like mouse IgG are used to compete for HAMA binding sites. However, they block passively and require high concentrations, and they are ineffective against RF [63].
- Specialized Active Blockers: Advanced commercial blockers, such as TRU Block (Meridian Bioscience), employ active blocking technology. These formulations are designed to provide broader coverage against HAMA, RF, and other heterophilic antibodies (e.g., HAGA, HASA) with higher efficiency and at lower concentrations than animal sera [60] [63]. Studies show TRU Block outperforms traditional mouse IgG in both ELISA and lateral flow formats [63].
- Proprietary Blocker Blends: Many validated multiplex assay kits incorporate proprietary blocker blends in their diluents. For instance, the multi-biomarker disease activity (MBDA) score for rheumatoid arthritis, which measures 12 serum biomarkers in a multiplex format, uses a diluent that has been demonstrated to minimize interference from RF, HAMA, and common RA therapies [65].
Sample Pre-Treatment Protocols
- HBT Tube Treatment: As described in Section 3.2, pre-incubating samples with heterophilic blocking tubes is a direct and effective method to neutralize interfering antibodies prior to running the assay [61].
- Immunoabsorption: For persistent interference, methods such as using protein A or protein G can be used to absorb out interfering immunoglobulins from the sample, though this may also remove the analyte of interest if it is an immunoglobulin like IgE.
Table 2: Research Reagent Solutions for Mitigating Interference
| Reagent / Material | Function / Purpose | Key Features & Considerations |
|---|---|---|
| Heterophilic Blocking Tubes (HBT) | Sample pre-treatment to inactivate HAMA/RF | Contains specific binders; incubate serum for 1 hour [61] |
| TRU Block | Active blocker added to assay buffer | Broad coverage vs. HAMA/RF/HAGA; for ELISA/lateral flow [60] [63] |
| Mouse IgG | Passive HAMA blocker in assay buffer | Ineffective against RF; requires high concentration [63] |
| Recombinant Fab Fragments | Engineered capture/detection antibodies | Fc-free, eliminating primary mechanism for RF interference [60] |
| IgY Antibodies (Chicken) | Alternative capture/detection antibodies | Does not bind mammalian RF or HAMA [63] |
| Assay Diluent with Proprietary Blockers | Ready-to-use optimized buffer | Pre-formulated for specific multiplex kits (e.g., MBDA score) [65] |
The following workflow diagram summarizes the strategic approach to identifying and mitigating interference, from initial suspicion to final validated result.
The integrity of research utilizing multiplexed immunoassays for allergenic protein quantification is fundamentally dependent on the successful identification and mitigation of analytical interference. HAMA, rheumatoid factor, and antibody cross-reactivity represent significant sources of error that can generate false-positive signals and lead to incorrect scientific conclusions. A systematic approach—combining rigorous detection protocols, such as HAMA ELISAs and HBT blocking assays, with robust mitigation strategies, including the use of engineered recombinant antibodies and advanced blocking reagents—is essential for ensuring data accuracy. As the field of precision medicine advances and multiplexed profiling becomes more complex, integrating these interference checks and balances into standard research protocols will be paramount for generating reliable, reproducible, and clinically meaningful results.
Strategies to Overcome Non-Specific Binding and Matrix Effects
The simultaneous quantification of specific allergenic proteins is essential for food safety, diagnostic, and therapeutic development [6]. Researchers employing multiplexed immunoassays face a significant analytical hurdle: the dual interference from non-specific binding (NSB) and matrix effects. These phenomena can obscure true analyte signals, introduce substantial bias, and compromise data reproducibility, potentially leading to false negatives or inaccurate quantitation [66] [67]. NSB occurs when proteins or other sample components adhere to assay surfaces or antibodies through non-covalent interactions, while matrix effects arise when complex sample components interfere with antibody-antigen binding kinetics [67]. These challenges are particularly pronounced in processed food analysis, where chocolate, thermal processing, and varying fat and polyphenol content can severely suppress allergen recovery [14]. This Application Note details validated strategies and protocols to identify, mitigate, and overcome these interferences, ensuring reliable protein quantification in complex research matrices.
Understanding the Mechanisms of Interference
Fundamental Causes of Non-Specific Binding
Non-specific binding stems from three primary factors, often acting in concert [66]:
- Properties of the Solid Surface: Contact surfaces in consumables (e.g., polypropylene, polystyrene, glass) and instrumentation (e.g., liquid chromatography phase lines) can interact with analytes via electrostatic or hydrophobic effects. The principles vary by material, with glass being prone to ion-exchange and plastics to hydrophobic interactions [66].
- Composition of the Solution: Complex biological matrices like serum or plasma contain proteins and lipids that can attenuate adsorption. In contrast, simpler matrices like urine, bile, and cerebrospinal fluid have lower concentrations of these protective components, increasing the risk of NSB [66].
- Properties of the Analytes: Macromolecular drugs, including peptides, proteins, and nucleic acid-based therapeutics, are particularly susceptible to NSB due to their amphoteric nature, which creates strong electrostatic effects, and their large size, which amplifies hydrophobic interactions [66].
Manifestations of Matrix Interference
Matrix effects can be identified through several characteristic patterns during assay development and validation [67]:
- Apparent Concentration Shifts: Inconsistent results for samples with the same analyte concentration but from different individuals or lots.
- Nonlinear Dilution Response: Diluting a sample does not produce the expected proportional change in signal.
- Elevated Background Noise: Non-analyte components generate optical or electrochemical signals, increasing the assay's limit of detection.
- Poor Parallelism: The dose-response curve of the sample does not align with the calibration standard curve.
The following diagram illustrates how these interference mechanisms impact the assay signal pathway.
Optimized Buffers and Reagents for Allergen Extraction
Effective analysis of allergenic proteins begins with efficient extraction from complex food matrices. The recovery of 14 specific food allergens from challenging incurred matrices (chocolate dessert, raw and baked biscuit) was optimized using buffers with specific compositions [14].
Table 1: Optimized Extraction Buffers for Specific Allergen Recovery from Complex Food Matrices
| Buffer Identifier | Formulation | Key Additives | Primary Applications | Reported Recovery Range |
|---|---|---|---|---|
| Buffer D | 0.05 M sodium carbonate/bicarbonate, pH 9.6 | 10% Fish Gelatine | General allergen extraction from incurred matrices | 50–150% in most matrices [14] |
| Buffer J | PBS, 2% Tween-20, 1 M NaCl, pH 7.4 | 10% Fish Gelatine, 1% PVP (Polyvinylpyrrolidone) | Matrices with high polyphenol content (e.g., chocolate) [14] | Lower recovery in chocolate/thermally processed matrices [14] |
Key Reagent Functions:
- Fish Gelatine: Acts as a protein-based blocking agent, competing with allergens for non-specific binding sites on matrix components and plastic surfaces [14].
- PVP (Polyvinylpyrrolidone): Particularly effective in binding and neutralizing polyphenols in cocoa and other plant-based matrices, preventing their interference with antibody binding [14].
- High-Salt (1 M NaCl): Increases the ionic strength of the solution, disrupting hydrophobic and electrostatic interactions that cause NSB [14].
- Detergents (e.g., Tween-20): Reduces hydrophobic interactions by uniformly dispersing analytes and passivating surfaces [66].
Experimental Protocols for Mitigation and Validation
Protocol: Evaluation and Optimization of Sample Dilution
Dilution is a primary strategy for reducing matrix interference, but requires validation to ensure analyte detectability [67].
- Preparation: Prepare a high-concentration sample or spike a known amount of purified allergen into the control matrix.
- Serial Dilution: Create a series of dilutions (e.g., 1:2, 1:5, 1:10, 1:20, 1:50) using an appropriate assay buffer.
- Analysis: Run all dilutions in the multiplex immunoassay.
- Data Analysis: Plot the measured concentration against the dilution factor. The curve should be linear. Deviations from linearity (e.g., "hook effects" or non-linear decay) indicate persistent matrix interference at those dilution levels.
- Selection: Choose a dilution factor within the linear range that places the target analyte signal in the middle of the standard curve for accurate quantification.
Protocol: Validation of Parallelism and Recovery
This protocol confirms that the sample matrix does not alter the assay's binding characteristics [67].
- Spiking: Spike a known concentration of the purified allergen standard (A) into the assay buffer and (B) into the sample matrix.
- Comparison: Measure the concentration of both A and B using the standard curve.
- Calculation: Calculate the percentage recovery:
(Measured Concentration B / Measured Concentration A) * 100%. - Acceptance Criteria: Recovery values within 70–130% are generally considered acceptable, with more stringent limits (e.g., 80–120%) applied for validated assays [14] [67]. Consistent under- or over-recovery indicates significant matrix effects requiring further dilution or sample clean-up.
Protocol: Assessment of Nonspecific Binding Using Container Transfer
This simple test helps diagnose the presence and severity of NSB [66].
- Aliquot: Split a single sample solution into multiple containers of the same size or into containers of different sizes (e.g., a single 1.5 mL tube vs. five 0.3 mL tubes).
- Incubation: Allow the samples to stand for a defined period under typical handling conditions.
- Analysis: Measure the analyte concentration in each container.
- Interpretation: A lower measured concentration in containers with a higher surface-area-to-volume ratio indicates significant adsorptive losses. A difference between containers of the same size suggests random binding to container walls.
Advanced Platform and Assay Design Solutions
Technological innovations in assay design are providing powerful solutions to the fundamental challenges of NSB and matrix effects.
- MagPEA-POCT Platform: This system integrates magnetic bead-based target enrichment with a proximity extension assay (PEA). Magnetic beads allow for extensive washing to eliminate nonspecific binders and background matrix components. The PEA mechanism requires two antibodies to bind adjacent epitopes on the same protein to generate a signal, dramatically enhancing specificity and reducing background, leading to an improvement in sensitivity of two orders of magnitude over standard ELISA [68].
- nELISA (CLAMP) Platform: This novel design pre-assembles antibody pairs on barcoded beads, spatially separating noncognate assays to prevent reagent cross-reactivity. Detection antibodies are tethered via flexible single-stranded DNA, and signal is generated only upon successful target binding via a toehold-mediated strand displacement. This design confines antibody pairs to individual beads, preventing the formation of mismatched sandwich complexes that are a major source of background in conventional multiplex assays [69].
The integrated workflow below summarizes how these strategies combine into a robust analytical process.
The Scientist's Toolkit: Essential Research Reagent Solutions
Table 2: Key Reagents for Overcoming NSB and Matrix Effects
| Reagent / Material | Function / Purpose | Example Applications |
|---|---|---|
| Fish Gelatine (10%) | Protein-based blocking agent to reduce NSB [14]. | Food allergen extraction buffers [14]. |
| Polyvinylpyrrolidone (PVP, 1%) | Binds and neutralizes interfering polyphenols [14]. | Allergen extraction from chocolate, fruits, and other polyphenol-rich matrices [14]. |
| Non-Ionic Surfactants (e.g., Tween-20, 2%) | Reduces hydrophobic interactions and passivates surfaces [66]. | Standard component of immunoassay wash and dilution buffers [67]. |
| Heterophilic Antibody Blockers | Neutralizes human antibodies that can bridge capture and detection antibodies [67]. | Analysis of clinical serum/plasma samples to prevent false positive signals [67]. |
| Low-Adsorption Consumables | Surface-passivated tubes and plates to minimize analyte loss [66]. | Handling of sensitive samples, especially for peptide, protein, and nucleic acid analytes [66]. |
| Magnetic Beads (for capture) | Enable efficient target enrichment and thorough washing [68]. | MagPEA and other automated platforms for streamlined sample preparation [68]. |
The reliable multiplexed quantification of specific allergenic proteins is critically dependent on effectively managing non-specific binding and matrix effects. A multi-faceted approach is required, combining optimized extraction protocols with buffered additives like fish gelatine and PVP, rigorous analytical validation of dilution and recovery, and, where possible, the adoption of next-generation assay platforms designed from the ground up for enhanced specificity. By implementing the detailed strategies and protocols outlined in this Application Note, researchers can significantly improve the accuracy, sensitivity, and reproducibility of their data in allergenic protein research.
Optimizing Antibody Pairs and Diluents for Specificity and Sensitivity
The simultaneous quantification of specific allergenic proteins is a cornerstone of modern food safety and biomedical research. Within this field, multiplexed immunoassays have emerged as a powerful tool, enabling researchers to profile complex allergenic protein networks from minimal sample volume. The reliability of these assays, however, is critically dependent on two fundamental components: the performance of the matched antibody pairs and the composition of the sample diluent. Optimal antibody pairs provide the foundation for assay specificity, while a well-formulated diluent is essential for maintaining analyte integrity and maximizing sensitivity. This Application Note provides detailed protocols for the optimization of these key elements, framed within the context of allergenic protein research, to achieve robust and reproducible quantification in multiplexed formats [16] [11].
The Scientist's Toolkit: Essential Reagents for Immunoassay Development
The following table details key reagent solutions essential for developing and optimizing sandwich immunoassays for allergen detection.
Table 1: Key Research Reagent Solutions and Their Functions
| Reagent Solution | Function in Immunoassay | Key Considerations |
|---|---|---|
| Matched Antibody Pairs [70] | A pre-optimized set of capture and detector antibodies that bind to distinct epitopes on the target protein. The heart of a specific sandwich immunoassay. | Select recombinant monoclonal pairs for superior batch-to-batch consistency and specificity. Ensure they are validated for your specific assay platform (e.g., bead-based arrays) [70]. |
| Coating Buffers [71] | Solutions used to adsorb the capture antibody to a solid surface (e.g., microplate). | Common buffers include 50 mM sodium bicarbonate (pH 9.6) or PBS (pH 8.0). The pH and ionic strength are critical for efficient and stable antibody binding. |
| Blocking Buffers [71] [72] | Solutions containing proteins (e.g., BSA, casein) or other agents used to block nonspecific binding sites on the solid surface after coating. | Prevents nonspecific binding of sample and detector components, which is essential for minimizing background noise and optimizing the signal-to-noise ratio. |
| Sample Diluents [71] [73] [72] | The vehicle used to dilute the sample matrix (e.g., food extract). It must solubilize the analyte and matrix components while preserving immunoreactivity. | Must minimize matrix effects, prevent analyte degradation, and inhibit nonspecific binding. The ideal diluent is often matrix-specific and may require additives to prevent analyte adsorption to container walls [73]. |
| Wash Buffers [71] [72] | Solutions used to rinse away unbound reagents after each incubation step. | Typically consists of PBS or Tris-buffered saline with a mild detergent (e.g., 0.05% Tween-20) to remove loosely bound material without disrupting specific antibody-antigen interactions. |
| Signal Detection Systems [74] | The enzyme-substrate pair or label used to generate a measurable signal from the detector antibody. | Common systems include HRP/TMB (colorimetric) and HRP/luminol (chemiluminescent). Chemiluminescence generally offers higher sensitivity for low-abundance allergens [74]. |
Optimizing Matched Antibody Pairs for Superior Specificity
The selection and validation of antibody pairs are the most critical steps in developing a specific multiplex assay for allergenic proteins.
Selection Criteria for High-Performing Pairs
- Recombinant Monoclonal Antibodies: Prioritize recombinant monoclonal antibodies over traditional monoclonals or polyclonals. Their production method ensures unparalleled batch-to-batch consistency, confirmed specificity, and ease of long-term scalability, which is vital for reproducible allergen testing across multiple lots and studies [70].
- Carrier-Free and Conjugation-Ready Formats: Utilize carrier-free (BSA and azide-free) antibodies. This format provides maximum flexibility for custom conjugations to various detection labels (e.g., biotin, fluorophores) required for different multiplex platforms like bead-based assays (Luminex xMAP) or planar arrays [70].
- Extensive Partnership Validations: Source antibodies from vendors that partner with platform developers (e.g., Revvity, Luminex). These partnerships often mean the antibodies have been pre-validated on hundreds of multiplex panels, with data available on key targets, which can de-risk your assay development and minimize cross-reactivity in complex panels [70].
A Rigorous Validation Protocol for Antibody Pairs
The following workflow outlines a comprehensive protocol for validating antibody pairs for specificity and sensitivity.
Diagram 1: Antibody pair validation workflow
Protocol: Antibody Pair Validation for Allergen Detection
1.0 Purpose: To systematically identify and validate a matched antibody pair for the specific and sensitive detection of a target allergenic protein in a sandwich immunoassay format.
2.0 Materials:
- Candidate capture and detector antibodies (recombinant monoclonal, carrier-free).
- Target allergenic protein standard.
- Related protein homologs and common food matrix proteins (for cross-reactivity testing).
- Relevant biological samples (e.g., processed and unprocessed food extracts) [11].
- Appropriate buffer solutions (coating, blocking, wash).
- Required assay plates and detection instrumentation.
3.0 Procedure:
3.1 Epitope Bin Analysis: Use a tool like the Octet platform to group candidate antibodies into "bins" based on their binding epitopes. Select candidates from different bins to ensure they recognize non-overlapping epitopes on the target protein, which is a prerequisite for a successful sandwich pair [70].
3.2 Preliminary Pairing and Orientation:
- A. Coat different wells with each candidate capture antibody.
- B. Add a fixed concentration of the purified target allergen.
- C. Test each candidate detector antibody in the presence of the antigen.
- D. Reverse the roles of the two antibodies (test both orientations). The pair and orientation that yield the highest signal-to-noise ratio should be taken forward [70].
3.3 Cross-Reactivity Testing: Test the leading pair(s) against a panel of related proteins (e.g., other allergens from the same food family) and irrelevant proteins common to the sample matrix. A specific pair will show no significant signal above background for non-target proteins [70] [11].
3.4 Validation in Biological Samples:
- A. Spike known concentrations of the purified target allergen into a blank food matrix extract.
- B. Generate a standard curve and assess the linearity and percent recovery of the spiked analyte.
- C. Test the assay with real food extract samples to confirm the sample reading value is within the quantitative range [70] [75].
3.5 Final Selection: The optimal pair is confirmed based on a combination of sensitivity, linearity, minimal cross-reactivity, and robust performance in the intended sample matrix [70].
Formulating Sample Diluents for Enhanced Sensitivity and Stability
The sample diluent is more than a mere solubilizing agent; it is a critical determinant of assay sensitivity, specificity, and analyte stability, especially in complex food matrices [73].
Key Attributes and Composition of an Ideal Diluent
- Solubilization Power: The diluent must effectively solubilize the target allergenic protein as well as potential impurities and degradation products. It is recommended that the diluent provides a minimum of a threefold solubility margin over the target analysis concentration to account for variability and preparation of stock solutions [73].
- Matrix Effect Mitigation: The diluent should contain components that counteract interference from the sample matrix. This is often achieved by using a matrix mimic, such as serum or plasma from a species different from the sample (if applicable), or a protein-based buffer (e.g., 1% BSA in PBS) to minimize non-specific binding [71] [72].
- Analyte Stabilization: The formulation must prevent analyte degradation during the sample preparation and analysis window. This requires avoiding pH extremes or reactive chemicals and potentially including stabilizers [73].
- Prevention of Surface Interactions: Positively charged or amphiphilic proteins can adsorb to container walls (e.g., glass, plastic). Incorporating ionic strength (e.g., 150 mM NaCl) or competing proteins in the diluent can occupy these interaction sites and prevent catastrophic analyte loss, especially critical at low concentrations [73].
Systematic Diluent Optimization and Testing Protocol
Protocol: Diluent Composition Optimization
1.0 Purpose: To identify a sample diluent formulation that ensures complete analyte solubility, stability, and recovery while minimizing matrix interference for accurate allergen quantification.
2.0 Materials:
- Target allergenic protein.
- Blank food matrix extract.
- Candidate diluent components (e.g., buffers, salts, proteins, detergents).
- HPLC system or immunoassay setup for analysis.
- Volumetric flasks, pipettes, autosampler vials.
3.0 Procedure:
3.1 Solubility and Compatibility Screening:
- A. Prepare a series of candidate diluents with varying compositions (e.g., PBS, TBS, HEPES, with 0.1-1% BSA or casein, with/without 0.05-0.1% Tween-20).
- B. Attempt to dissolve the target allergen and a representative blank food extract in each candidate diluent at a 3x higher concentration than the intended assay concentration.
- C. Visually inspect for clarity and absence of precipitate after 1 hour at room temperature. Eliminate diluents that fail this test [73].
3.2 Analyte Stability Assessment:
- A. Prepare analyte solutions in the leading candidate diluents at the target concentration.
- B. Store these solutions under relevant conditions (ambient, refrigerated, in autosampler vials).
- C. Analyze the solutions at time zero and at predetermined intervals (e.g., 6, 24, 48 hours) by HPLC or immunoassay.
- D. Track the loss of parent peak/response and the formation of new impurities/degradation products. Select diluents that show ≤0.05% new impurities within the practical sample storage window [73].
3.3 Recovery and Surface Interaction Testing (Transfer Test):
- A. Prepare a solution of the analyte near the lower limit of quantification (LLOQ) in the candidate diluent.
- B. Sequentially transfer the solution through a series of 5-6 empty volumetric flasks or vials, withdrawing an aliquot for analysis from each transfer.
- C. Plot the peak area/response against the transfer number.
- D. A robust diluent will show a flat, zero-order relationship, indicating no loss of analyte to container surfaces. A downward trend signifies problematic adsorption that must be addressed by reformulating the diluent (e.g., adding more salt or protein) [73].
The effect of different diluent attributes on assay performance can be summarized as follows:
Table 2: Impact of Sample Diluent Attributes on Assay Performance
| Diluent Attribute | Impact on Assay Performance | Optimization Strategy |
|---|---|---|
| Solvent Strength [73] | A significant disparity between diluent and mobile phase solvent strength can cause peak splitting and distortion in HPLC-based assays. | Match the organic solvent content of the diluent as closely as possible to the initial mobile phase composition. |
| Ionic Strength & Protein Content [71] [73] | Prevents loss of analyte (especially charged or hydrophobic proteins) to container surfaces; reduces non-specific binding. | Incorporate 0.15 M NaCl and 0.5-1.0% BSA or casein. The transfer test is used to confirm efficacy. |
| pH and Buffer Capacity [71] | Affects antibody-antigen binding affinity and complex stability. | Use a physiological pH (7.2-7.4) for most immunoassays, with sufficient buffer capacity to resist pH changes from the sample. |
| Anti-Interference Components [71] [11] | Counters matrix effects from sugars, polyphenols, lipids, or other proteins in food extracts. | Use a matrix mimic or include specific blockers (e.g., heterophilic antibody blocking reagents) if needed. |
Integrated Experimental Workflow for Multiplexed Allergen Detection
The following diagram and protocol integrate the optimized components into a complete workflow for quantifying allergenic proteins using a multiplexed, bead-based immunoassay, a method highlighted for its utility in allergen research [16] [11].
Diagram 2: Multiplex allergen analysis workflow
Protocol: Bead-Based Multiplex Immunoassay for Allergen Quantification
1.0 Purpose: To simultaneously quantify multiple specific allergenic proteins from a single food sample extract using a bead-based multiplex immunoassay.
2.0 Materials:
- Food sample.
- High-salt or high-pH extraction buffer [11].
- Optimized sample diluent.
- Multiplex kit or custom panel of magnetic beads, each region coupled with a specific capture antibody for a target allergen.
- Biotinylated detector antibody mix.
- Streptavidin-PE conjugate.
- Assay buffer, wash buffer.
- Luminex xMAP-compatible flow cytometer or analyzer.
3.0 Procedure:
3.1 Protein Extraction:
- A. Homogenize the food sample.
- B. Extract proteins using a suitable buffer. High-salt or high-pH buffers are often more efficient for recovering allergens bound to cell walls [11].
- C. Clarify the extract by centrifugation and collect the supernatant.
3.2 Sample Dilution:
- Dilute the extracted sample supernatant in the pre-optimized sample diluent. The dilution factor should place the expected allergen concentration within the dynamic range of the standard curve and help mitigate matrix effects.
3.3 Multiplex Immunoassay:
- A. Add to Capture Bead Mix: Combine the diluted sample/standard with the mixed capture bead population in a microplate well.
- B. Incubate and Wash: Incubate with shaking to allow allergenic proteins to bind to their specific capture beads. Wash the plate to remove unbound proteins and matrix components.
- C. Add Detection Antibodies: Add the cocktail of biotinylated detector antibodies and incubate. Each detector antibody will bind to its specific allergen now captured on the beads.
- D. Incubate and Wash: Wash the plate again to remove unbound detection antibodies.
- E. Add Streptavidin-PE: Add streptavidin-conjugated phycoerythrin (Streptavidin-PE), which will bind to the biotin on the detector antibodies. Incubate and perform a final wash [16].
3.4 Signal Detection:
- Resuspend the beads in a reading buffer and analyze the plate on a Luminex analyzer. The instrument identifies each bead region (and thus the specific allergen) and quantifies the bound PE fluorescence signal.
3.5 Data Analysis:
- Use the standard curve generated for each allergen to interpolate the concentration of the allergenic proteins in the unknown samples. Report results for each allergen identified in the panel [16] [75].
Concluding Remarks
The successful implementation of a multiplexed immunoassay for allergenic protein research hinges on a meticulous, systematic approach to optimizing core components. As detailed in these protocols, the investment in validating high-quality, recombinant matched antibody pairs and formulating a robust, matrix-appropriate sample diluent pays substantial dividends in the form of superior assay specificity, sensitivity, and reproducibility. By adhering to these structured application notes, researchers and drug development professionals can generate highly reliable quantitative data, thereby accelerating discoveries and enhancing the safety assessment of food products.
Addressing the Hook Effect and Dynamic Range Limitations
Multiplexed immunoassays represent a powerful tool for the simultaneous quantification of multiple specific allergenic proteins, enhancing throughput and efficiency in food safety research and diagnostic development. However, a significant limitation of these assays, particularly in the sandwich immunoassay format, is the hook effect, an immunologic phenomenon that can lead to false-negative or falsely low results [76] [77]. This effect occurs when extremely high concentrations of an analyte (antigen) saturate both the capture and detection antibodies, preventing the formation of the necessary sandwich complex [78] [7]. Consequently, the signal intensity decreases paradoxically at high analyte concentrations, producing a characteristic hook-shaped curve when signal is plotted against concentration [76]. For researchers quantifying allergenic proteins, whose concentrations can vary dramatically across different food matrices and processing conditions, the hook effect poses a substantial risk to analytical accuracy [14] [79]. This application note delineates the mechanisms of the hook effect, presents experimental strategies for its detection and mitigation, and provides detailed protocols to safeguard the reliability of multiplexed immunoassay data within allergenic protein research.
Mechanisms and Experimental Detection
Fundamental Mechanisms
The hook effect is primarily a limitation of one-step sandwich immunoassays, where the sample antigen and labeled detection antibody are incubated simultaneously with the immobilized capture antibody [76]. In this format, when the antigen concentration becomes excessively high, it saturates the binding sites on both the capture and detection antibodies. This saturation prevents the formation of the bridge between the two antibodies that is essential for the sandwich complex [76] [77]. The detection antibodies, bound to antigen but not to the capture antibody, are subsequently washed away, leading to a diminished signal and a falsely low reported concentration [76].
In contrast, two-step immunoassays, which incorporate a wash step after the initial antigen binding and before the introduction of the detection antibody, are largely resistant to the hook effect. This initial wash removes excess antigen, ensuring that the signal is dependent only on the amount of antigen captured, thus preventing the paradoxical signal decrease at high concentrations [76].
Experimental Detection and Diagnosis
Recognizing the potential for the hook effect is critical when analyzing samples suspected of containing high allergen concentrations. A straightforward diagnostic method is serial dilution.
- Protocol: Serial Dilution for Hook Effect Detection
- Sample Preparation: Prepare a series of dilutions (e.g., 1:10, 1:100, 1:1000) of the sample extract using an appropriate assay buffer [14].
- Parallel Analysis: Run the undiluted and diluted samples simultaneously on the multiplex immunoassay platform.
- Result Interpretation: Compare the measured concentrations. If the hook effect is present, the calculated concentration from a diluted sample (e.g., 1:10) will be significantly higher than that from the undiluted sample. For instance, a sample yielding a result of 50 ng/mL when undiluted but 500 ng/mL when diluted 1:10 indicates a hooked sample [76].
Recent research has revealed that the hook effect impacts not only the test line (T) but also the control line (C) in lateral flow immunoassays (LFIAs). At high antigen concentrations, the C signal decreases before the T signal does. This is because the immobilized control antibody (e.g., goat anti-mouse antibody) has a higher binding affinity for the free, labeled detection antibody than for the antibody-analyte complex formed at high analyte concentrations [78]. This finding is crucial for digital readers that use the T/C ratio for normalization, as the assumption of a constant C signal is invalidated at high analyte levels [78].
Table 1: Documented Hook Effect Occurrences in Various Immunoassays
| Analyte Category | Specific Analytes | Reported Impact | Citation |
|---|---|---|---|
| Allergens | Hazelnut, Peanut (in LFIA) | Decrease in test and control line intensities at high concentrations (0.075–3500 ppm) | [78] |
| Infectious Disease | Borrelia burgdorferi IgG | False-low results; 26.7% of samples with IgG ≥75 AU/mL showed hook effect | [80] |
| Tumor Markers | PSA, CA125, CA19-9, Calcitonin | Risk of falsely low results in patients with high circulating concentrations | [76] |
| Hormones | Prolactin, TSH, hCG, Gonadotropins | False-negative/falsely low results, e.g., "variant hook effect" in POC hCG devices | [76] |
Diagram 1: Mechanism of the Hook Effect in One-Step Immunoassays
Mitigation Strategies and Optimized Protocols
Pre-Assay Strategies: Reagent and Workflow Optimization
Preventing the hook effect through careful assay design and sample preparation is the most robust approach.
Strategy 1: Sample Dilution and Dynamic Range Assessment
- Principle: Adjusting the analyte concentration to fall within the dynamic range of the assay.
- Protocol: Prior to large-scale analysis, screen samples at multiple dilutions to estimate concentration ranges and identify the optimal dilution factor that places analyte levels in the central, linear portion of the standard curve [76].
Strategy 2: Assay Format Selection
- Principle: Utilizing two-step immunoassay formats which are inherently less susceptible to the hook effect due to the intermediate wash step that removes excess antigen [76].
Strategy 3: Reagent Optimization
- Principle: Increasing the concentration of capture and detection antibodies can raise the antigen threshold at which the hook effect occurs [77].
- Protocol: During assay development, titrate antibody concentrations against high-concentration antigen standards to determine the levels that maximize the dynamic range and push the hook point beyond expected physiological or contamination limits.
Strategy 4: Optimized Allergen Extraction
- Principle: Efficient and consistent extraction is fundamental for accurate quantification, especially from complex matrices like chocolate or baked goods [14].
- Protocol: Optimized Buffer Extraction for Complex Matrices
- Buffer Formulation: Prepare one of the two identified high-performance buffers:
- Extraction: Add buffer to the homogenized food sample in a 1:10 (w/v) ratio. Vortex mix for 30 seconds.
- Incubation: Incubate for 15 minutes at 60°C in an orbital incubator shaking at 175 rpm.
- Clarification: Centrifuge at 1250 rcf for 20 minutes at 4°C. Collect the clarified supernatant for analysis [14].
Advanced and Post-Assay Mitigation Techniques
For situations where the hook effect is suspected in acquired data, advanced analytical techniques can be employed.
Strategy 5: Dynamic Real-Time Monitoring
- Principle: Monitoring signal development in real-time can help distinguish between true low concentrations and high concentrations affected by the hook effect [78].
- Protocol: Smartphone-Based Video Analysis of LFIA Development
- Setup: Place the developing LFIA strip in a light-shielded holder with a smartphone mounted for consistent imaging.
- Recording: Use a smartphone application (e.g., OpenCamera) to record a video of the strip development at 30 frames per second with locked exposure and focus.
- Analysis: Convert the video to images (e.g., 1 frame per second). Use image analysis software (e.g., ImageJ) to quantify the intensity of the test (T) and control (C) lines over time in a specific color channel (e.g., blue).
- Interpretation: The kinetic profile of T and C line development can differentiate a true positive from a hooked sample [78].
Strategy 6: Dilution as a Standard Practice for High-Range Analytes
- Principle: Establishing a dilution threshold for all samples above a certain signal level can proactively correct for the hook effect.
- Protocol: Based on the study of the Borrelia IgG assay, a generic protocol can be derived:
- Define Threshold: Establish a conservative dilution threshold based on preliminary data. For example, if the assay's upper limit of linearity is 100 AU, consider diluting all samples with signals >90 AU.
- Automate Dilution: Implement this dilution protocol in the standard operating procedure for the assay.
- Validate: Confirm that dilution recovers a higher, plateau-level concentration and does not lead to overdilution (signal falling below the limit of detection) [80].
Table 2: Comparison of Hook Effect Mitigation Strategies
| Strategy | Principle | Advantages | Limitations | Best Suited For |
|---|---|---|---|---|
| Sample Dilution | Brings analyte into dynamic range | Simple, universally applicable | Increases sample volume use & preparation time | Routine screening of unknown samples |
| Two-Step Assay Format | Physical removal of excess antigen | Inherently robust; prevents hook effect | Longer protocol duration; not all kits are two-step | Assay development/selection phase |
| Reagent Optimization | Increases antibody:antigen ratio | Pushes hook point to higher concentrations | Requires extensive development; higher cost | In-house developed assays |
| Real-Time Monitoring | Kinetic analysis of signal development | Distinguishes true low from hooked high | Requires specialized equipment/software | Lateral flow & rapid tests |
| Automated Dilution Threshold | Proactive dilution of high signals | Pre-empts false results; easy to implement | Risk of "over-dilution" for very high samples | Automated clinical chemistry analyzers |
Diagram 2: Diagnostic Workflow for Suspected Hook Effect
The Scientist's Toolkit: Essential Research Reagents and Materials
Table 3: Key Research Reagent Solutions for Allergen Immunoassays
| Item/Category | Specific Examples & Formulations | Critical Function in Assay | Considerations for Hook Effect |
|---|---|---|---|
| Capture/Detection Antibodies | Monoclonal Antibodies (mAbs) specific to allergenic proteins (e.g., Ara h 1, Cor a 9) | Form the core of the sandwich complex; define specificity and sensitivity. | Using high-affinity mAbs and optimizing their concentration can raise the antigen threshold for the hook effect [78] [77]. |
| Extraction Buffers | PBS with 2% Tween-20, 1 M NaCl, 10% Fish Gelatine, 1% PVP; or 50 mM Carbonate-Bicarbonate with 10% Fish Gelatine [14] | Efficiently release and solubilize allergenic proteins from complex food matrices while maintaining immuno-reactivity. | Critical for obtaining accurate quantitative data. Inefficient extraction can mask true concentration, confounding hook effect diagnosis [14]. |
| Blocking Agents | Fish Gelatine, Bovine Serum Albumin (BSA), Non-Fat Dry Milk (NFDM), Polyvinylpyrrolidone (PVP) | Reduce non-specific binding in the assay, lowering background noise and improving signal-to-noise ratio. | PVP is particularly useful for matrices rich in polyphenols (e.g., chocolate) [14]. |
| Labeling & Detection Systems | Carbon Nanoparticles (CNP) for LFIA; Electrochemiluminescence (e.g., MSD); Fluorescent Microspheres [78] [81] [7] | Generate a measurable signal proportional to the amount of captured analyte. | Highly sensitive detection systems (e.g., MSD) allow for work at higher dilutions, helping to avoid the high-concentration zone of the hook effect [7]. |
| Reference Materials | In-house prepared total protein extracts (e.g., Total Peanut Protein - TPP); Purified specific allergens [78] | Used for creating standard curves for quantification. Essential for assessing recovery from matrices. | Accurate standards are vital. Using a two-step assay format with purified calibrants can improve standardization and reduce hook effect risk [78] [76]. |
The hook effect is a pervasive and often underestimated challenge in the multiplexed quantification of specific allergenic proteins. It can lead to severe underestimation of allergen levels, compromising food safety for allergic consumers and the validity of research data. A multi-faceted approach is essential for mitigation: this includes employing robust, optimized extraction protocols, understanding the limitations of one-step assay formats, proactively using serial dilution to diagnose suspicious samples, and considering advanced techniques like real-time kinetic monitoring. By integrating these strategies into standard analytical workflows, researchers and drug development professionals can significantly enhance the reliability, accuracy, and dynamic range of their multiplexed immunoassay data, ensuring that results truly reflect the underlying biological or contamination reality.
Sample Preparation and Extraction Protocols for Complex Food Matrices
Accurate quantification of specific allergenic proteins in food is paramount for protecting consumers and supporting regulatory compliance. For researchers utilizing multiplexed immunoassays, sample preparation is the most critical step, as it directly dictates the accuracy, sensitivity, and reproducibility of the simultaneous quantification of multiple specific allergens [82]. Complex, processed food matrices introduce significant challenges, including reduced protein solubility, epitope masking, and non-specific binding, which can lead to underestimation of allergen content and false-negative results [14]. This application note provides detailed protocols and data, framed within a research context, to optimize extraction for multiplexed immunoassay analysis.
Experimental Protocols: Optimized Extraction for Multiplex Analysis
Simultaneous extraction of multiple clinically relevant allergens requires buffers that can effectively disrupt matrix interactions across various food types. The following protocol is adapted from a study aimed at identifying shared extraction methods for allergen-specific multiplex arrays [14].
Materials and Reagents
- Incurred Food Matrices: Chocolate dessert, biscuit dough, and baked biscuits, incurred with allergen source materials (e.g., peanut, milk, egg, hazelnut flour) at defined protein concentrations (e.g., 10, 100, and 1000 ppm total allergenic protein).
- Extraction Buffers: See Table 1 for detailed formulations.
- Equipment: Vortex mixer, orbital incubator (e.g., Stuart SI500), centrifuge capable of 1250 rcf, and refrigerated centrifuge set to 4°C.
Detailed Extraction Procedure
- Sample Homogenization: Weigh 1 gram of the homogenized food sample into a suitable extraction tube.
- Buffer Addition: Add 10 mL of the chosen extraction buffer (see Table 1 for selection guidance) to achieve a 1:10 sample-to-buffer ratio.
- Initial Mixing: Vortex the mixture for 30 seconds to ensure thorough wetting and initial dispersion.
- Incubation: Incubate the sample for 15 minutes in an orbital incubator set to 60°C and shaking at 175 rpm. This elevated temperature aids in protein solubilization, particularly from thermally processed matrices.
- Clarification: Centrifuge the extracts at 1250 rcf for 20 minutes at 4°C to pellet insoluble debris.
- Supernatant Collection: Carefully collect the clarified supernatant from the middle of the tube, avoiding the surface lipid layer and the insoluble pellet, for immediate analysis or storage at -20°C.
Buffer Selection Guide
The recovery efficiency of specific allergens is highly dependent on buffer composition. Based on a systematic evaluation of 10 different buffers, two were identified as providing optimal and complementary recovery for 14 specific allergens across multiple matrices [14].
- Buffer D (Carbonate-Bicarbonate with FG): Ideal for general use, providing high recovery for many allergens.
- Buffer J (PBS with High Salt, Detergent, FG, and PVP): Particularly effective for challenging matrices containing high levels of polyphenols (e.g., chocolate) or fats.
Table 1: Composition of Optimized Extraction Buffers for Multiplex Allergen Analysis
| Buffer Identifier | Formulation | Key Characteristics | Primary Application |
|---|---|---|---|
| Buffer D | 50 mM sodium carbonate/sodium bicarbonate, 10% fish gelatine, pH 9.6 | Alkaline pH, protein-blocking agent | General use for a wide range of specific allergens. |
| Buffer J | PBS, 2% Tween-20, 1 M NaCl, 10% fish gelatine, 1% PVP, pH 7.4 | High ionic strength, detergent, protein & polyphenol-blocking agents | Complex matrices like chocolate, or matrices with high polyphenol content. |
Quantitative Data and Performance
The performance of the optimized buffers was quantitatively assessed by measuring the percentage recovery of specific allergens from incurred food matrices using allergen-specific multiplex arrays and ELISAs. Recovery within 50-150% is generally considered acceptable for quantitative analysis [14].
Table 2: Allergen Recovery from Processed Food Matrices Using Optimized Buffers
| Allergen (Specific Protein) | Chocolate Dessert | Baked Biscuit | Key Buffer |
|---|---|---|---|
| Peanut (Ara h 3/6) | 50-80% | 70-120% | Buffer J / Buffer D |
| Milk (Bos d 5) | 60-90% | 80-150% | Buffer D |
| Egg (Gal d 1/2) | 55-85% | 75-130% | Buffer D |
| Hazelnut | 50-75% | 70-110% | Buffer J |
| Sesame | 45-70% | 65-100% | Buffer J |
| Cashew | 60-95% | 80-140% | Buffer D |
| Note: Matrices containing chocolate or subject to thermal processing typically show lower recoveries. Buffer J generally improves recovery in chocolate matrices, while Buffer D is often sufficient for baked goods like biscuits. |
Workflow Diagram: Extraction for Multiplex Immunoassay
The following diagram illustrates the integrated workflow from sample preparation to multiplex analysis, crucial for ensuring reliable quantification.
The Scientist's Toolkit: Research Reagent Solutions
Table 3: Essential Reagents for Allergen Extraction from Complex Matrices
| Reagent / Additive | Function in Extraction | Research Application Note |
|---|---|---|
| Fish Gelatine (FG) | Protein-based blocking agent; reduces non-specific binding and epitope masking by competing for binding sites. | Critical for improving solubility and assay accuracy in multiplex immunoassays [14]. |
| Polyvinylpyrrolidone (PVP) | Binds and precipitates polyphenols (e.g., in chocolate, cereals), preventing their interference with antibody binding. | Essential for matrices high in polyphenols to mitigate false negatives [14]. |
| Tween-20 (Detergent) | Non-ionic surfactant that disrupts lipid-protein and protein-protein interactions, enhancing solubilization. | Standard component (1-2%) to improve extraction efficiency from fatty matrices [14]. |
| Sodium Chloride (1 M NaCl) | Increases ionic strength to disrupt electrostatic protein-matrix interactions. | High salt concentration aids in the release of allergens from complex matrices [14]. |
| Sodium Dodecyl Sulfate (SDS) | Ionic detergent that denatures proteins, effectively exposing buried epitopes. | Used in denaturing buffers for LC-MS/MS or subsequent immunoassays tolerant to denaturation [82]. |
Validation, Comparative Analysis, and Platform Selection Criteria
In the field of allergenic protein research, the simultaneous quantification of multiple specific biomarkers demands rigorous analytical method validation. The transition from single-analyte immunoassays, such as the traditional Enzyme-Linked Immunosorbent Assay (ELISA), to multiplexed immunoassays represents a significant technological advancement that enables comprehensive biomarker profiling while conserving valuable sample volume [83]. However, this increased analytical power necessitates careful characterization of key validation parameters to ensure data reliability and clinical relevance.
Multiplex immunoassays, including bead-based and electrochemiluminescence (ECL) platforms, allow researchers to quantify numerous allergenic proteins in a single sample run [83] [44]. Unlike conventional ELISA, which measures a single target per assay, these advanced systems facilitate the efficient study of complex biomarker signatures essential for understanding food allergenicity and therapeutic development [83]. The performance of these multiplex systems must be critically evaluated through established validation parameters including sensitivity, specificity, precision, and accuracy to guarantee meaningful results in both research and clinical applications.
This protocol outlines comprehensive procedures for establishing these fundamental validation parameters specifically within the context of multiplexed immunoassays for allergenic protein quantification, providing researchers with a framework for generating reliable, reproducible data.
Theoretical Foundations of Validation Parameters
Definitions and Statistical Calculations
Four key parameters form the foundation of immunoassay validation, each providing distinct information about assay performance and reliability.
Accuracy refers to the closeness of agreement between a measured value and the true value of the analyte [84]. It indicates a test's ability to actually measure what it is supposed to measure. In statistical terms, accuracy is calculated as the proportion of true results (both positive and negative) in the population:
Accuracy = (True Positives + True Negatives) / (Total Cases) [85]
Precision describes the closeness of agreement between independent measurements obtained under the same conditions [84] [86]. Unlike accuracy, precision does not measure "correctness" but rather the reproducibility of results. A method can be precise (reliably reproducible) without being accurate, or accurate without being precise, though the ideal assay achieves both [84]. Precision is typically expressed as the coefficient of variation (CV) between repeated measurements.
Sensitivity represents the ability of a test to correctly identify individuals who have a given disease or condition [84] [87]. Also called the "true positive rate," it measures how well an assay detects the target analyte when it is present. Mathematically, sensitivity is defined as:
Sensitivity = True Positives / (True Positives + False Negatives) [87] [88]
Specificity indicates the ability of a test to correctly exclude individuals who do not have a given disease or condition [84] [87]. Termed the "true negative rate," it reflects the assay's ability to avoid false positives when the target analyte is absent:
Specificity = True Negatives / (True Negatives + False Positives) [87] [88]
Table 1: Relationship between Test Results and Actual Conditions
| Test Result | Condition Present | Condition Absent |
|---|---|---|
| Positive | True Positive (TP) | False Positive (FP) |
| Negative | False Negative (FN) | True Negative (TN) |
Interrelationships and Trade-offs
These validation parameters exhibit important interrelationships in practical applications. Sensitivity and specificity often have an inverse relationship; as sensitivity increases, specificity tends to decrease, and vice versa [87]. This trade-off necessitates careful consideration of the assay's intended application. For allergen detection, highly sensitive tests are crucial when the goal is to "rule out" potential contamination, as they minimize false negatives that could pose health risks to allergic consumers [84] [88]. Conversely, highly specific tests are valuable for "ruling in" contamination when positive, as they minimize false positives that could lead to unnecessary product recalls [88].
The clinical context significantly influences which parameters require emphasis. When detecting trace allergenic proteins where missing a positive could have severe health consequences, maximizing sensitivity is paramount [84]. In contrast, for confirmatory testing following an initial positive screen, high specificity becomes more critical to avoid unnecessary actions based on false positives [84] [85].
Experimental Protocol for Parameter Establishment
Sample Preparation and Extraction Optimization
Proper sample preparation is critical for accurate allergen quantification, particularly when working with challenging food matrices.
Extraction Buffer Preparation: Prepare multiple extraction buffers with varying compositions to identify optimal conditions. Key components should include:
- Base buffers: 50 mM carbonate bicarbonate or PBS
- Additives: Fish gelatine (10%), PVP (1%), Tween (2%)
- Salt modifications: 1 M NaCl to increase ionic strength [89]
Matrix-Incurred Sample Preparation:
- Prepare placebo food matrices (chocolate dessert, biscuit dough) without target allergens as negative controls
- Incur matrices with defined levels of allergenic protein (e.g., 10, 100, 1000 ppm) using characterized allergen source materials
- Process samples (e.g., bake biscuits at 185°C for 15 minutes) to mimic real-world conditions [89]
- Extract using optimized buffers at 1:10 sample-to-buffer ratio
- Vortex mix for 30 seconds, then incubate for 15 minutes at 60°C with orbital shaking at 175 rpm
- Clarify supernatant by centrifugation at 1250 rcf for 20 minutes at 4°C [89]
Source Material Characterization:
- Prepare a source material mix (SMM) from single food source materials containing defined amounts of specific allergens
- Perform triplicate extractions using different extraction buffers
- Analyze by allergen-specific multiplex array to establish baseline recovery values [89]
Establishing Sensitivity and Specificity
Determining Analytical Sensitivity:
- Prepare a dilution series of purified allergen standards in appropriate matrix
- Analyze minimum of 8 concentrations with duplicate measurements
- Identify the Limit of Detection (LOD): the lowest analyte concentration that can be reliably distinguished from zero [86]
- Establish Limit of Quantification (LOQ): the lowest concentration that can be measured with acceptable precision and accuracy (typically ≤20% CV) [86]
- Calculate sensitivity using the formula: Sensitivity = TP/(TP+FN) using known positive and negative samples [87]
Establishing Analytical Specificity:
- Test cross-reactivity against related allergenic and non-allergenic proteins
- Evaluate interference from common food matrix components (fats, polyphenols, carbohydrates)
- Assess potential hook effect at high analyte concentrations
- Calculate specificity using the formula: Specificity = TN/(TN+FP) using known negative samples [87]
Table 2: Experimental Design for Sensitivity and Specificity Determination
| Experiment Type | Sample Composition | Replicates | Key Measurements |
|---|---|---|---|
| Limit Detection | Dilution series in matrix | Minimum 8 concentrations in duplicate | LOD, LOQ |
| Cross-reactivity | Related protein structures | 3-5 concentrations | % Cross-reactivity |
| Matrix Interference | Complex food matrices with/without allergen | 6 replicates | Recovery % |
| Specificity Panel | Known positive and negative samples | As available | TP, TN, FP, FN |
Determining Precision and Accuracy
Precision Assessment:
- Intra-assay precision: Analyze multiple replicates (n≥5) of three QC samples (low, medium, high concentration) within the same assay run
- Inter-assay precision: Analyze the same QC samples across multiple runs (n≥3) on different days by different operators
- Inter-operator precision: Compare results obtained by different trained personnel using the same protocol and materials
- Calculate mean, standard deviation, and coefficient of variation (CV) for each level [44] [86]
Accuracy Evaluation:
- Spike-recovery experiments: Add known quantities of purified allergen to negative matrix at multiple concentrations
- Reference material comparison: Analyze certified reference materials when available
- Method comparison: Compare results with validated reference methods where applicable
- Calculate percent recovery: (Measured Concentration/Expected Concentration) × 100% [89] [86]
Acceptance Criteria:
- Precision: CV ≤20% for intra-assay and inter-assay precision
- Accuracy: Recovery rates between 80-120% for most concentrations
- Total error: Combination of imprecision and inaccuracy should fall within pre-defined limits based on intended use [89] [86]
Workflow Visualization
Figure 1: Comprehensive workflow for establishing validation parameters for multiplex immunoassays, beginning with sample preparation and progressing through each key parameter assessment.
Data Analysis and Interpretation
Statistical Analysis of Validation Parameters
Proper statistical analysis is essential for objective assessment of assay performance characteristics.
Calculating Sensitivity and Specificity: Construct a 2x2 contingency table comparing test results with known true status (determined by gold standard method) [87]. Calculate:
- Sensitivity = TP/(TP+FN)
- Specificity = TN/(TN+FP)
- Positive Predictive Value (PPV) = TP/(TP+FP)
- Negative Predictive Value (NPV) = TN/(TN+FN) [87]
Precision Analysis: Calculate mean, standard deviation (SD), and coefficient of variation (CV) for QC samples at multiple concentrations:
Accuracy Assessment: For recovery experiments:
- % Recovery = (Measured Concentration/Expected Concentration) × 100
- Plot measured vs. expected values with regression analysis
- Determine slope, intercept, and correlation coefficient (R²) [89]
Table 3: Example Validation Data from Multiplex Allergen Assay
| Validation Parameter | Target Value | Experimental Result | Acceptance Criteria |
|---|---|---|---|
| Sensitivity (LOD) | 0.1 ppm | 0.09 ppm | ≤0.2 ppm |
| Intra-assay Precision (%CV) | <15% | 8.5% | Meet target |
| Inter-assay Precision (%CV) | <20% | 12.3% | Meet target |
| Accuracy (% Recovery) | 80-120% | 94.5% | Meet target |
| Specificity | >90% | 96.1% | Meet target |
Troubleshooting Common Issues
Poor Sensitivity:
- Optimize antibody pairs and concentrations
- Increase incubation times or temperatures
- Evaluate different detection systems (chemiluminescence vs. fluorescence)
- Improve extraction efficiency from complex matrices [89]
Inadequate Specificity:
- Test different capture/detection antibody combinations
- Increase stringency of wash buffers
- Pre-absorb samples with interfering substances
- Evaluate cross-reactivity with related allergens [11]
Unacceptable Precision:
- Standardize sample processing steps
- Ensure consistent reagent preparation and storage
- Implement rigorous QC procedures
- Train operators to minimize technical variation [86]
Research Reagent Solutions
Table 4: Essential Research Reagents for Multiplex Allergen Immunoassays
| Reagent Category | Specific Examples | Function | Considerations |
|---|---|---|---|
| Extraction Buffers | Carbonate bicarbonate with fish gelatine; PBS with Tween, NaCl | Solubilize and recover allergens from matrices | Buffer composition significantly impacts recovery rates [89] |
| Antibody Pairs | Allergen-specific monoclonal/polyclonal antibodies | Capture and detect target analytes | Specificity must be validated for each allergen target [11] |
| Calibration Standards | Purified native or recombinant allergens | Quantification reference | Should be identical to target analyte when possible [89] |
| Multiplex Platforms | Bead-based arrays (Luminex); ECL (Meso Scale Discovery) | Simultaneous detection of multiple analytes | Platform choice affects dynamic range and sensitivity [83] [44] |
| Matrix Interference Blockers | Fish gelatine, BSA, non-fat dry milk | Reduce non-specific binding | Optimal blockers vary by sample matrix [89] |
Establishing comprehensive validation parameters for multiplexed immunoassays targeting specific allergenic proteins requires systematic experimental approaches and rigorous data analysis. The protocols outlined herein provide researchers with a framework for characterizing critical performance metrics including sensitivity, specificity, precision, and accuracy. Proper validation ensures that multiplex immunoassays generate reliable data suitable for informing clinical and regulatory decisions regarding food allergen content, ultimately protecting consumer health while supporting innovation in food production and therapeutic development.
As multiplex technologies continue to evolve, validation parameters may require expansion to address novel analytical challenges. However, the fundamental principles described in this protocol will remain essential for demonstrating assay reliability and generating scientifically defensible data in allergenic protein research.
Multiplexed immunoassays have become indispensable tools for the simultaneous quantification of specific allergenic proteins, advancing research in risk assessment, food labeling compliance, and therapeutic development. This application note provides a comparative analysis of four leading platforms—Meso Scale Discovery (MSD), Luminex, Olink, and NULISA—evaluating their performance metrics, experimental protocols, and suitability for allergenic protein research. Based on recent validation studies, MSD demonstrated the highest sensitivity in challenging sample types like skin tape strips, detecting 70% of shared proteins, followed by NULISA (30%) and Olink (16.7%) [7]. For standard biofluids, NULISA achieves attomolar sensitivity, outperforming traditional platforms for low-abundance targets [90]. The selection of an optimal platform depends on a balance between required sensitivity, sample volume, multiplexing capacity, and specific research applications in allergology.
Table 1: Core Platform Characteristics and Performance Summary
| Platform | Technology Principle | Max Multiplexing | Sample Volume (per panel) | Key Strength |
|---|---|---|---|---|
| MSD | Electrochemiluminescence | ~10-plex per well (combinable) [91] | 20-40 µL [91] | Highest sensitivity in complex matrices [92] [7] |
| Luminex | Bead-based Fluorescence | 20-80 analytes [91] | 12.5-60 µL [91] | Well-established, flexible panel customization [6] |
| Olink | Proximity Extension Assay (PEA) | 92 proteins (Target 96) [93] | ~1 µL [91] | Excellent specificity, low sample volume [91] |
| NULISA | Sequential Immuno-Capture & Release | 250-plex [7] | ~10-35 µL [90] [91] | Attomolar sensitivity, ultra-broad dynamic range [38] [90] |
Table 2: Quantitative Performance Comparison for Shared Proteins
| Performance Metric | MSD | Luminex | Olink | NULISA |
|---|---|---|---|---|
| Detectability in SCTS (30-plex) [7] | 70% | - | 16.7% | 30% |
| Sensitivity (LoD) | Sub-pg/mL [91] | Moderate [91] | Low-pg/mL [91] | Attomolar (low fg/mL) [90] |
| Dynamic Range | Wide [91] | Good [91] | Good [91] | Up to 12 logs [38] |
| Correlation (Spearman r)* | - | ≥0.9 (IL1α, IL6) [92] | ≥0.9 (IL1α, IL6) [92] | - |
| Inter-platform Concordance (ICC) | 0.5 - 0.86 [7] | - | 0.5 - 0.86 [7] | 0.5 - 0.86 [7] |
Correlation for high-abundance proteins like IL1α and IL6 across MSD, Luminex, and Olink. *Interclass Correlation Coefficient for proteins (e.g., CXCL8, VEGFA) detected by MSD, Olink, and NULISA.
The core technology behind each platform dictates its performance in detecting allergenic proteins.
MSD (Meso Scale Discovery)
MSD utilizes electrochemiluminescence detection. Capture antibodies are spotted on carbon electrode-integrated wells. Upon target protein binding, a detection antibody labeled with an electrochemiluminescent tag (sulfo-tag) is added. Applying an electric voltage triggers light emission from tags bound to the electrode surface, which is quantified [91]. This method offers low background and a wide dynamic range.
Luminex xMAP
The Luminex xMAP technology is a magnetic bead-based suspension array. Microspheres are internally dyed with unique fluorophore mixtures, creating distinct spectral addresses. Each bead set is coupled with a specific capture antibody. After target protein binding, a biotinylated detection antibody and streptavidin-phycoerythrin are used. Lasers identify the bead (and thus the analyte) and quantify the bound phycoerythrin signal [34] [6]. This allows highly flexible and customizable multiplexing.
Olink Proximity Extension Assay (PEA)
Olink's PEA uses pairs of antibodies each tagged with a unique DNA oligonucleotide. When both antibodies bind their target protein, the DNA tags are brought into proximity, allowing them to hybridize. This hybridized DNA is then extended by a DNA polymerase, creating a double-stranded DNA "barcode" unique to the protein target. This barcode is quantified via qPCR or NGS, translating protein concentration into a digital DNA readout [93] [91]. This process enhances specificity by requiring dual antibody recognition for signal generation.
NULISA (Nucleic Acid Linked Immuno-Sandwich Assay)
NULISA incorporates a proprietary dual-capture and release mechanism for extreme background suppression. Similar to PEA, it uses oligonucleotide-conjugated antibodies. However, after immunocomplex formation, complexes are first captured via polyA-dT hybridization, washed, and released. A second capture step via streptavidin-biotin binding further purifies intact immunocomplexes before proximity ligation creates the reporter DNA for NGS readout [90]. This process reduces background by >10,000-fold, enabling attomolar sensitivity [90].
Experimental Protocols for Allergen Research
Protocol 1: Multiplex Food Allergen Detection via Luminex xMAP FADA
The xMAP Food Allergen Detection Assay (xMAP FADA) is validated for simultaneous detection of 14 food allergens plus gluten [34].
Key Research Reagent Solutions:
- Magnetic Bead Sets: Color-coded magnetic polystyrene beads (e.g., Luminex MagPlex) covalently coupled to specific monoclonal or polyclonal capture antibodies [6].
- Allergen Reference Standards: Purified, quantified native or recombinant allergenic proteins (e.g., Ara h 1 for peanut, Gal d 1 for egg) for standard curve generation [6].
- Biotinylated Detection Antibodies: A cocktail of monoclonal/polyclonal antibodies specific to different allergenic targets, conjugated to biotin.
- Assay Buffer: Phosphate Buffered Saline (PBS) with 0.05% Tween-20 or proprietary UD Buffer for extraction [34].
- Reading Buffer: Includes streptavidin-phycoerythrin for fluorescent signal amplification.
Detailed Methodology:
- Sample Extraction:
- Buffered-Detergent Extraction: Weigh 1 g of homogenized food sample. Add 10 mL of PBS-Tween (or UD Buffer). Vortex thoroughly and incubate with shaking. Centrifuge to clarify the supernatant [34].
- Reduced-Denatured Extraction (for processed foods): For challenging matrices, use a buffer containing 0.5% SDS and 2% β-mercaptoethanol to extract denatured proteins [34].
- Assay Procedure:
- Combine 50 µL of sample or standard with 50 µL of the mixed magnetic bead-antibody cocktail in a 96-well plate.
- Incubate for 1-2 hours with shaking in the dark.
- Wash the beads 2-3 times using a magnetic plate washer.
- Add 100 µL of biotinylated detection antibody cocktail. Incubate for 1 hour with shaking.
- Wash as before.
- Add 100 µL of streptavidin-phycoerythrin. Incubate for 30 minutes.
- Perform a final wash, then resuspend beads in reading buffer.
- Data Acquisition and Analysis:
- Analyze on a Luminex analyzer (e.g., FLEXMAP 3D). The instrument identifies each bead by its color code and quantifies the median fluorescence intensity (MFI) for each analyte.
- Generate a standard curve for each allergen using reference standards and calculate concentrations in unknown samples [34] [6].
- Utilize built-in redundancy (multiple antibodies per target) and ratio analysis to confirm specific detection and minimize false positives [34].
Protocol 2: High-Sensitivity Biomarker Analysis in Complex Matrices
This protocol is adapted from a comparative study of MSD, Olink, and NULISA using stratum corneum tape strips (SCTS), a low-protein-yield sample [7].
Key Research Reagent Solutions:
- Tape Strips: Standardized adhesive tapes (e.g., D-Squame) for consistent, non-invasive sample collection [7].
- Extraction Buffer: Phosphate-buffered saline (PBS) with 0.005% Tween 20 [7].
- Platform-Specific Kits: Pre-configured, validated panels are recommended.
- MSD: U-PLEX or V-PLEX Custom Biomarker Assays.
- Olink: Target 96 Inflammation Panel.
- NULISA: 250-plex Inflammation Panel.
- Normalization Controls: For MSD, a total protein assay (e.g., BCA) can be used to normalize for variable sample content. For Olink and NULISA, internal controls are included in the kit.
Detailed Methodology:
- Sample Collection and Preparation:
- Apply adhesive tape strips to the skin site with consistent pressure. Peel off with tweezers and store at -80°C.
- For extraction, add 0.8 mL of PBS-Tween to the tape strip in a vial.
- Sonicate in an ice bath for 15 minutes.
- Transfer the extract to subsequent tapes (e.g., 4th, 6th, 7th) to pool and concentrate analytes.
- Aliquot and store the final extract at -80°C until analysis [7].
- Platform-Specific Assay Execution:
- MSD: Follow manufacturer's protocol for U-PLEX/V-PLEX assays. Requires sample aliquots of 20-40 µL. The assay involves incubation with patterned plates, washing, and reading on an MSD QuickPlex SQ 120 Imager [7] [91].
- Olink: Use 1-10 µL of sample extract. The PEA protocol involves incubating the sample with the antibody-DNA panel, followed by proximity extension, PCR amplification, and readout on a Novaseq or Signature Q100 instrument [7] [93].
- NULISA: Use ~10 µL of sample. The assay leverages the automated ARGO HT System for the multi-step process of immunocomplex formation, dual capture, ligation, and library preparation for NGS sequencing [38] [7].
- Data Analysis and Cross-Platform Comparison:
- Process raw data using each platform's proprietary software (e.g., MSD Discovery Workbench, Olink NPX Manager, Alamar Cloud).
- For proteins detected across platforms (e.g., CXCL8, VEGFA), assess concordance using correlation analyses (e.g., Interclass Correlation Coefficient) [7].
The Scientist's Toolkit: Essential Materials for Multiplex Allergen Research
Table 3: Key Research Reagent Solutions
| Item | Function | Example Applications |
|---|---|---|
| Monoclonal Antibody Pairs | Highly specific capture and detection of single, defined allergenic protein targets (e.g., Ara h 2). | MARIA for Foods; target-specific assays [6]. |
| Purified Allergen Standards | Quantitative reference for standard curve generation; ensures accurate quantification. | All multiplex platforms requiring absolute concentration data [6]. |
| Magnetic Bead Sets | Solid phase for capture antibodies in suspension arrays; enable washing and purification. | Luminex xMAP FADA [34] [6]. |
| Electrochemiluminescent Labels | Signal generation (e.g., MSD SULFO-TAGS) for highly sensitive detection with low background. | MSD assays [91]. |
| DNA-Oligo Conjugated Antibodies | Key reagents for PEA and NULISA; enable proximity-dependent DNA barcode generation. | Olink and NULISA platforms [90] [93]. |
| Standardized Extraction Buffers | Efficient and consistent recovery of proteins from complex matrices (food, tape strips). | Buffered-detergent and reduced-denatured protocols [34] [7]. |
The optimal multiplex immunoassay platform for allergenic protein research depends heavily on the specific experimental goals and sample constraints.
- For Maximum Sensitivity in Challenging Matrices: MSD is the preferred choice, consistently demonstrating superior detectability in low-protein samples like skin tape strips [92] [7].
- For Ultra-Sensitive Detection of Low-Abundance Biomarkers: NULISA offers a distinct advantage with its attomolar sensitivity, making it ideal for profiling low-level cytokines and inflammatory mediators in biofluids [90] [7].
- For High-Multiplex Profiling with Minimal Sample Volume: Olink provides an excellent balance of specificity and multiplexing with very low sample consumption, crucial for precious or volume-limited samples [91].
- For Established, Flexible Food Allergen Detection: Luminex platforms like the xMAP FADA are well-validated for simultaneous detection of multiple food allergens, offering robust performance and built-in confirmatory analysis [34] [6].
Researchers should consider conducting pilot studies with their specific sample types to empirically determine the most suitable platform, as performance can vary based on the specific allergenic targets and sample matrix.
Analyzing Concordance and Correlation Across Different Platforms
The transition from singleplex to multiplexed immunoassays represents a paradigm shift in the simultaneous quantification of specific allergenic proteins. These advanced platforms offer researchers the powerful ability to detect dozens of analytes from a single, small-volume sample, dramatically increasing throughput while conserving precious specimens [94]. However, this increased multiplexing capacity introduces a critical challenge: ensuring that results are consistent, reliable, and comparable across different analytical systems. Platform-dependent variability can arise from differences in technology, solid-phase matrices, allergen binding capacity, and susceptibility to matrix effects, making the assessment of concordance and correlation a cornerstone of robust assay validation [7] [64] [31]. This application note details standardized protocols and analytical frameworks for researchers to systematically evaluate and compare performance across multiplex platforms, with a specific focus on applications in allergenic protein research.
Quantitative Platform Comparison
The analytical performance of immunoassay platforms directly dictates the validity and interpretability of experimental data. The table below summarizes key performance metrics from recent studies comparing multiplex platforms in protein biomarker and allergen analysis.
Table 1: Performance Comparison of Multiplex Immunoassay Platforms
| Platform | Detectability of Shared Proteins | Key Strengths | Reported Limitations | Inter-Assay Correlation (ICC range) |
|---|---|---|---|---|
| Meso Scale Discovery (MSD) | 70% (Highest sensitivity) [7] | Provides absolute protein concentrations; enables normalization for variable sample content [7]. | Lower throughput per run; higher sample volume requirements [7]. | 0.50 - 0.86 (with NULISA/Olink) [7] |
| NULISA | 30% [7] | Attomolar sensitivity; minimal sample volume required [7]. | Lower detectability in challenging samples like tape strips [7]. | 0.50 - 0.86 (with MSD/Olink) [7] |
| Olink | 16.7% [7] | Minimal sample volume; high-plex panels [7]. | Lower detectability in challenging samples [7]. | 0.50 - 0.86 (with MSD/NULISA) [7] |
| Multiplex Microsphere (e.g., Luminex/xMAP) | N/A | High-throughput potential; low sample volume [31]. | Highly susceptible to matrix effects, causing signal suppression/aggregation [31]. | High (with PC-PURE purification) [31] |
| Microarray (e.g., ISAC, ALEX) | N/A | Comprehensive IgE sensitization profile; minimal serum volume [94]. | Lower allergen amount on solid phase may reduce sensitivity for low-IgE samples [94]. | Substantial to Almost Perfect (Kappa: 0.51-0.93 vs ImmunoCAP) [95] |
For allergen-specific IgE detection, studies show generally good agreement between multiplex and established singleplex methods, though concordance can vary. A comparison of the AdvanSure AlloScreen multiplex assay with the ImmunoCAP singleplex assay showed almost perfect agreement (Kappa 0.85) for house dust mites, but only moderate agreement (Kappa 0.51) for cow's milk, underscoring the allergen-specific nature of platform performance [95].
Experimental Protocols
Protocol 1: Optimized Allergen Extraction from Complex Food Matrices
The accurate quantification of allergenic proteins is critically dependent on efficient and reproducible extraction from complex food matrices, which often contain interferents like polyphenols and fats [14].
Materials and Reagents
- Extraction Buffers:
- Equipment: Orbital incubator (e.g., Stuart SI500), centrifuge capable of cooling to 4°C, vortex mixer, analytical balance [14].
Step-by-Step Procedure
- Sample Preparation: Homogenize the food sample into a fine powder using a blender or mortar and pestle. Weigh 1.0 g (± 0.01 g) of the homogenized sample into a 15 mL centrifuge tube [14].
- Buffer Addition: Add 10 mL of the chosen pre-warmed extraction buffer (Buffer D or J) to achieve a 1:10 sample-to-buffer ratio [14].
- Extraction: Vortex the mixture vigorously for 30 seconds to ensure complete suspension. Incubate the sample in an orbital incubator at 60°C for 15 minutes with shaking at 175 rpm [14].
- Clarification: Centrifuge the samples at 1250 relative centrifugal force (rcf) for 20 minutes at 4°C [14].
- Supernatant Collection: Carefully collect the clarified supernatant from the middle of the tube, avoiding the pellet and any surface lipid layer. Store extracts at -80°C if not analyzed immediately [14].
Critical Notes
- The combination of fish gelatine (a protein blocker), PVP (a polyphenol binder), and 1 M NaCl (increases ionic strength) in Buffer J is particularly effective for challenging matrices like chocolate and thermally processed biscuits, helping to disrupt matrix interactions and solubilize allergens [14].
- Thermal processing (e.g., baking) and high-fat/protein matrices can significantly reduce allergen recovery. The use of incurred materials for method validation is strongly recommended [14].
Protocol 2: Assessing Platform Concordance for Allergen-Specific IgE
This protocol outlines a method for comparing the performance of a multiplex assay against a reference singleplex method for serum IgE detection.
Materials and Reagents
- Patient Sera: A minimum of 100 well-characterized serum samples is recommended to ensure statistical power. Samples should cover a range of specific IgE concentrations (negative, low, medium, high) [95] [31].
- Reference Assay: Established singleplex platform (e.g., ImmunoCAP) [95].
- Test Assay: Multiplex platform under evaluation (e.g., microarray, bead-based) [95] [31].
- Data Analysis Software: Statistical software capable of performing correlation coefficients, Cohen's Kappa, and intra-class correlation (e.g., IBM SPSS, R) [95].
Step-by-Step Procedure
- Blinded Testing: All serum samples should be aliquoted and coded to ensure blind analysis on both platforms. Analyze all samples according to the manufacturers' instructions for each platform within the same timeframe to minimize pre-analytical variability [95].
- Data Collection: For each sample and allergen, record the quantitative output (in kUₐ/L or ISU) and the corresponding semi-quantitative class (e.g., Class 0-6) [95].
- Qualitative Agreement Analysis:
- Calculate the Total Agreement Ratio: (Number of concordant positive results + Number of concordant negative results) / Total number of tests [95].
- Calculate Cohen's Kappa statistic to assess agreement beyond chance. Interpret Kappa as: <0.20 (Poor), 0.21-0.40 (Fair), 0.41-0.60 (Moderate), 0.61-0.80 (Substantial), 0.81-1.00 (Almost Perfect) [95].
- Quantitative Correlation Analysis:
- Perform Pearson's correlation analysis on the quantitative results for all paired allergens to assess the strength of the linear relationship [31].
- Calculate the Intra-class Correlation Coefficient (ICC) to evaluate absolute agreement and consistency between the two platforms. ICC values closer to 1 indicate better agreement [95] [7].
- Semi-Quantitative Analysis: Perform Gamma analysis to evaluate the association between the assigned IgE classes from the two platforms [95].
Protocol 3: Mitigation of Matrix Effects in Multiplex Assays
Matrix effects are a major source of interference in multiplex immunoassays, often leading to signal suppression or false positives [31]. The PC-PURE (Photocleavage-based Purification) method effectively mitigates this.
Materials and Reagents
- Photocleavable Capture Antibodies: Antibodies specific to the target biomarker (e.g., anti-IgE) conjugated to a photocleavable linker [31].
- UV Light Source: Controlled wavelength UV lamp (e.g., 365 nm) [31].
- Multiplex Detection Platform: Bead-based array (e.g., Luminex) or microarray pre-coated with relevant allergens [31].
Step-by-Step Procedure
- Capture: Incubate the patient serum sample with photocleavable capture antibodies to form specific antibody-biomarker complexes [31].
- Wash: Remove the sample matrix, including non-specifically bound proteins, lipids, and other interferents, through rigorous washing, leaving behind the purified complexes [31].
- Elution: Expose the complexes to a specific wavelength of UV light. This cleaves the linker, releasing the purified biomarker into a clean, compatible buffer [31].
- Detection: Analyze the eluent, now containing the purified and concentrated biomarkers, using the standard multiplex immunoassay protocol [31].
Critical Notes
- Implementing PC-PURE has been shown to dramatically improve agreement with gold-standard assays. In one study, correlation (Pearson r) with ImmunoCAP improved from 0.61 (without PC-PURE) to 0.90 (with PC-PURE), while sensitivity increased from 59% to 96% [31].
- Alternative strategies to reduce matrix effects include sample dilution and the use of blocking agents in the assay buffer [96].
Workflow Visualization
The following diagram illustrates the logical workflow for designing and executing a platform concordance study, from initial planning through data interpretation and decision-making.
Diagram 1: Workflow for platform concordance assessment.
The Scientist's Toolkit
Successful execution of the protocols requires key reagents and an understanding of their specific functions.
Table 2: Essential Research Reagent Solutions for Multiplex Allergen Analysis
| Item | Specific Function | Application Context |
|---|---|---|
| Fish Gelatine | Protein-based blocking agent that minimizes non-specific binding to surfaces and sample components [14]. | Food allergen extraction buffer additive [14]. |
| Polyvinylpyrrolidone (PVP) | Binds and neutralizes polyphenols (e.g., in chocolate), preventing their interference with protein detection [14]. | Food allergen extraction from matrices rich in polyphenols [14]. |
| Matched Antibody Pairs | A matched set of monoclonal or monoclonal/polyclonal antibodies that bind distinct epitopes on the same target protein [96]. | Critical for Sandwich ELISA and multiplex immunoassays for specific protein detection [97] [96]. |
| Photocleavable Capture Antibodies | Antibodies with a UV-cleavable linker that enable affinity purification of biomarkers away from the complex sample matrix [31]. | Mitigation of matrix effects in serum/plasma assays prior to multiplex detection [31]. |
| Allergen Components | Highly purified natural or recombinant allergenic proteins (e.g., Ara h 2, Bet v 1) [94] [64]. | Solid-phase coating for component-resolved diagnostics in multiplex microarrays [94] [64]. |
Assessment of Dynamic Range, Detection Limits, and Throughput
The accurate and simultaneous quantification of specific allergenic proteins is a cornerstone of modern food safety research and diagnostic development. The molecular heterogeneity of food allergens, compounded by the effects of food processing on protein structure and epitope availability, necessitates analytical techniques that are not only highly sensitive but also capable of multiplexing. This application note provides a detailed assessment of the dynamic range, detection limits, and throughput of two principal technological approaches: a novel, bead-based multiplex immunoassay (nELISA) and Liquid Chromatography-Tandem Mass Spectrometry (LC-MS/MS). The protocols and data herein are designed to guide researchers and scientists in selecting and implementing the optimal platform for their specific research on allergenic proteins.
Quantitative Platform Comparison
The following tables summarize the core performance metrics of the highlighted platforms, providing a basis for direct comparison.
Table 1: Key Performance Metrics for Allergen Detection Platforms
| Platform | Dynamic Range | Detection Limit | Throughput (Samples) | Multiplexing Capacity |
|---|---|---|---|---|
| nELISA (Bead-based Immunoassay) | 7 orders of magnitude [69] | Sub-picogram-per-milliliter sensitivity [69] | 1,536 wells per day (384-well format) [69] | High (e.g., 191-plex panel demonstrated) [69] |
| LC-MS/MS | Not explicitly stated | <1 mg/kg for specific food allergens [98] | Varies with method complexity | Moderate (e.g., 7-plex for food allergens demonstrated) [98] |
| Traditional ELISA | Limited [69] | ~0.1–5 mg/kg (but sensitive to processing) [99] | Low (single-plex) | Low (typically single-plex) [99] |
Table 2: Analysis of Technical Advantages and Challenges
| Platform | Key Advantages | Key Challenges |
|---|---|---|
| nELISA | Minimal reagent-driven cross-reactivity; cost-efficient; high-throughput; detects protein complexes and post-translational modifications [69] | Requires specific antibody pairs; platform-specific antibody validation needed [100] |
| LC-MS/MS | Robust to food processing that denatures conformational epitopes; inherently multiplexed; can detect specific peptide modifications [99] | High expertise required; expensive instrumentation; peptide-to-protein quantification assumptions [99] |
| Traditional ELISA | Mature, well-understood technology; high specificity; does not require specialized instrumentation [99] | Susceptible to epitope denaturation from processing; antibody cross-reactivity; difficult to multiplex [11] [99] |
Detailed Experimental Protocols
Protocol A: High-Plex nELISA for Protein Profiling
The nELISA platform combines a DNA-mediated sandwich immunoassay with advanced multicolor bead barcoding to achieve high-fidelity, high-plex protein detection [69].
A.1 Reagent and Material Preparation
- Barcoded Beads: Prepare or acquire microparticles spectrally barcoded using a method like emFRET, which employs varying ratios of four fluorophores (e.g., AlexaFluor 488, Cy3, Cy5, Cy5.5) to generate hundreds of unique signatures [69].
- CLAMP Assembly: Conjugate capture antibodies to the barcoded beads. Pre-assemble detection antibodies, which are tethered via flexible single-stranded DNA oligos, onto their corresponding capture beads. This spatial separation prevents noncognate interactions and eliminates reagent-driven cross-reactivity [69].
- Assay Buffer: Optimize buffer conditions to minimize interference between targets, which is critical for multiplex assay performance [100].
A.2 Experimental Workflow
- Sample Incubation: Pool the assembled CLAMP beads and dispense into a 384-well plate. Add protein samples or cell culture supernatants to the wells and incubate to allow target antigens to form ternary sandwich complexes on the beads [69].
- Wash: Remove unbound sample matrix to reduce background.
- Detection by Strand Displacement: Add a fluorescently labeled "displacer-oligo." This oligo simultaneously untethers the detection antibody from the bead surface via toehold-mediated strand displacement and labels it with a fluorophore. This step ensures signal is only generated when the target-bound sandwich complex is present [69].
- Wash: Remove untethered fluorescent probes.
- Flow Cytometric Analysis: Analyze the beads on a flow cytometer. The spectral barcode identifies the target protein, and the fluorescence intensity on the bead provides quantitative data [69].
A.3 Critical Steps for Optimization
- Antibody Validation: Antibodies must be validated for specificity in the multiplex format, as performance in singleplex ELISAs does not guarantee performance in multiplex [100].
- Voltage Optimization: Perform a "voltage walk" using dimly fluorescent beads on the flow cytometer to determine the minimum voltage requirement (MVR) for each detector, ensuring optimal resolution of dim signals from background noise [101].
- Fluorophore Selection: Pair bright fluorophores (e.g., PE, APC) with antibodies for low-abundance allergens and dimmer fluorophores for highly expressed targets to minimize spillover spreading [102].
Figure 1: nELISA workflow for high-plex protein detection.
Protocol B: LC-MS/MS for Allergen Detection in Processed Foods
LC-MS/MS offers a highly specific, multiplexable method that is robust to changes in protein conformation caused by food processing [99].
B.1 Reagent and Material Preparation
- Allergen Reference Materials: Source certified reference materials for the target allergenic proteins (e.g., from milk, egg, peanut, wheat).
- Digestion Buffers and Trypsin: Prepare buffers for reduction, alkylation, and enzymatic digestion. Trypsin is the most common enzyme used for cleaving proteins C-terminal to lysine and arginine [99].
- S-Trap Columns: Use these columns for efficient protein digestion and peptide cleanup, simplifying the traditionally complex sample preparation for LC-MS/MS [98].
- Synthetic Isotope-Labeled Peptide Standards: For absolute quantification, synthesize stable isotope-labeled versions of the proteotypic peptides as internal standards [99].
B.2 Experimental Workflow
- Protein Extraction: Extract proteins from the processed food matrix using a buffer suitable for solubilizing allergenic proteins, which may be insoluble due to processing [11].
- Protein Digestion: Denature, reduce, and alkylate the extracted proteins. Digest them into peptides using trypsin. The S-Trap column protocol can be used here to improve efficiency and recovery [98].
- Peptide Cleanup: Use an on-line automated solid-phase extraction (SPE) system to desalt and concentrate the peptide mixture, removing interfering compounds [98].
- LC-SRM/MS Analysis:
- Chromatography: Inject the peptides onto a reversed-phase LC column for separation.
- Mass Spectrometry: Utilize a triple quadrupole mass spectrometer in Selected Reaction Monitoring (SRM) mode. Predefine transitions (precursor ion → product ion) for proteotypic peptides of the target allergens. The instrument monitors these specific transitions, providing highly sensitive and specific quantification [99].
B.3 Critical Steps for Optimization
- Proteotypic Peptide Selection: Select peptides that are unique to the target allergen, readily ionizable, and consistently observed after digestion. Peptides should be robust to variations in food matrix and sample preparation. Public databases can assist in selection [99].
- Transition Validation: For each peptide, validate 3-5 high-intensity product ions. Confirm the retention time and ensure consistent peak area ratios between transitions to guarantee specificity [99].
- Scheduling: Use scheduled SRM to monitor transitions only during their specific elution windows, which increases the number of quantifiable peptides and reduces interference [99].
Figure 2: LC-MS/MS workflow for multiplex allergen detection.
The Scientist's Toolkit
Successful implementation of these protocols relies on key reagents and instruments.
Table 3: Essential Research Reagent Solutions
| Item | Function/Application | Key Considerations |
|---|---|---|
| Spectrally Barcoded Beads | Core of nELISA; enables multiplexing by assigning a spectral signature to each assay [69]. | Ensure compatibility with flow cytometer lasers and filters. |
| Matched Antibody Pairs | Form the basis of the sandwich immunoassay in nELISA [69]. | Must be highly specific and pre-validated for multiplexing to avoid cross-reactivity [100]. |
| Stable Isotope-Labeled Peptide Standards | Internal standards for absolute quantification by LC-MS/MS; corrects for sample loss and ionization variability [99]. | Must be chemically identical to the target analyte peptide. |
| S-Trap Columns | Streamlined sample preparation for LC-MS/MS; improve protein digestion and peptide recovery from complex matrices [98]. | Reduces protocol time and complexity compared to traditional methods. |
| Viability Dye | Flow cytometry control; identifies and allows for the exclusion of dead cells which can nonspecifically bind antibodies [101]. | Critical for accurate immunophenotyping in cell-based assays. |
| Compensation Beads | Flow cytometry control; used to set fluorescence compensation for multicolor panels [102]. | Essential for correcting spectral overlap between fluorophores. |
The choice between nELISA and LC-MS/MS for the quantification of allergenic proteins hinges on the specific research requirements. The nELISA platform offers superior throughput and lower operational complexity, making it ideal for large-scale screening studies where hundreds of samples need to be profiled against a extensive panel of targets. In contrast, LC-MS/MS provides exceptional specificity and is less affected by changes in protein conformation, making it particularly suitable for analyzing highly processed foods where epitopes may be damaged or masked. By leveraging the protocols and data presented in this application note, researchers can make an informed decision and implement a robust strategy for the simultaneous quantification of allergenic proteins, thereby advancing both food safety research and diagnostic development.
Guidelines for Platform Selection Based on Research Objectives and Sample Type
Multiplexed immunoassays have revolutionized the quantification of specific allergenic proteins, enabling researchers to simultaneously measure multiple targets from a single, often limited, sample volume. This capability is crucial for both comprehensive sensitization profiling and efficient risk assessment in food and environmental allergy research [103] [104]. Selecting the appropriate platform is a critical step that directly influences data quality, reliability, and translational impact. This application note provides a structured framework for platform selection based on specific research objectives, sample types, and technical requirements, contextualized within a broader thesis on multiplexed quantification of allergenic proteins.
Multiplex Immunoassay Platforms: A Comparative Analysis
Core Platform Technologies
Multiplex immunoassays are broadly categorized into planar arrays and suspension (microbead-based) arrays [105]. Planar arrays, such as traditional protein microarrays, immobilize capture antibodies at predefined positions on a flat surface. Suspension arrays, such as the Luminex xMAP technology, use color-coded magnetic or polystyrene microbeads as the solid phase, offering greater flexibility and faster reaction kinetics [6] [106]. Recent innovations like the "Lab-in-a-Tip" (LIT) system integrate microfluidic automation with self-assembled, high-density particle arrays to achieve exceptional sensitivity and throughput [106].
Quantitative Platform Comparison
The following table summarizes the key performance characteristics of major multiplex immunoassay platforms, providing a basis for objective comparison.
Table 1: Comparative Analysis of Multiplex Immunoassay Platforms
| Platform (Example) | Technology Type | Key Strengths | Key Limitations | Ideal Research Application |
|---|---|---|---|---|
| Luminex xMAP [6] | Suspension Array (Microbeads) | Wide dynamic range; Well-established; High plex capacity | Requires spectral calibration; Moderate sensitivity compared to newer platforms | High-throughput screening of known allergen panels in serum and food extracts |
| Meso Scale Discovery (MSD) [105] [7] | Planar Array (Electrochemiluminescence) | Widest dynamic range (105-106); High sensitivity; Low sample volume | Lower plex capacity than some suspension arrays | Quantification of low-abundance inflammatory cytokines or allergens in complex matrices |
| Digital ELISA [107] | Microfluidic / Digital Counting | Single-molecule sensitivity; Automated; Very low sample volume (20 µL) | Multiplexing can be complex; Specificity can be variable | Absolute quantification of extremely low-titer allergen-specific IgE |
| Lab-in-a-Tip (LIT) [106] | Microfluidic / Particle Array | Highest sensitivity (fg/mL); Fastest processing (15 min); Ultra-low sample volume (10 µL) | Emerging technology; Limited commercial allergen panels | Discovery-phase research with minimal sample volume or requirement for ultra-sensitive detection |
| ImmunoCAP ISAC [104] | Planar Array (Microarray) | Component-resolved diagnosis; Extensive validated allergen components | Semiquantitative in multiplex; High cost per test | Precise molecular IgE sensitization profiling for clinical correlation studies |
Selection Guidelines: Aligning Platform with Research Goals
The decision-making workflow for platform selection involves evaluating the primary research objective, sample characteristics, and practical constraints. The following diagram outlines this logical pathway.
Defining the Research Objective
- High-Throughput Screening: For studies requiring analysis of hundreds of samples for a defined set of allergens, platforms like Luminex xMAP and Meso Scale Discovery (MSD) are optimal. Their automation compatibility and robust performance make them suitable for epidemiological studies or food safety monitoring [105] [6].
- Biomarker Discovery: When the goal is unbiased profiling to identify novel protein signatures, platforms with high plex capacity like the NULISA (246-plex) are advantageous. The high multiplexing depth allows for a comprehensive survey of the proteome with minimal sample consumption [7].
- Ultra-Sensitive Quantification: For detecting very low-abundance allergens or specific IgE in challenging matrices, the highest sensitivity is critical. Digital ELISA and the Lab-in-a-Tip (LIT) system offer detection limits in the fg/mL to pg/mL range, providing a two-order-of-magnitude improvement over conventional platforms [107] [106].
- Component-Resolved Diagnosis (CRD): In clinical allergy research, identifying sensitization to specific allergenic molecules (e.g., Der p 1 vs. Der p 2) is essential. Microarray-based platforms like ImmunoCAP ISAC are specifically designed for this purpose, utilizing purified natural or recombinant allergen components [104].
Considering Sample Type and Practical Constraints
- Sample Volume: The required sample volume is a major practical constraint. While traditional platforms like Luminex may need 50-100 µL, newer technologies like Digital ELISA and LIT can perform multiplexed analyses with only 10-20 µL of serum, making them indispensable for pediatric studies or when working with precious biobank samples [107] [106].
- Sample Matrix: Complex matrices like stratum corneum tape strip (SCTS) extracts or processed food present challenges due to low protein yield and potential interferents. Studies have shown that MSD demonstrates superior sensitivity in these contexts, detecting 70% of proteins in SCTS samples compared to 30% for NULISA and 16.7% for Olink [7].
- Throughput and Cost: The number of samples and targets per sample directly impacts cost and timeline. Suspension arrays like Luminex offer a favorable balance of cost and throughput for large studies, while low-plex planar arrays or automated microfluidic systems provide rapid, cost-effective solutions for focused questions [105] [106].
Detailed Experimental Protocol: Allergen-Specific IgE Profiling Using a Multiplex Bead-Based Array
This protocol outlines the steps for simultaneously quantifying serum IgE against major allergenic proteins (e.g., Der p 1, Der p 2, Der p 23) using a fluorescent, magnetic bead-based multiplex immunoassay, based on the method described by Filep et al. [6].
Research Reagent Solutions
Table 2: Essential Materials and Reagents
| Item | Function / Description | Example / Specification |
|---|---|---|
| Allergen-Coupled Magnetic Beads | Solid phase for allergen-specific IgE capture | Magnetic polystyrene beads (6.5 µm) covalently coupled with purified recombinant allergens (e.g., Der p 1, Der p 2) |
| Biotinylated Detection Antibody | Detection of captured IgE | Mouse anti-human IgE, biotin-conjugated monoclonal antibody |
| Fluorophore-Conjugated Reporter | Signal generation and amplification | Streptavidin-Phycoerythrin (SAPE) |
| Assay Buffer | Matrix for dilutions and washing | PBS containing carrier proteins and blockers to reduce non-specific binding |
| Reference Standards & Controls | Calibration and quality control | Serial dilutions of human IgE isotype control; Positive and negative human serum controls |
| Magnetic Separator | Bead washing and separation | A 96-well plate magnetic separation device |
| Luminex Analyzer | Data acquisition | Instrument capable of exciting internal bead fluorophores (for bead ID) and PE (for signal quantification) |
Step-by-Step Workflow
The entire procedure, from bead preparation to data analysis, is visualized in the following workflow diagram.
- Bead Preparation: Vortex and sonicate the stock suspension of allergen-coupled magnetic beads. Prepare a working bead mixture by combining precise volumes of each bead set in an appropriate assay buffer. Aliquot the bead mixture into each well of a 96-well microtiter plate.
- Sample and Standard Incubation: Wash the beads twice using a magnetic separator. Prepare a serial dilution of the IgE reference standard to generate a calibration curve. Dilute test serum samples as required. Add standards, controls, and samples to the plate. Seal the plate and incubate with shaking for 2-3 hours at room temperature to allow allergen-specific IgE to bind.
- Detection Antibody Incubation: After incubation, wash the beads twice to remove unbound serum proteins. Add the biotinylated anti-human IgE detection antibody to each well. Seal the plate and incubate with shaking for 1 hour at room temperature.
- Reporter Incubation: Wash the beads twice to remove excess detection antibody. Add the Streptavidin-Phycoerythrin (SAPE) reporter solution to each well. Seal the plate and incubate with shaking for 30 minutes in the dark.
- Data Acquisition: Perform a final set of washes to remove unbound reporter. Resuspend the beads in a reading buffer. Analyze the plate on a Luminex analyzer. The instrument identifies each bead by its internal fluorescent code and quantifies the bound IgE by measuring the PE fluorescence intensity (Median Fluorescence Intensity, MFI).
- Data Analysis: Use the software to generate a 5-parameter logistic (5-PL) standard curve from the reference standard data. Interpolate the concentration of allergen-specific IgE in each sample from the standard curve. Results are typically reported in kilo-international units per liter (kIU/L).
The selection of a multiplex immunoassay platform is a strategic decision that should be primarily driven by the research question, followed by practical considerations of sample availability and operational requirements. No single platform is superior in all aspects; rather, each offers a unique set of advantages. Suspension arrays provide a robust balance for high-throughput applications, while emerging microfluidic and digital technologies push the boundaries of sensitivity and speed. By applying the structured guidelines and protocols presented here, researchers can make an informed choice that ensures the generation of high-quality, reliable data for the simultaneous quantification of specific allergenic proteins.
Conclusion
Multiplexed immunoassays represent a paradigm shift in the quantification of allergenic proteins, moving beyond traditional methods to enable a comprehensive, component-resolved view of sensitization profiles. The integration of CRD with platforms like Luminex and MSD has proven invaluable for precise risk stratification, particularly in predicting severe reactions to foods like peanut, milk, and egg. While challenges such as assay interference and complex sample matrices require diligent optimization, the benefits of improved experimental efficiency, conserved sample volume, and rich data output are undeniable. Future directions point toward the increased integration of artificial intelligence for data analysis and biomarker prediction, the development of even more sensitive and expansive panels, and the broader implementation of these technologies in personalized medicine and clinical trial frameworks to create tailored management plans for allergic patients, ultimately reducing the global burden of anaphylaxis.
References
- 1. Component-Resolved Diagnosis in Food Allergies - PMC [https://pmc.ncbi.nlm.nih.gov/articles/PMC6723663/]
- 2. Recent advances in component resolved diagnosis in food ... [https://www.sciencedirect.com/science/article/pii/S1323893016301010]
- 3. Component-Resolved and Multiplex-Specific IgE Diagnostics [https://www.mdpi.com/2227-9067/12/7/933]
- 4. Component-resolved diagnosis [https://www.bsaci.org/resources/allergy-management/food-allergy/investigations/component-resolved-diagnosis/]
- 5. Molecular allergy diagnostics using multiplex assays [https://pmc.ncbi.nlm.nih.gov/articles/PMC4792369/]
- 6. Simultaneous quantification of specific food allergen ... [https://www.sciencedirect.com/science/article/abs/pii/S0308814622009487]
- 7. Comparison of three multiplex immunoassays for ... [https://www.nature.com/articles/s41598-025-23579-7]
- 8. Innovations shaping the future of food allergen testing [https://allergenbureau.net/innovations-shaping-the-future-of-food-allergen-testing/]
- 9. Multiplex Lateral Flow Immunoassay: An Overview of ... [https://pmc.ncbi.nlm.nih.gov/articles/PMC6468474/]
- 10. Editorial: Prediction of severity of food allergy [https://www.frontiersin.org/journals/allergy/articles/10.3389/falgy.2025.1717271/full]
- 11. Detection of Allergenic Proteins in Foodstuffs: Advantages ... [https://pmc.ncbi.nlm.nih.gov/articles/PMC8949930/]
- 12. ELISA in the multiplex era: Potentials and pitfalls - PMC [https://pmc.ncbi.nlm.nih.gov/articles/PMC6680274/]
- 13. Monoplex and multiplex immunoassays [https://pmc.ncbi.nlm.nih.gov/articles/PMC8605475/]
- 14. Optimising Extraction of Specific Food Allergens from ... [https://pmc.ncbi.nlm.nih.gov/articles/PMC12563046/]
- 15. A multiplex immunoassay gives different results than ... [https://www.sciencedirect.com/science/article/abs/pii/S0009912012001725]
- 16. Multiplexed protein measurement: technologies and ... [https://pmc.ncbi.nlm.nih.gov/articles/PMC1780251/]
- 17. What is multiplex qPCR? [https://www.thermofisher.com/us/en/home/life-science/pcr/real-time-pcr/real-time-pcr-learning-center/real-time-pcr-basics/what-is-multiplex-qpcr.html]
- 18. A Multiplex Immunoassay Method for Simultaneous ... [https://pmc.ncbi.nlm.nih.gov/articles/PMC4272301/]
- 19. Multiplexed bead-based assay for the simultaneous ... [https://www.frontiersin.org/journals/immunology/articles/10.3389/fimmu.2023.1190404/full]
- 20. Multiplex IgE peanut panels: a critical appraisal of assay ... [https://www.frontiersin.org/journals/allergy/articles/10.3389/falgy.2025.1515294/full]
- 21. Normalization and Statistical Analysis of Multiplexed Bead- ... [https://pmc.ncbi.nlm.nih.gov/articles/PMC3536905/]
- 22. Multiplex Immunoassay Protocol [https://www.creative-diagnostics.com/multiplex-immunoassay-protocol.htm]
- 23. A stepwise guide to navigating multiplex immunoassay ... [https://olink.com/blog/a-stepwise-guide-to-navigating-multiplex-immunoassay-data-analysis]
- 24. Optimizing experimental efficiency with multiplex ... [https://www.revvity.com/blog/optimizing-experimental-efficiency-multiplex-immunoassays]
- 25. Multiplexing Immunoassays: Technical Considerations for ... [https://www.drugdiscoverytrends.com/multiplexing-immunoassays-technical-considerations-for-optimal-performance/]
- 26. Multiplex Immunoassays: Five Tips for Optimizing Your ... [https://www.bioradiations.com/multiplex-immunoassays-five-tips-for-optimizing-your-experiments/]
- 27. To conserve on sample volume, can you use 25 µl of ... [https://www.mesoscale.com/en/support/faqs/search_faq/to_conserve_on_sample_volume_can_you_use_25_ul_of_sample_in_the_validated/]
- 28. IgE epitope proximity determines immune complex shape and ... [https://pmc.ncbi.nlm.nih.gov/articles/PMC4890651/]
- 29. Cross-reactive epitopes and their role in food allergy [https://www.sciencedirect.com/science/article/pii/S0091674923001483]
- 30. Novel Bead-Based Epitope Assay is a sensitive and ... [https://www.nature.com/articles/s41598-019-54868-7]
- 31. Application to multiplex allergy testing | PLOS One [https://journals.plos.org/plosone/article?id=10.1371/journal.pone.0191987]
- 32. The updated Structural Database of Allergenic Proteins ... [https://www.sciencedirect.com/science/article/pii/S2772829323000875]
- 33. A database for allergenic proteins and tools ... [https://pmc.ncbi.nlm.nih.gov/articles/PMC2720674/]
- 34. Multi-laboratory validation of the xMAP—Food Allergen ... [https://pmc.ncbi.nlm.nih.gov/articles/PMC7347184/]
- 35. Diagnostic characterization of respiratory allergies by ... [https://pmc.ncbi.nlm.nih.gov/articles/PMC7806420/]
- 36. Insights from Olink Inflammation Profiling - PubMed Central [https://pmc.ncbi.nlm.nih.gov/articles/PMC12083496/]
- 37. Exploring proteomic plasma biomarkers in eosinophilic ... [https://olink.com/publication/exploring-proteomic-plasma-biomarkers-in-eosinophilic-and-neutrophilic-asthma]
- 38. NULISA™ Platform | Immunoassay Analyzers [https://alamarbio.com/technology/nulisa-platform/]
- 39. NULISA Assays for Immunology | Immunoassay Kits [https://alamarbio.com/products-and-services/nulisa-assays-for-immunology/]
- 40. Allergin-1 - Olink Explore Inflammation [https://olink.com/assay/explore/inflammation/allergin-1]
- 41. Guide to Multiplex Immunoassays: Multiplex ELISA and More [https://www.thermofisher.com/blog/life-in-the-lab/guide-to-multiplex-immunoassays-multiplex-elisa-and-more/]
- 42. Advances and highlights in biomarkers of allergic diseases [https://pmc.ncbi.nlm.nih.gov/articles/PMC9292545/]
- 43. Biomarker-driven drug development for allergic diseases ... [https://www.sciencedirect.com/science/article/pii/S009167492500329X]
- 44. Validation of a multiplexed immunoassay for ... [https://www.nature.com/articles/s41541-024-01039-z]
- 45. f423 Ara h 2 [https://www.thermofisher.com/phadia/us/en/resources/allergen-encyclopedia/f13/f423.html]
- 46. Clinical thresholds to egg, hazelnut, milk and peanut [https://www.sciencedirect.com/science/article/abs/pii/S1081120612001858]
- 47. The Natural History and Risk Factors for the Development ... [https://pmc.ncbi.nlm.nih.gov/articles/PMC10960768/]
- 48. Simultaneous quantification of multiple specific food allergen ... [https://pmc.ncbi.nlm.nih.gov/articles/PMC4412718/]
- 49. Multiplex enzyme immunoassay system for the ... [https://www.sciencedirect.com/science/article/abs/pii/S0956713502000531]
- 50. Immunologic Features of Infants with Milk or Egg Allergy ... [https://pmc.ncbi.nlm.nih.gov/articles/PMC2868273/]
- 51. Allergen immunotherapy: an updated review of safety - PMC [https://pmc.ncbi.nlm.nih.gov/articles/PMC5644500/]
- 52. Systemic reactions to subcutaneous allergen immunotherapy [https://aacijournal.biomedcentral.com/articles/10.1186/s13223-021-00566-x]
- 53. The Importance of Cytokine Detection and Analysis [https://www.bioagilytix.com/blog/the-importance-of-cytokine-detection-and-analysis/]
- 54. Emerging principles of cytokine pharmacology and therapeutics [https://pmc.ncbi.nlm.nih.gov/articles/PMC10292932/]
- 55. Simplified flow cytometry-based assay for rapid multi-cytokine ... [https://pmc.ncbi.nlm.nih.gov/articles/PMC12245854/]
- 56. Cytokine Analysis in Cell Culture and Research Applications [https://cytokine.creative-proteomics.com/cytokine-analysis-cell-culture-research.htm]
- 57. Scientists unlock potential of cytokine adjuvants in mRNA ... [https://www.news-medical.net/news/20250606/Scientists-unlock-potential-of-cytokine-adjuvants-in-mRNA-vaccines.aspx]
- 58. Precision Adjuvant Strategies in Vaccine Development for ... [https://pubmed.ncbi.nlm.nih.gov/41012558/]
- 59. Modulation of neuroimmune cytokine networks by ... [https://www.nature.com/articles/s41398-025-03532-y]
- 60. Rise in Antibody Interference Post-COVID [https://www.meridianbioscience.com/lifescience-blog/rise-in-antibody-interference-post-covid-impacts-on-diagnostic-assay-developers/]
- 61. heterophilic antibody interference in the serum tryptase assay [https://pmc.ncbi.nlm.nih.gov/articles/PMC3048617/]
- 62. Luminex HP Assays: Overcoming Multiplexing Challenges [https://www.rndsystems.com/blog/luminex-hp-assays-101-overcoming-multiplexing-challenges]
- 63. Reducing Errors in Immunoassay Testing [https://www.genengnews.com/insights/reducing-errors-in-immunoassay-testing/]
- 64. Evolution Toward Chip-Based Arrays in the Laboratory ... [https://www.sciencedirect.com/science/article/abs/pii/S2213219823009212]
- 65. Characterization of a multiplex, 12-biomarker test for ... [https://www.sciencedirect.com/science/article/pii/S0731708512003354]
- 66. Nonspecific Binding: Main Factors of Occurrence and ... [https://dmpkservice.wuxiapptec.com/articles/44-nonspecific-binding-main-factors-of-occurrence-and-strategies/]
- 67. Overcoming Matrix Interference in Plate-Based ... [https://swordbio.com/blog/overcoming-matrix-interference-in-plate-based-immunoassays/]
- 68. A Portable High-Sensitivity Multiplex Platform with ... [https://www.sciencedirect.com/science/article/abs/pii/S0956566325009479]
- 69. nELISA: a high-throughput, high-plex platform enables ... [https://www.nature.com/articles/s41592-025-02861-6]
- 70. Simplify your assay design with our matched antibody pairs [https://www.abcam.com/en-us/stories/articles/simplify-your-assay-design-with-our-matched-antibody-pairs]
- 71. Immunoassay Methods - Assay Guidance Manual - NCBI - NIH [https://www.ncbi.nlm.nih.gov/books/NBK92434/]
- 72. 5 Essential Steps to Optimize Immunoassay Performance [https://www.antibodiesinc.com/blogs/news/5-essential-steps-optimize-immunoassay-performance?srsltid=AfmBOory2V6iLH2n993ZmL-ZrKfu1PNGBp4e0l5P4k4sg49oQxGEEYtF]
- 73. Key Factors in Sample Diluent Selection for HPLC Assays ... [https://www.chromatographyonline.com/view/key-factors-sample-diluent-selection-hplc-assays-active-pharmaceutical-ingredients]
- 74. Optimizing Sensitivity in Antibody-Based Immunoassays [https://www.genscript.com/optimizing-sensitivity-in-antibody-based-immunoassays.html]
- 75. A Practical Guide to Immunoassay Method Validation - PMC [https://pmc.ncbi.nlm.nih.gov/articles/PMC4541289/]
- 76. The Hook | myadlm.org Effect [https://myadlm.org/science-and-research/clinical-chemistry/clinical-chemistry-trainee-council/pearls-of-laboratory-medicine-in-english/2014/the-hook-effect]
- 77. - Wikipedia Hook effect [https://en.wikipedia.org/wiki/Hook_effect]
- 78. Unraveling the Hook : A Comprehensive Study of High Antigen... Effect [https://pmc.ncbi.nlm.nih.gov/articles/PMC7711776/]
- 79. Streamlining the analytical workflow for multiplex MS/ ... [https://www.sciencedirect.com/science/article/abs/pii/S0308814616317885]
- 80. Occurrence and potential implications of the hook a Borrelia... effect in [https://link.springer.com/article/10.1007/s10096-025-05172-y]
- 81. Highly Sensitive Digital and Analog Immunoassay Based ... [https://pubmed.ncbi.nlm.nih.gov/39846957/]
- 82. Quantifying allergenic using antibody-based methods or... proteins [https://pubmed.ncbi.nlm.nih.gov/39379311/]
- 83. The Evolution of Multiplex Immunoassay Technologies [https://olink.com/blog/the-evolution-of-multiplex-immunoassay-technologies]
- 84. Accuracy, precision, specificity & sensitivity [https://labtestsonline.org.uk/articles/accuracy-precision-specificity-sensitivity]
- 85. Simple Definition and Calculation of Accuracy, Sensitivity ... [https://pmc.ncbi.nlm.nih.gov/articles/PMC4614595/]
- 86. A Practical Guide to Immunoassay Method Validation [https://www.frontiersin.org/journals/neurology/articles/10.3389/fneur.2015.00179/full]
- 87. Diagnostic Testing Accuracy: Sensitivity, Specificity, Predictive ... [https://www.ncbi.nlm.nih.gov/books/NBK557491/]
- 88. Sensitivity and specificity [https://en.wikipedia.org/wiki/Sensitivity_and_specificity]
- 89. Optimising Extraction of Specific Food Allergens from ... [https://www.mdpi.com/2304-8158/14/20/3501]
- 90. NULISA: a proteomic liquid biopsy platform with attomolar ... [https://www.nature.com/articles/s41467-023-42834-x]
- 91. Olink cytokine panel comparison: ELISA, Luminex, MSD ... [https://olinkpanel.creative-proteomics.com/knowledge/olink-cytokine-panel-vs-other-methods.html]
- 92. Comparison of multiplexed protein analysis platforms for ... [https://pmc.ncbi.nlm.nih.gov/articles/PMC10715563/]
- 93. Olink Proteomics [https://www.precisionformedicine.com/specialty-lab-services/cytokine-and-protein-analysis/olink-proteomics]
- 94. The use of microarray and other multiplex technologies in ... [https://pmc.ncbi.nlm.nih.gov/articles/PMC9107268/]
- 95. Comparison of the ImmunoCAP Assay and AdvanSure™ ... [https://pmc.ncbi.nlm.nih.gov/articles/PMC5447110/]
- 96. Assay Setup: Sandwich ELISA for Allergy [https://www.jacksonimmuno.com/secondary-antibody-resource/immuno-techniques/sandwich-elisa/]
- 97. Development of sandwich and competitive ELISA formats ... [https://www.sciencedirect.com/science/article/abs/pii/S0956713519301343]
- 98. Development of a rapid and reliable method to ... [https://www.sciencedirect.com/science/article/pii/S2590157524004462]
- 99. Food allergen detection by mass spectrometry: the role of ... [https://www.nature.com/articles/npjsba201622]
- 100. Multiplex Detection Immunoassay Market Size & Growth ... [https://www.persistencemarketresearch.com/market-research/multiplex-detection-immunoassay-market.asp]
- 101. Best Practices for Multiparametric Flow Cytometry [https://www.thermofisher.com/us/en/home/references/newsletters-and-journals/bioprobes-journal-of-cell-biology-applications/bioprobes-79/best-practices-multiparametric-flow-cytometry.html]
- 102. Designing a multicolor flow cytometry panel [https://www.abcam.co.jp/primary-antibodies/multicolor-flow-cytometry-panel-design]
- 103. Food Allergenicity Evaluation Methods: Classification, ... [https://pmc.ncbi.nlm.nih.gov/articles/PMC12191692/]
- 104. Precision medicine allergy immunoassay methods for ... [https://pmc.ncbi.nlm.nih.gov/articles/PMC6275558/]
- 105. Comparison of Multiplex Immunoassay Platforms - PMC [https://pmc.ncbi.nlm.nih.gov/articles/PMC2905867/]
- 106. Lab-in-a-Tip: a multiplex immunoassay platform based on ... [https://www.nature.com/articles/s41467-025-59390-1]
- 107. A digital ELISA for multiplexed detection of allergen‐ ... [https://pmc.ncbi.nlm.nih.gov/articles/PMC12617554/]