Immunoassays vs. Mass Spectrometry for Protein Quantification: A Comprehensive Guide for Researchers
Accurate protein quantification is a cornerstone of biomedical research and therapeutic development.
Immunoassays vs. Mass Spectrometry for Protein Quantification: A Comprehensive Guide for Researchers
Abstract
Accurate protein quantification is a cornerstone of biomedical research and therapeutic development. This article provides a systematic comparison of immunoassay and mass spectrometry (MS) methodologies, addressing the critical need for informed selection between these technologies. We explore foundational principles, from established ELISA workflows to advanced MS techniques like narrow-window DIA. The content covers diverse applications across clinical diagnostics, biopharmaceuticals, and agricultural biotechnology, alongside troubleshooting for cross-reactivity and sensitivity challenges. By presenting validation frameworks and comparative performance data from recent studies, this review synthesizes key decision factors—including specificity, throughput, multiplexing capability, and cost—to guide researchers in optimizing protein quantification strategies for their specific scientific and regulatory contexts.
Core Principles: Understanding Immunoassay and Mass Spectrometry Fundamentals
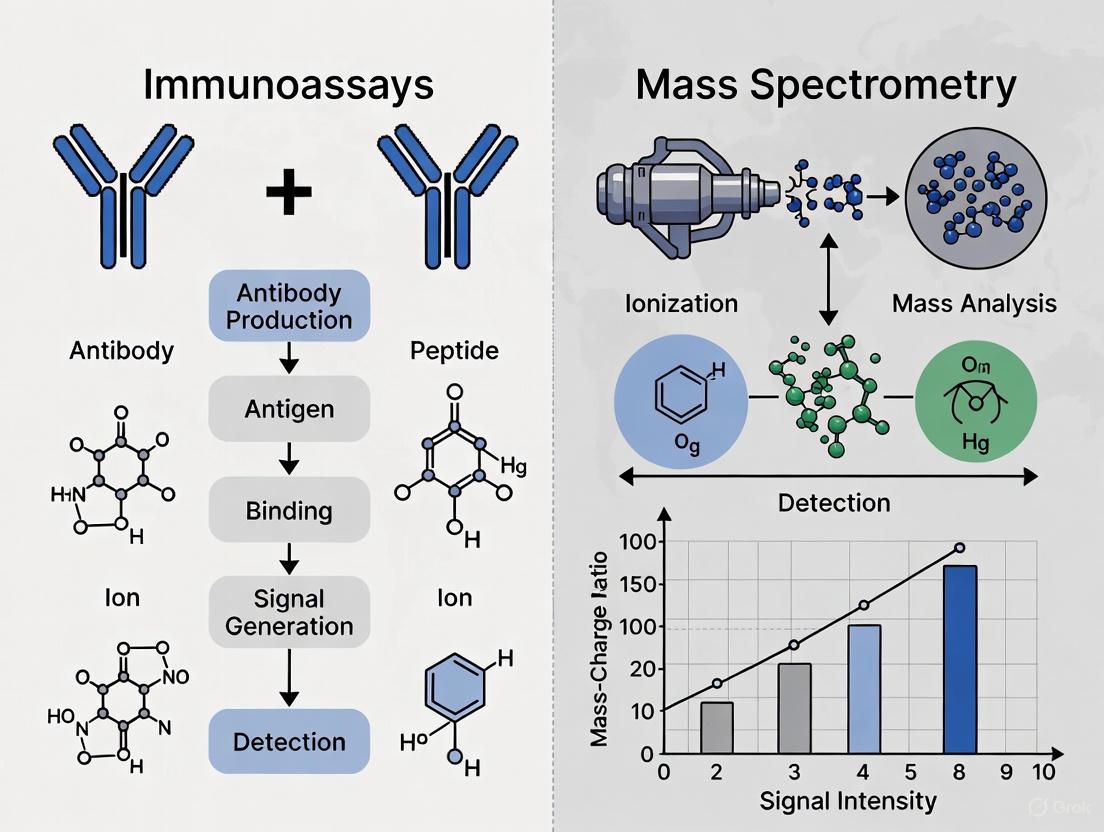
The accurate quantification of specific proteins is a cornerstone of biological research and clinical diagnostics. Within this landscape, immunoassay technologies have evolved significantly, creating a paradigm that ranges from traditional Enzyme-Linked Immunosorbent Assays (ELISA) to sophisticated modern multiplex platforms. This evolution responds to growing demands for higher throughput, increased sensitivity, and the ability to analyze multiple biomarkers simultaneously from limited sample volumes.
The fundamental principle underlying all immunoassays remains the specific binding between an antigen and its corresponding antibody, with detection achieved through various signaling mechanisms. While traditional ELISA has maintained its status as the gold standard for single-analyte detection for decades, multiplex immunoassays have emerged as powerful alternatives capable of measuring dozens of analytes simultaneously in a single sample [1]. Concurrently, mass spectrometry has developed as a complementary technology offering unique advantages for protein identification and quantification, particularly in scenarios requiring high specificity or the detection of proteoforms [2] [3].
This guide provides an objective comparison of these technologies, focusing on their performance characteristics, applications, and appropriate use cases within protein quantification research. By presenting structured experimental data and methodological details, we aim to equip researchers, scientists, and drug development professionals with the information necessary to select optimal platforms for their specific research requirements.
Fundamental Techniques and Principles
ELISA operates through several configurations including direct, indirect, sandwich, and competitive formats, each tailored for specific research needs [1]. The common element involves immobilizing antigens or antibodies on a solid surface, followed by sequential binding and enzymatic reaction steps that generate a measurable signal, typically through colorimetric changes.
Multiplex immunoassays expand this concept through two primary formats: planar arrays featuring capture antibodies immobilized on two-dimensional surfaces, and suspension microsphere assays utilizing fluorophore-coded beads analyzed via flow cytometry [1]. These platforms maintain the core immunoassay principle while incorporating advanced detection systems that enable parallel analyte measurement.
Mass spectrometry-based proteomics, particularly liquid chromatography-tandem mass spectrometry (LC-MS/MS), operates on fundamentally different principles, separating and identifying proteins based on their mass-to-charge ratios after enzymatic digestion into peptides [2]. This bottom-up approach allows for protein identification and quantification without reliance on specific antibodies, though it requires extensive sample preparation and computational analysis.
Comprehensive Performance Comparison
Table 1: Technical comparison of ELISA, multiplex immunoassays, and mass spectrometry-based proteomics
| Performance Characteristic | ELISA | Multiplex Immunoassays | Mass Spectrometry |
|---|---|---|---|
| Detection Capacity | Single analyte per assay [1] | Multiple analytes simultaneously (varies by platform) [1] | Thousands of proteins in discovery mode; targeted for specific proteins [2] |
| Sample Volume Requirements | Higher (separate assays for multiple analytes) [1] | Lower (single sample for multiple analytes) [1] | Moderate to high, depending on preparation method [2] |
| Sensitivity | High for individual analytes [1] | Variable; may be lower for some analytes [1] | Moderate; limited by dynamic range issues [2] [4] |
| Specificity | Very high with minimal cross-reactivity [1] | Moderate; potential for cross-reactivity [1] | High; based on mass identification [4] |
| Dynamic Range | Limited to few orders of magnitude [5] | Broader than ELISA (up to 5 orders) [5] | Limited by signal interference from high-abundance proteins [2] [4] |
| Throughput | Low for multiple analytes [1] | High for multi-analyte detection [1] | Moderate; improved with targeted methods [4] |
| Quantitative Accuracy | High and reliable [1] | Variable depending on platform and optimization [1] | Good with labeled methods; affected by peptide competition [4] |
| Equipment Costs | Lower (standard laboratory equipment) [1] | Higher (specialized instrumentation) [1] | High (expensive instrumentation and maintenance) [2] [4] |
| Ease of Use | Straightforward with well-established protocols [1] | Complex; requires technical expertise [1] | Complex; requires specialized training [2] |
| Data Complexity | Simple analysis against standard curves [1] | Complex; requires specialized software [1] | Highly complex; requires bioinformatics expertise [2] |
Figure 1: Technology selection guide based on research objectives. Each platform offers distinct advantages for different experimental needs.
Experimental Data and Comparative Studies
Direct Platform Comparisons in Biomarker Analysis
Recent studies have provided robust comparative data on the performance of these technologies in practical research scenarios. A 2019 investigation comparing commercial ELISA kits with two prototype multiplex array platforms for bladder cancer biomarker detection revealed important performance differences, shown in Table 2 [6].
Table 2: Performance comparison of ELISA and multiplex platforms for bladder cancer biomarker detection (adapted from [6])
| Parameter | Commercial ELISA | Multiplex Electrochemoluminescent Assay (MEA) | Multiplex Bead-Based Assay (MBA) |
|---|---|---|---|
| Detection Range | Variable by analyte | Generally improved range across analytes | Generally improved range across analytes |
| Lower Limit of Quantification (LLOQ) | Typically lower | Higher for most analytes | Higher for most analytes |
| Coefficient of Variation (CV) | Lower (e.g., 2.85% for IL-8) | Moderate (e.g., 3.65% for IL-8) | Moderate (e.g., 3.58% for IL-8) |
| AUROC (10-biomarker panel) | Not reported | 0.86 | 0.97 |
| Sensitivity | Not reported | 0.85 | 0.93 |
| Specificity | Not reported | 0.80 | 0.95 |
| Diagnostic Accuracy | Not reported | 0.83 | 0.94 |
In a separate comparative assessment of coronavirus IgG quantitation, the Meso Scale Discovery (MSD) multiplex assay demonstrated superior dynamic range and sensitivity compared to the VaxArray platform, though both met accuracy (100 ± 20%) and precision (%CV < 25%) criteria [7]. The MSD assay also showed marginally higher clinical sensitivity and specificity, while VaxArray offered advantages in total assay time and multiplexing potential [7].
For Alzheimer's disease biomarker analysis, a 2025 study comparing three immunoassays and one LC-MS/MS assay for cerebrospinal fluid biomarkers found that all four assays demonstrated favorable agreement but with significant absolute differences [8]. Fully automated immunoassays (Lumipulse G and Elecsys) showed better analytical and diagnostic performance compared to manual ELISA, with LC-MS/MS and Lumipulse G performing best when combining all biomarkers for amyloid PET status discrimination [8].
Methodological Protocols
Standard ELISA Protocol:
- Coating: Immobilize capture antibody onto microplate wells overnight at 4°C
- Blocking: Add blocking buffer (e.g., BSA or non-fat milk) to prevent non-specific binding
- Sample Incubation: Add samples and standards, incubate for 1-2 hours at room temperature
- Detection Antibody: Add biotinylated or enzyme-conjugated detection antibody
- Enzyme Reaction: Add substrate solution for color development
- Signal Measurement: Measure absorbance using plate reader [1]
Multiplex Bead-Based Assay Protocol:
- Bead Preparation: Mix antibody-conjugated fluorescent-coded beads
- Incubation: Add samples/standards to beads and incubate with shaking
- Detection: Add fluorescently-labeled detection antibodies
- Washing: Remove unbound detection antibodies
- Analysis: Measure fluorescence using flow-based instrumentation [5] [6]
LC-MS/MS Proteomics Workflow:
- Protein Extraction: Isolate proteins from biological samples
- Digestion: Cleave proteins into peptides using trypsin
- Separation: Fractionate peptides using liquid chromatography
- Ionization: Convert peptides to gas-phase ions via electrospray ionization
- Mass Analysis: Separate ions by mass-to-charge ratio in mass analyzer
- Fragmentation: Collide selected ions to generate sequence information
- Data Analysis: Match spectra to databases for protein identification [2] [9]
Figure 2: Comparative workflow diagram showing common steps (gray) and technology-specific procedures for ELISA (yellow), multiplex assays (green), and mass spectrometry (blue).
Essential Research Reagent Solutions
Successful implementation of protein quantification technologies requires appropriate selection of research reagents and materials. The following table outlines key solutions essential for conducting experiments across these platforms.
Table 3: Essential research reagent solutions for protein quantification technologies
| Reagent Category | Specific Examples | Function and Importance | Technology Application |
|---|---|---|---|
| Capture Molecules | Monoclonal/polyclonal antibodies, recombinant binders | Target-specific binding for immunoassay detection | ELISA, Multiplex Immunoassays |
| Detection Labels | Enzyme conjugates (HRP, AP), fluorophores (FITC, PE), electrochemiluminescent tags | Signal generation for quantification | ELISA (colorimetric), Multiplex (fluorescent/ECL) |
| Sepparation Media | Chromatography columns (reverse-phase, ion exchange), magnetic beads | Fractionation and purification of analytes | Mass spectrometry, bead-based multiplex |
| Sample Preparation Reagents | Digestion enzymes (trypsin), reduction/alkylation agents (DTT, iodoacetamide), protein extraction buffers | Protein solubilization, denaturation, and digestion | Mass spectrometry (essential), all platforms |
| Reference Standards | Isotope-labeled peptides, recombinant proteins, certified reference materials | Quantification calibration and quality control | Mass spectrometry (crucial), all platforms (important) |
| Signal Substrates | TMB, OPD, ECL substrates, amplified detection systems | Convert enzyme activity to detectable signal | ELISA (colorimetric), multiplex (chemiluminescent) |
| Plate and Surface Materials | High-binding polystyrene plates, functionalized glass slides, magnetic bead sets | Solid support for immobilization | ELISA (plates), multiplex (beads/planar arrays) |
The immunoassay paradigm continues to evolve, with each technology platform offering distinct advantages for specific research scenarios. Traditional ELISA maintains its position as the gold standard for single-analyte quantification due to its reliability, simplicity, and cost-effectiveness [1]. Multiplex platforms provide clear advantages in comprehensive biomarker profiling and studies where sample volume is limited, despite requiring more sophisticated instrumentation and data analysis capabilities [5] [6]. Mass spectrometry offers unique strengths in discovery proteomics, detection of proteoforms, and scenarios where antibody availability is limited, though it faces challenges in dynamic range and accessibility [2] [4].
The choice between these technologies ultimately depends on specific research requirements, including the number of targets, sample availability, required sensitivity and dynamic range, and available resources. As evidenced by comparative studies, fully automated immunoassay platforms are increasingly matching or exceeding the performance of traditional ELISA while providing enhanced throughput [8]. Meanwhile, advanced mass spectrometry methods continue to improve in sensitivity and applicability for challenging protein quantification tasks [9] [3].
Researchers should consider these performance characteristics, methodological requirements, and practical constraints when selecting the most appropriate technology for their specific protein quantification needs. The continued evolution of all these platforms promises even greater capabilities for protein analysis in research and clinical applications.
Mass spectrometry (MS) has become a cornerstone of modern proteomics, enabling the precise identification and quantification of proteins within complex biological systems. The selection of an appropriate MS workflow is a critical decision that directly impacts the accuracy, depth, and throughput of protein quantification in research and drug development. These methodologies are broadly categorized into three main strategies: label-free, label-based, and targeted approaches. Each strategy offers distinct advantages and suffers from particular limitations, making them suitable for different experimental goals and resource constraints. In the specific context of protein quantification research—often compared alongside immunoassay techniques like ELISA, Luminex, and Meso Scale Discovery—understanding the technical nuances of these MS workflows is paramount for selecting the optimal tool [10].
Label-free and label-based strategies represent the two primary paradigms for discovery proteomics, where the goal is to compare protein abundances across multiple samples in a relative manner. Label-free quantification (LFQ) relies on direct comparison of MS signal intensities or spectral counts between separate LC-MS runs, while label-based methods use stable isotopes to incorporate predictable mass tags into proteins or peptides from different conditions, allowing them to be combined and analyzed simultaneously [11] [12]. In contrast, targeted MS strategies, such as Parallel Reaction Monitoring (PRM), focus on quantifying specific predefined proteins with high sensitivity and reproducibility, often using synthetic isotope-labeled peptides as internal standards [10]. This guide provides a detailed, objective comparison of these workflows, focusing on their underlying principles, performance metrics, and optimal applications to inform researchers in their experimental design.
Label-Free Quantification (LFQ) Workflow
Fundamental Principles and Methodologies
Label-free quantification is a mass spectrometry-based technique that facilitates relative protein quantification without the need for isotopic labeling or chemical modifications. Its principle revolves around determining protein abundance directly from the mass spectrometric signals of proteolytic peptides [13]. LFQ operates through two primary computational methods: the Extracted Ion Chromatogram (XIC) method and the Spectral Counting (SC) method [14] [13]. The XIC method, also known as feature-based or intensity-based quantification, calculates protein abundance by integrating the chromatographic peak area or intensity of peptide precursor ions at specific retention times. This method leverages high-resolution mass spectrometers to precisely differentiate isotopic peak clusters, providing high-accuracy quantification [13]. Conversely, the Spectral Counting method infers protein abundance based on the number of acquired MS/MS spectra (peptide-spectrum matches) matched to peptides of a given protein, operating on the principle that more abundant proteins produce more detectable fragmentation spectra [14] [15].
A significant technical challenge in LFQ is the issue of "missing values," where peptides are not detected across all runs, complicating comparative analysis. To mitigate this, Match-Between-Runs (MBR) has become a common approach, where peptides identified by tandem mass spectra in one run are transferred to another by inference based on accurate mass, retention time, and when applicable, ion mobility [16]. Advanced computational tools like IonQuant now implement false discovery rate (FDR)-controlled MBR, significantly improving sensitivity while maintaining statistical confidence in transferred identifications [16]. The overall success of LFQ is heavily dependent on the reproducibility of the analytical platform, requiring robust chromatographic alignment, sensitive instrumentation, and sophisticated software for data normalization and batch effect correction [15] [13].
Experimental Protocol for Label-Free Quantification
The standard LFQ workflow involves sequential processing of individual samples through preparation, separation, mass spectrometry analysis, and computational data processing [13].
- Sample Preparation: Proteins are extracted from biological samples (cells, tissues, or biofluids) and quantified. Proteins are then denatured, reduced, alkylated, and digested into peptides using a sequence-specific protease like trypsin, which cleaves proteins at the C-terminus of lysine and arginine residues. Peptides may undergo cleanup via solid-phase extraction to remove contaminants [11] [13].
- Liquid Chromatography (LC) Separation: Digested peptides are separated by reversed-phase high-performance liquid chromatography (RP-HPLC or UHPLC) based on hydrophobicity. The Thermo Scientific Vanquish Neo UHPLC System is an example of a system that provides reproducible separations of complex mixtures for high-sensitivity LC-MS workflows [17]. Nanoflow LC systems are typically used to enhance sensitivity.
- Mass Spectrometry Analysis: Separated peptides are ionized via electrospray ionization (ESI) and introduced into the mass spectrometer. Two data acquisition modes are common:
- Data-Dependent Acquisition (DDA): The mass spectrometer automatically selects the most abundant precursor ions for fragmentation, generating MS/MS spectra for peptide identification [17].
- Data-Independent Acquisition (DIA): Instead of selecting individual precursors, the mass spectrometer cycles through sequential, wide isolation windows (e.g., 25 m/z each) across the entire precursor mass range, fragmenting all detected ions within each window. This generates chimeric MS/MS spectra containing fragments from multiple peptides, requiring specialized spectral libraries for deconvolution and identification [17].
- Data Processing and Analysis: Acquired LC-MS data is processed using software platforms (e.g., Proteome Discoverer, MaxQuant, IonQuant, DIA-NN). Key steps include:
- Chromatographic Alignment: Correcting for run-to-run retention time shifts using identified peptides as landmarks [15].
- Peptide/Protein Identification: Searching MS/MS spectra against protein sequence databases.
- Quantification: Extracting peptide ion intensities (XIC) or counting spectral matches (SC).
- Normalization and Statistical Analysis: Applying normalization to correct for technical variations and performing statistical tests to identify significant protein abundance changes between sample groups [14] [15] [13].
Label-Free Quantification Workflow. This diagram illustrates the sequential steps in a typical LFQ experiment, from sample preparation to data analysis, highlighting the two primary data acquisition modes.
Label-Based Quantification Workflows
Principles and Labeling Strategies
Label-based quantification methods utilize stable isotope labels to introduce a predictable mass difference into proteins or peptides from different experimental conditions. This allows samples to be combined early in the workflow and analyzed simultaneously in the same MS run, thereby reducing technical variability and improving quantitative accuracy [11] [18]. The incorporated isotopes serve as internal standards, enabling direct comparison of peptide abundances from different samples within a single mass spectrum. These methods can be categorized based on the method of isotopic incorporation: metabolic, chemical, or enzymatic labeling, as well as by the level of quantification—precursor ion-based or reporter ion-based [11].
Precursor ion-based quantification differentiates samples by a mass shift (typically >4 Da to minimize interference) introduced at the peptide precursor level. Relative quantitation is achieved by comparing the extracted ion chromatograms of the light- and heavy-labeled peptide pairs in the MS1 spectrum [11]. Key techniques in this category include:
- SILAC (Stable Isotope Labeling by Amino acids in Cell culture): A metabolic labeling technique where cells are cultured in media containing "light" or "heavy" forms of essential amino acids (e.g., 13C6-lysine). The labels are incorporated into all proteins as they are synthesized, making SILAC highly accurate and reproducible for cell culture studies [11] [18].
- Dimethyl Labeling: A chemical labeling method where the N-termini and ε-amino groups of lysine residues in peptides are dimethylated using isotopic forms of formaldehyde and cyanoborohydride. It is cost-effective, efficient, and can achieve multiplexing up to 5-plex [11].
- Mass Defect-Based Labels: A newer approach that uses tiny, distinguishable mass differences (e.g., 6 mDa) introduced by neutron-encoded (NeuCode) amino acids or chemical tags. These small mass differences are resolvable only with high-resolution instruments but enable high-plex quantification without increasing MS1 spectral complexity [11].
Reporter ion-based quantification utilizes isobaric tags, which are chemically identical and have the same total mass, but fragment during MS/MS to produce low-mass reporter ions unique to each sample. The relative intensities of these reporter ions in the MS/MS spectrum provide quantitative information. The primary techniques are:
- TMT (Tandem Mass Tags) and iTRAQ (Isobaric Tags for Relative and Absolute Quantitation): These are multiplexed chemical labeling reagents that can tag peptides from multiple samples (e.g., TMT can currently multiplex up to 18 samples). The tags consist of a mass balancer, a reactive group that labels peptide amines, and a reporter group that is released during fragmentation [11] [18].
Experimental Protocol for TMT Multiplexing
The following protocol details a typical workflow for a TMT-based, reporter ion quantification experiment [11]:
- Sample Preparation and Labeling: Individual protein samples (from cells, tissues, or biofluids) are digested into peptides. Each peptide sample is then labeled with a different channel of the TMT reagent. The labeling reaction targets primary amine groups (N-terminus and lysine side chains) of peptides. After the reaction, the samples are pooled into a single tube.
- Peptide Fractionation: The pooled, multiplexed sample is often fractionated using off-line high-pH reversed-phase LC or other methods to reduce sample complexity. This step increases proteome coverage by reducing the likelihood of co-eluting peptides during subsequent analysis.
- LC-MS/MS Analysis: The fractionated samples are analyzed by LC-MS/MS using a data-dependent acquisition method on a high-resolution mass spectrometer.
- Data Acquisition and Quantification: During MS/MS fragmentation of each peptide, the TMT tag cleaves, releasing reporter ions in the low mass region (e.g., 126-131 Da for TMT 6-plex). The relative abundances of the reporter ions are measured, providing quantitative data for the same peptide across all multiplexed samples.
- Data Analysis: Software platforms are used to identify peptides from MS/MS spectra and quantify the reporter ion intensities. Normalization is applied to correct for any labeling efficiency differences, and protein-level quantification is summarized from its constituent peptides.
Label-Based TMT Workflow. This diagram shows the process of multiplexing samples using isobaric TMT tags, where samples are labeled, pooled, and analyzed together, with quantification occurring via reporter ions in MS/MS spectra.
Targeted Mass Spectrometry Strategies
Principles of Targeted Proteomics
While label-free and label-based methods are primarily used for discovery-oriented profiling, targeted mass spectrometry strategies are designed for the precise, sensitive, and reproducible quantification of specific proteins of interest. The most common targeted approach is Parallel Reaction Monitoring (PRM), a high-resolution mass spectrometry technique that focuses on monitoring predefined peptide precursors and their fragment ions. PRM is particularly powerful for verifying and validating candidate biomarkers, quantifying proteins in signaling pathways, and conducting pharmacokinetic studies where high precision and reliability are required [10].
In a PRM experiment, the mass spectrometer is programmed to isolate the specific precursor ions (proteotypic peptides representing the target protein) at their known retention times and then fragment them to record all product ions in a high-resolution mass analyzer (e.g., an Orbitrap). This provides a complete, high-fidelity fragment ion spectrum for each targeted peptide, which enhances specificity and minimizes background interference. A key strength of targeted methods like PRM is the routine use of stable isotope-labeled standard (SIS) peptides, which are synthetic peptides identical to the target analyte but incorporating heavy isotopes (e.g., 13C, 15N). These SIS peptides are spiked into the sample at a known concentration before digestion and serve as internal standards for absolute quantification, correcting for variations in sample preparation, ionization efficiency, and instrument performance [10].
Experimental Protocol for PRM with SIS Peptides
- Assay Development: Proteotypic peptides (unique to the target protein and with good MS detectability) are selected. Corresponding SIS peptides are synthesized.
- Sample Preparation and Standard Spike-in: Proteins are extracted from biological samples. A known quantity of each SIS peptide is added to the protein digest or, ideally, to the intact protein sample prior to digestion (for correction of digestion efficiency).
- LC-MS/MS Analysis with Targeted Method: The sample is analyzed using an LC-MS method programmed to include a "target list" of the specific precursor ions. The instrument operates in a targeted MS/MS mode, where it continuously cycles through the list, isolating each precursor and acquiring a full, high-resolution product ion scan (a PRM transition) when the peptide elutes.
- Data Processing and Quantification: The extracted ion chromatograms (XICs) of the fragment ions from both the native (light) and SIS (heavy) peptides are integrated. The ratio of the light to heavy peak areas is calculated. The absolute quantity of the endogenous peptide is determined by comparing this ratio to a calibration curve generated using the SIS peptide.
Comparative Performance Analysis
Quantitative Comparison of Workflow Performance
The following tables summarize the key performance characteristics and technical requirements of the three mass spectrometry workflows, based on experimental data and benchmarks reported in the literature.
Table 1: Performance Metrics and Application Fit of MS Workflows
| Feature | Label-Free Quantification (LFQ) | Label-Based Quantification (TMT/SILAC) | Targeted (PRM) |
|---|---|---|---|
| Quantification Accuracy | Moderate; highly dependent on platform reproducibility and data analysis [19] | Higher; internal standardization reduces variability [19] [18] | Highest; uses spiked-in isotope-labeled standards for precise quantification [10] |
| Proteome Coverage | Higher; can identify up to 3x more proteins than label-based in complex samples [19] | Lower; increased sample complexity from multiplexing can limit depth [19] | Limited by design to predefined targets |
| Multiplexing Capacity | Limited in silico; separate runs for each sample [17] | High; TMT can analyze up to 16-18 samples simultaneously [19] [18] | Typically single-sample, but can monitor many targets |
| Sample Throughput | Lower for large cohorts due to individual runs [18] | Higher for multiplexed sets; reduced instrument time per sample [18] | High for targeted panels; fast cycle times |
| Best Applications | Large-scale biomarker discovery, analysis of biofluids, studies with unlimited sample size [19] [13] | Time-course studies, cell culture models (SILAC), experiments requiring high precision across limited samples [19] [18] | Biomarker verification, pharmacokinetics, quantitative analysis of specific pathways [10] |
Table 2: Technical and Resource Requirements
| Requirement | Label-Free Quantification (LFQ) | Label-Based Quantification (TMT/SILAC) | Targeted (PRM) |
|---|---|---|---|
| Cost | Lower; no labeling reagents needed [19] [13] | Higher; cost of isotopic reagents can be significant [18] | Variable; cost of synthetic SIS peptides can be high |
| Sample Preparation Complexity | Simpler, less time-consuming [19] | More complex; requires optimization of labeling efficiency [19] [18] | Moderate; requires assay development |
| Data Analysis Complexity | High; requires robust alignment and normalization algorithms [19] [14] | High; requires specific tools for reporter ion quantification and normalization | Moderate; focused on quantifying predefined transitions |
| Instrument Time | More; each sample run individually [19] | Less for multiplexed sets; more samples per run [19] | Least per sample; fast acquisition methods |
| Dynamic Range | Wider [19] | Narrower [19] | Very wide for targeted proteins |
Comparison with Immunoassay Techniques
When placed in the context of protein quantification research, mass spectrometry workflows offer distinct advantages and disadvantages compared to traditional immunoassays like ELISA, Luminex, and Meso Scale Discovery (MSD) [10].
- Specificity: MS workflows provide superior specificity by relying on peptide sequence identification through mass-to-charge ratio and fragmentation patterns, whereas immunoassays can suffer from cross-reactivity with homologous or unrelated proteins [10].
- Multiplexing: While immunoassays like Luminex and MSD can measure dozens of analytes simultaneously in a high-throughput manner, MS-based multiplexing (especially TMT) is inherently scalable and does not require the development of specific, matched antibody pairs for each new protein target [10].
- Development Time and Cost: Developing a validated immunoassay is time-consuming and expensive, requiring high-quality antibodies that may not be available for all proteins of interest. In contrast, MS assays can be developed for any protein with a known sequence, though they require significant instrument investment and expertise [10].
- Sensitivity: Well-optimized immunoassays (e.g., MSD) can achieve ultralow picogram-per-milliliter sensitivity, often exceeding the detection limits of standard discovery proteomics workflows. However, targeted MS (PRM) with sample enrichment can approach similar levels of sensitivity for predefined targets [10].
Essential Research Reagent Solutions
The successful implementation of any mass spectrometry workflow relies on a suite of essential reagents and tools. The following table details key materials and their functions.
Table 3: Key Reagents and Materials for Mass Spectrometry Workflows
| Reagent / Material | Function | Applicable Workflow(s) |
|---|---|---|
| Trypsin | Protease that specifically cleaves proteins at the C-terminus of Lys and Arg residues to generate peptides for MS analysis. [11] | Universal |
| TMT or iTRAQ Reagents | Isobaric chemical tags that label peptide amines, enabling multiplexing and relative quantification via reporter ions in MS/MS. [11] [18] | Label-Based (Reporter Ion) |
| SILAC Media | Cell culture media containing stable isotope-labeled essential amino acids (e.g., 13C6-Lys) for metabolic incorporation into the proteome. [11] [18] | Label-Based (Precursor Ion) |
| Stable Isotope-Labeled Standard (SIS) Peptides | Synthetic peptides with heavy isotopes used as internal standards for absolute quantification, correcting for pre-analytical and analytical variability. [10] | Targeted (PRM) |
| iRT Kit | A set of synthetic peptides with known, predictable retention times used to normalize retention times across LC-MS runs and improve alignment. [13] | Label-Free, Targeted |
| FAIMS Pro Duo Interface | A high-field asymmetric waveform ion mobility spectrometry device that enhances precursor selectivity by filtering ions in the gas phase, reducing sample complexity and improving S/N. [17] | Label-Free, Label-Based |
The comparative analysis of mass spectrometry workflows reveals a clear trade-off between the breadth of discovery and the depth of quantitative precision. Label-free quantification excels in large-scale, exploratory studies, particularly for biomarker discovery in complex biofluids, offering extensive proteome coverage and flexibility at a lower cost. Label-based strategies, including SILAC and TMT, provide superior quantitative accuracy and precision for controlled experimental systems by minimizing technical variance through internal standardization and multiplexing. Finally, targeted strategies like PRM represent the gold standard for validating and absolutely quantifying a predefined set of proteins with the highest level of sensitivity and reproducibility.
The choice of workflow is not one-size-fits-all and must be guided by the specific research question, sample type, scale of the study, and available resources. For researchers engaged in specific protein quantification, this guide underscores that mass spectrometry is not necessarily a direct replacement for immunoassays but a complementary technology. While immunoassays offer exceptional throughput and sensitivity for routine tests, mass spectrometry provides unparalleled specificity, the ability to multiplex without antibodies, and direct insight into protein sequence and post-translational modifications. As instrument sensitivity, computational tools, and labeling techniques continue to advance, the integration of these powerful MS workflows will undoubtedly deepen our understanding of proteome dynamics in health and disease.
In the field of specific protein quantification, choosing the right analytical technique is paramount for generating reliable data. Immunoassays and mass spectrometry (MS) have emerged as two cornerstone methodologies, each with distinct strengths and limitations. For researchers and drug development professionals, understanding the key performance metrics that define these techniques—sensitivity, specificity, and dynamic range—is essential for appropriate method selection, experimental design, and data interpretation. This guide provides a comparative overview of these metrics within immunoassays and MS, supported by experimental data and detailed protocols, to inform your protein quantification research.
Core Metric Definitions and Their Importance
At the foundation of any analytical method evaluation are three critical performance metrics.
- Sensitivity is the ability of a test to correctly identify the presence of a target molecule. It is calculated as the percentage of true positives correctly identified, and is crucial for avoiding false negatives, particularly when detecting low-abundance proteins [20].
- Specificity is the ability of a test to correctly identify the absence of a target molecule. It is calculated as the percentage of true negatives correctly identified, and is vital for confirming that a positive signal is not due to cross-reactivity or interference [20].
- Dynamic Range describes the span of concentrations over which an assay can provide accurate and linear quantitative results. A wide dynamic range is essential for simultaneously quantifying proteins that exist at vastly different concentrations within a sample, such as in blood plasma where the protein abundance range can exceed 10 orders of magnitude [21] [22].
The relationship between sensitivity and specificity is often inverse; methods can often be tuned to improve one at the expense of the other. The optimal balance depends on the specific application.
Comparative Performance: Immunoassays vs. Mass Spectrometry
The following table summarizes the general performance characteristics of traditional immunoassays and mass spectrometry for protein quantification.
Table 1: General Comparison of Immunoassays and Mass Spectrometry
| Feature | Immunoassays | Mass Spectrometry |
|---|---|---|
| Typical Sensitivity | High (e.g., femtomolar levels in proximity assays) [22] | Very High (e.g., LC-MS/MS as reference method) [23] [24] |
| Typical Specificity | Moderate to High (can be affected by antibody cross-reactivity) [23] | Very High (based on mass-to-charge ratio and fragmentation fingerprints) [25] |
| Dynamic Range | Limited, typically 3-4 orders of magnitude [22] | Wide, but can be limited by detector saturation; excels in multiplexed analyte separation [25] |
| Multiplexing Potential | Moderate (limited by spectral overlap of fluorophores) [25] | High (can detect hundreds to thousands of analytes simultaneously) [25] |
| Throughput | High (amenable to automation and microplate formats) [21] | Lower (often involves sample separation via chromatography) [25] |
Supporting Experimental Data: A Case Study in Urinary Free Cortisol
A 2025 study directly compared four new direct immunoassays with liquid chromatography-tandem mass spectrometry (LC-MS/MS) for quantifying urinary free cortisol (UFC) in the diagnosis of Cushing's syndrome. The results provide a concrete example of how these metrics are evaluated and compared.
Table 2: Diagnostic Performance of Immunoassays vs. LC-MS/MS for Cushing's Syndrome [23] [24]
| Assay Method | Sensitivity (%) | Specificity (%) | Area Under the Curve (AUC) |
|---|---|---|---|
| Autobio CLIA | 89.66 | 96.67 | 0.953 |
| Mindray CLIA | 93.10 | 93.33 | 0.969 |
| Snibe CLIA | 89.66 | 96.67 | 0.963 |
| Roche ECiA | 90.80 | 95.33 | 0.958 |
| LC-MS/MS | (Reference Method) | (Reference Method) | - |
The study concluded that while all four immunoassays showed strong correlation and high diagnostic accuracy compared to LC-MS/MS, they also exhibited a proportional positive bias. This highlights that even with high sensitivity and specificity, absolute quantitation can vary between methods, underscoring the importance of using a consistent method and platform within a study [23] [24].
Detailed Experimental Protocols
To illustrate how these performance metrics are empirically determined, below are generalized protocols for a key immunoassay and a mass spectrometry-based method.
Protocol 1: Solid-Phase Proximity Ligation Assay (spPLA)
The spPLA is a sensitive immunoassay method that uses DNA-barcoded antibodies for highly specific protein detection [22].
- Sample Preparation: Protein samples are solubilized in a buffered aqueous solution. Compatible detergents, salts, and inhibitors may be included, but their potential interference with the assay must be considered [21].
- Antibody Incubation: The sample is incubated with a mixture of three antibody pools for each target protein:
- Biotinylated Capture Antibody: Binds the target and is subsequently captured on streptavidin-coated magnetic beads.
- 5' DNA-Oligo conjugated Detection Antibody
- 3' DNA-Oligo conjugated Detection Antibody [22]
- Ligation: When two DNA-oligo-conjugated antibodies bind in proximity to the same target protein, a complementary DNA splint strand and ligase enzyme are added. This ligates the two oligonucleotides into a single DNA reporter molecule unique to the protein target [22].
- Amplification and Quantification: The ligated DNA reporter is amplified via PCR and quantified using high-throughput sequencing. The read count for each protein-specific barcode is proportional to the original protein concentration [22].
Protocol 2: Liquid Chromatography-Tandem Mass Spectrometry (LC-MS/MS)
LC-MS/MS is often used as a reference method due to its high specificity [23] [24].
- Sample Preparation: Proteins are often digested into peptides using a protease like trypsin. For urinary free cortisol, a simple dilution may suffice. An internal standard (e.g., stable isotope-labeled cortisol) is added to the sample to correct for variability [24].
- Liquid Chromatography (LC): The sample is injected into an LC system. Peptides or analytes are separated based on their chemical properties as they elute from the chromatographic column, reducing sample complexity before MS analysis.
- Electrospray Ionization (ESI): The eluting analytes are ionized, transferring them into the gas phase as charged ions.
- Tandem Mass Spectrometry (MS/MS):
- MS1: The first mass analyzer selects ions of a specific mass-to-charge (m/z) ratio.
- Fragmentation: The selected ions are fragmented, typically by collision with an inert gas.
- MS2: The second mass analyzer measures the m/z of the resulting fragment ions, generating a unique fragmentation pattern that serves as a "molecular fingerprint" for highly specific identification and quantification [25] [24].
Visualizing Workflows and Concepts
Experimental Workflow Diagram
The following diagram illustrates the core workflows for the two principal techniques discussed.
The Dynamic Range Challenge and a Solution
A fundamental challenge in biomarker quantification is that the physiological dynamic range of proteins in blood spans over 10 orders of magnitude, while most detection methods are limited to 3-4 orders. The EVROS (Equalization) strategy uses two tuning mechanisms to overcome this, enabling multiplexed quantification of low- and high-abundance proteins from a single, undiluted sample [22].
The Scientist's Toolkit: Essential Research Reagent Solutions
Successful protein quantification relies on a suite of essential reagents and materials. The following table details key components and their functions.
Table 3: Essential Reagents for Protein Quantification
| Reagent / Material | Function | Key Considerations |
|---|---|---|
| Capture & Detection Antibodies | Bind specifically to the target protein for isolation and signal generation. | Critical for both sensitivity and specificity; cross-reactivity can cause false positives [25]. |
| Protein Standards (e.g., BSA, BGG) | Used to generate a calibration curve for determining unknown sample concentrations. | Should be a pure, stable protein; BSA is common, but BGG is better for antibody quantification [21]. |
| Mass Spectrometry Internal Standards | Stable isotope-labeled versions of the target analyte added to the sample. | Corrects for sample loss and ion suppression, enabling highly accurate quantification [24]. |
| Solid-Phase Beads (e.g., Magnetic) | Provide a surface for immobilizing capture antibodies and isolating the target-antibody complex. | Facilitates washing steps to remove unbound material, reducing background noise [22]. |
| DNA Barcodes & Ligation Reagents | In proximity assays, generate an amplifiable DNA reporter signal upon target binding. | Enables signal amplification and high specificity (requires two antibodies binding proximally) [22]. |
| Chromatography Columns | Separate analytes by chemical properties prior to MS analysis, reducing sample complexity. | Different column chemistries (e.g., C8, C18) are selected based on the target molecules [24]. |
The choice between immunoassays and mass spectrometry for protein quantification is not a matter of one technique being universally superior. Instead, it requires a careful balance of key performance metrics against experimental needs.
- Immunoassays offer high sensitivity, excellent throughput, and operational simplicity, making them ideal for high-volume, routine analysis of specific targets, though they can be limited by dynamic range and antibody cross-reactivity.
- Mass Spectrometry, particularly LC-MS/MS, provides unparalleled specificity, high accuracy, and powerful multiplexing capabilities, serving as a robust reference method, though it often requires more expertise and has lower throughput.
Emerging technologies like the EVROS equalization method are directly addressing the critical challenge of dynamic range, enabling highly multiplexed quantification from a single, small-volume sample. As the field advances, the convergence of these techniques—such as immunoaffinity enrichment coupled with MS detection—continues to push the boundaries of sensitivity, specificity, and multiplexing, empowering researchers in drug development and clinical diagnostics to achieve ever more precise and comprehensive protein quantification.
Historical Evolution and Current Technological Landscapes
The quantification of specific proteins is a cornerstone of biomedical research and clinical diagnostics, directly impacting drug development, disease diagnosis, and therapeutic monitoring. For decades, immunoassays have been the dominant technology in this field, leveraging the specific binding of antibodies to target proteins. However, the evolution of mass spectrometry (MS)-based methods, particularly liquid chromatography-tandem mass spectrometry (LC-MS/MS), has introduced a powerful alternative that offers unique advantages and complementary capabilities [26]. This guide provides an objective comparison of these two foundational technologies, framing their performance within the context of specific protein quantification research for scientists and drug development professionals. The historical trajectory reveals a shift from traditional methods to increasingly sophisticated, multiplexed assays, with current landscapes often advocating for a hybrid approach that leverages the strengths of both techniques to achieve more comprehensive and reliable proteome profiling [27] [25].
Core Principles and Technological Evolution
Immunoassays: Affinity-Based Detection
Immunoassays, such as the enzyme-linked immunosorbent assay (ELISA), rely on the high specificity of antibody-antigen interactions. The fundamental principle involves capturing a target protein using an immobilized antibody and detecting it with a labeled secondary antibody, generating a measurable signal proportional to the protein's concentration. Recent advancements include proximity extension assays (PEAs), which use pairs of antibodies linked to DNA oligonucleotides; when both antibodies bind their target, the DNA strands hybridize and create a quantifiable PCR amplicon, enhancing specificity for proteins in complex mixtures [27]. Other advanced platforms like Single molecule array (Simoa) offer exceptional sensitivity, detecting proteins at sub-femtomolar concentrations [28].
Mass Spectrometry: Mass-to-Charge Based Identification and Quantification
Mass spectrometry identifies and quantifies proteins based on the mass-to-charge ratio (m/z) of ionized molecules and their fragments. A typical LC-MS/MS workflow involves:
- Protein Digestion: Proteins are enzymatically cleaved into peptides.
- Liquid Chromatography (LC): Peptides are separated.
- Ionization and Mass Analysis: Peptides are ionized (e.g., by electrospray ionization) and analyzed in the mass spectrometer.
- Fragmentation and Detection: Selected peptides are fragmented, and the resulting spectra are used to infer protein identity and quantity [26].
Key acquisition methods include data-dependent acquisition (DDA), data-independent acquisition (DIA) like SWATH-MS, and targeted methods such as multiple reaction monitoring (MRM) or parallel reaction monitoring (PRM), which offer high specificity and reproducibility for quantifying predefined protein sets [26]. MS provides absolute quantification using stable isotope-labeled standards and can multiplex to measure hundreds of proteins simultaneously without requiring specific antibodies [28] [26].
The evolution of these technologies is summarized in the diagram below.
Comparative Performance Analysis
Direct comparisons between immunoassays and mass spectrometry reveal distinct and often complementary performance characteristics, influencing their suitability for specific research applications.
Quantitative Data from Platform Comparisons
Table 1: Direct Platform Comparison of Olink PEA vs. HiRIEF LC-MS/MS [27]
| Performance Metric | Olink Explore 3072 (PEA) | HiRIEF LC-MS/MS (MS) | Key Findings |
|---|---|---|---|
| Proteome Coverage | 2,913 proteins detected | 2,578 proteins detected | Platforms showed complementary coverage; 1,129 proteins overlapped. |
| Precision (Median CV) | 6.3% (intra-assay) | 6.8% (inter-assay) | Both platforms demonstrated high precision and low technical variability. |
| Quantitative Agreement | N/A | N/A | Median correlation for overlapping proteins: 0.59 (IQR 0.33-0.75). |
| Coverage by Abundance | Higher coverage of low-abundance proteins (e.g., cytokines) | Higher coverage of mid- to high-abundance proteins | Olink detected more proteins not in reference plasma proteome databases. |
| Bias in Protein Classes | Enriched for membrane proteins, CD markers, brain/testis proteins | Enriched for secreted proteins, enzymes, metabolic proteins, immunoglobulins | Reflects inherent technological strengths and antibody availability. |
Table 2: Performance in Clinical Biomarker Measurement [23] [28] [29]
| Application / Biomarker | Immunoassay Performance | Mass Spectrometry Performance | Comparative Conclusion |
|---|---|---|---|
| Urinary Free Cortisol (UFC) | Strong correlation with LC-MS/MS (r=0.950-0.998). Proportional positive bias. High diagnostic accuracy (AUC >0.95) for Cushing's syndrome [23] [29]. | Reference method. Used for validation and establishing cut-off values [23] [29]. | New direct immunoassays show good consistency with LC-MS/MS, simplifying workflow while maintaining diagnostic accuracy. |
| CSF P-tau217 (Alzheimer's) | High diagnostic performance, large effect sizes for group discrimination, strong association with PET biomarkers [28]. | Highly comparable to immunoassay in diagnostic performance and biomarker associations [28]. | p-tau217 measurements are highly comparable between platforms. |
| CSF P-tau181 & P-tau231 | Superior performance compared to MS in diagnostic accuracy and effect sizes [28]. | Lower performance compared to immunoassays for these specific phospho-forms [28]. | Immunoassays showed a slight performance advantage for these specific epitopes. |
Analysis of Comparative Data
The data from these studies indicate that the choice between immunoassay and MS is highly context-dependent.
- Complementary Proteome Coverage: The moderate median correlation (0.59) between Olink and MS highlights that these platforms do not always provide identical quantitative results, partly because they often measure different epitopes or proteoforms of the same protein [27]. This makes them complementary rather than interchangeable for discovery-phase research.
- Clinical Diagnostic Utility: For well-established, single-protein biomarkers like UFC, modern immunoassays can perform robustly and offer a simpler, high-throughput workflow with diagnostic accuracy on par with LC-MS/MS [23] [29]. However, MS often remains the reference method for establishing diagnostic cut-offs.
- Biomarker-Specific Performance: The performance can vary even among related biomarkers, as seen with p-tau variants. While p-tau217 is highly consistent across platforms, immunoassays for p-tau181 and p-tau231 currently hold an advantage, potentially due to higher affinity of the antibodies used or the specific clinical cohorts studied [28].
Detailed Experimental Protocols
To illustrate how comparative data is generated, this section outlines standard protocols for both technologies in a typical biomarker validation study.
1. Sample Preparation:
- Volume: 250 µL of cerebrospinal fluid (CSF).
- Internal Standard Addition: Spike with 10 µL of heavy isotope-labeled peptide standards (AQUA peptides).
- Protein Precipitation: Add perchloric acid (15 µl, 60% v/v) to precipitate the majority of CSF proteins, while tau remains in solution. Incubate on ice for 15 minutes and centrifuge at 30,000 × g for 10 min at 4°C.
- Solid-Phase Extraction (SPE): Transfer supernatant to a 96-well SPE plate (Oasis PRiME HLB). Wash with 5% methanol and elute peptides with 50% acetonitrile, 0.1% trifluoroacetic acid.
- Digestion: Lyophilize eluates and reconstitute in 40 µl of trypsin solution (2.5 µg/ml in 50 mM ammonium bicarbonate). Incubate at 37°C overnight to digest proteins into peptides.
- Quenching: Add trifluoroacetic acid to stop the reaction.
2. LC-MS/MS Analysis:
- Instrumentation: Hybrid Orbitrap mass spectrometer (e.g., Fusion Tribrid).
- Chromatography: Peptides are separated by liquid chromatography (LC).
- Acquisition: Use Parallel Reaction Monitoring (PRM), a targeted MS method. Precursor ions of target peptides are selected and fragmented, and all product ions are measured with high resolution and mass accuracy.
- Data Analysis: Quantify peptides by integrating the chromatographic peaks for the target (light) and heavy isotope-labeled (internal standard) peptides. Use software like Skyline for processing. The entire process from sample preparation to data analysis for a single sample requires approximately 2 days.
1. Platform-Specific Assay:
- Platforms: Custom Single Molecule Array (Simoa) on a Simoa HD-X instrument or Meso Scale Discovery (MSD) electrochemiluminescence assays.
- Procedure: The protocol follows the standard principle of a sandwich immunoassay but with different detection methods.
- For Simoa: Antibodies are coupled to magnetic beads, and the immunocomplex is detected using an enzyme-labeled reporter antibody that generates a fluorescent signal confined to individual wells, enabling single-molecule detection.
- For MSD: The assay uses electrochemiluminescent labels that emit light upon electrochemical stimulation, which is measured by the instrument.
- Measurement: The signal intensity is directly related to the concentration of the target protein (p-tau) in the sample. These assays are typically high-throughput, with results available in hours.
The fundamental workflows for these core techniques are visualized below.
The Scientist's Toolkit: Key Research Reagent Solutions
The execution of the protocols described above relies on a suite of essential reagents and materials. The following table details key solutions for implementing these technologies in a research setting.
Table 3: Essential Research Reagents and Materials
| Item | Function | Example Use-Case |
|---|---|---|
| Heavy Isotope-Labeled Peptide Standards (AQUA) | Provides internal standards for absolute quantification in MS; corrects for sample loss and ion suppression. | Spiked into CSF samples for precise quantification of p-tau peptides by LC-MS/MS [28]. |
| Anti-peptide Antibodies | Enriches specific target peptides from complex digests, significantly improving sensitivity for low-abundance proteins in targeted MS. | Used in immunoaffinity enrichment workflows like SISCAPA prior to LC-MS/MS analysis [25] [26]. |
| Proximity Extension Assay (PEA) Kits | Enables highly multiplexed, specific protein quantification in biofluids without cross-reactivity, using DNA-antibody conjugates and PCR amplification. | Olink Explore 3072 platform for profiling nearly 3,000 proteins from a small plasma sample [27]. |
| Tandem Mass Tag (TMT) Reagents | Allows multiplexed relative quantification of proteins across multiple samples in a single MS run by labeling peptides with isobaric tags. | Used in HiRIEF LC-MS/MS workflows to analyze 88 plasma samples simultaneously, increasing throughput [27]. |
| Formalin-Fixed Paraffin-Embedded (FFPE) Tissue Kits | Specialized reagents for reversing cross-links and extracting proteins from archived clinical FFPE tissue blocks for downstream proteomic analysis. | Enables retrospective MS-based proteomic studies of large clinical cohorts with long-term follow-up data [26]. |
| High-Selectivity SPE Cartridges | Purifies and concentrates peptides after digestion, removing salts and contaminants that interfere with LC-MS/MS analysis. | Oasis PRiME HLB plates used for clean-up of CSF samples in p-tau analysis [28]. |
The historical evolution of protein quantification technologies has led to a diverse and sophisticated current landscape. Immunoassays and mass spectrometry are not simply competing technologies but are often partners in advancing biomedical research. Immunoassays excel in sensitivity for low-abundance proteins, high-throughput clinical validation, and accessibility. In contrast, mass spectrometry offers high multiplexing without predefined targets, exceptional specificity, absolute quantification, and the ability to detect specific proteoforms and post-translational modifications [27] [28] [26].
The future of specific protein quantification research lies in leveraging the complementary strengths of both platforms. Hybrid techniques that combine immunoaffinity enrichment with mass spectrometric detection (e.g., SISCAPA, immuno-MALDI) are already being developed to overcome the limitations of either method alone [25]. For researchers and drug developers, the optimal strategy involves a clear-eyed assessment of the project's goals: immunoassays may be preferable for high-throughput, clinical-grade measurement of established biomarkers, while mass spectrometry is powerful for unbiased biomarker discovery, verifying immunoassay specificity, and quantifying complex or novel protein variants. As both technologies continue to advance, their integrated application will undoubtedly provide a more comprehensive and reliable understanding of the proteome in health and disease.
Practical Implementation: Method Selection Across Research and Industry
Urinary free cortisol (UFC) measurement represents a cornerstone in the diagnostic evaluation of Cushing's syndrome (CS), a rare endocrine disorder characterized by chronic hypercortisolism with significant associated morbidity and mortality [30]. As integrated measures of biologically active cortisol secretion over 24 hours, UFC levels provide clinicians with a crucial non-invasive screening tool that reflects tissue exposure to free cortisol [31] [30]. The accurate quantification of UFC presents substantial analytical challenges, primarily revolving around method specificity and standardization.
The central dichotomy in UFC measurement methodology lies between immunoassays and liquid chromatography-tandem mass spectrometry (LC-MS/MS). Immunoassays have served as the traditional workhorse in clinical laboratories due to their widespread availability and automation capabilities, yet concerns persist regarding antibody cross-reactivity with cortisol metabolites that can compromise specificity [31] [30]. Conversely, LC-MS/MS offers superior structural specificity and has emerged as the reference method, though its implementation is constrained by operational complexity and cost considerations [30] [32].
This comparative guide objectively evaluates the performance characteristics of contemporary UFC measurement platforms, synthesizing recent experimental data to inform method selection for clinical diagnostics and research applications. By examining analytical consistency, diagnostic accuracy, and practical implementation factors, this analysis provides evidence-based guidance for researchers, scientists, and drug development professionals engaged in steroid hormone quantification.
Methodological Comparison: Immunoassays vs. LC-MS/MS
Fundamental Technical Principles
Immunoassays operate on the principle of competitive or sandwich antibody-antigen binding, utilizing labeled cortisol derivatives to generate measurable signals proportional to analyte concentration. Automated platforms employ various detection systems including chemiluminescence (CLIA), electrochemiluminescence (ECLIA), and enzyme-linked fluorescence [24] [33]. A critical vulnerability of immunoassays stems from structural similarities among steroid metabolites, leading to potential cross-reactivity and positive bias [31] [30]. While organic solvent extraction can mitigate interferences by removing conjugated metabolites, this additional step introduces complexity, requires technical expertise, and presents safety concerns [33].
LC-MS/MS combines liquid chromatographic separation with mass spectrometric detection, providing orthogonal specificity through both retention time and mass-to-charge ratio [34]. This methodology eliminates antibody cross-reactivity issues by physically separating cortisol from interfering substances before detection [30] [32]. Sample preparation may involve liquid-liquid extraction, solid-phase extraction, or dilute-and-shoot approaches, with increasing adoption of online extraction techniques like Turboflow chromatography to enhance throughput [35] [34].
Experimental Protocols for Method Comparison
Recent comparative studies have employed standardized experimental designs to evaluate UFC measurement platforms. Representative protocols include:
Sample Collection and Patient Cohorts: Studies typically utilize residual 24-hour urine samples from well-characterized patient cohorts, including confirmed CS cases and control subjects in whom CS has been excluded through long-term follow-up [23] [31] [24]. Sample sizes generally range from 77-94 CS patients and 97-243 non-CS patients across studies [23] [31] [24]. Proper collection involves refrigerated storage during 24-hour accumulation, with subsequent freezing at -80°C until analysis [33].
Methodology Comparison Approach: Investigations employ Passing-Bablok regression to assess correlation and proportional biases between methods, complemented by Bland-Altman plots to evaluate agreement across the measurement range [23] [24]. Diagnostic performance is quantified through receiver operating characteristic (ROC) analysis, with calculation of area under the curve (AUC), optimal cut-off values via Youden's index, and corresponding sensitivity and specificity [23] [24].
LC-MS/MS Reference Methods: Reference laboratories typically develop and validate in-house LC-MS/MS methods, utilizing deuterated internal standards (e.g., cortisol-d4) for quantification [24] [33]. Chromatographic separation employs C8 or C18 columns with methanol/water mobile phases, while mass detection uses positive electrospray ionization with multiple reaction monitoring of specific transitions (e.g., 363.2→121.0 for cortisol) [24] [33].
Figure 1: Experimental Workflow for UFC Method Comparison Studies. This diagram illustrates the parallel processing of urine samples through LC-MS/MS and immunoassay platforms, culminating in statistical comparison of methodological performance.
Comparative Performance Data
Analytical Consistency with LC-MS/MS
Recent evaluations of four new automated immunoassays demonstrated strong correlations with LC-MS/MS reference methods, though with consistent positive biases indicative of persistent cross-reactivity issues.
Table 1: Correlation of Immunoassays with LC-MS/MS for UFC Measurement
| Analytical Platform | Principle | Spearman Correlation (r) | Proportional Bias | Reference |
|---|---|---|---|---|
| Autobio A6200 | Competitive CLIA | 0.950 | Positive | [23] [24] |
| Mindray CL-1200i | Sandwich CLIA | 0.998 | Positive | [23] [24] |
| Snibe MAGLUMI X8 | Competitive CLIA | 0.967 | Positive | [23] [24] |
| Roche 8000 e801 | Competitive ECLIA | 0.951 | Positive | [23] [24] |
| Abbott Architect i2000SR | Direct CLIA | 0.965 | Positive | [33] |
| Siemens Atellica (extraction) | CLIA with extraction | 0.922 | Positive | [33] |
The observed positive biases across all immunoassays reflect method-specific cross-reactivity profiles with structurally similar steroids. The magnitude of bias varies considerably between platforms, with some studies reporting immunoassay results 2-3 times higher than LC-MS/MS values in both CS patients and controls [31] [36]. This systematic overestimation underscores the necessity of method-specific reference intervals for proper clinical interpretation.
Diagnostic Accuracy for Cushing's Syndrome
Despite analytical differences in absolute concentration measurements, modern immunoassays demonstrate comparable diagnostic accuracy to LC-MS/MS for identifying patients with CS when appropriate method-specific cut-offs are applied.
Table 2: Diagnostic Performance of UFC Measurement Methods for Cushing's Syndrome
| Analytical Method | ROC AUC | Optimal Cut-off | Sensitivity (%) | Specificity (%) | Reference |
|---|---|---|---|---|---|
| LC-MS/MS (Reference) | 0.972 | 154.8 nmol/24h | 93.2 | 97.1 | [33] |
| Autobio A6200 | 0.953 | 178.5 nmol/24h | 89.7 | 96.7 | [23] [24] |
| Mindray CL-1200i | 0.969 | 272.0 nmol/24h | 93.1 | 93.3 | [23] [24] |
| Snibe MAGLUMI X8 | 0.963 | 193.4 nmol/24h | 90.8 | 94.7 | [23] [24] |
| Roche 8000 e801 | 0.958 | 235.8 nmol/24h | 91.4 | 95.3 | [23] [24] |
| Abbott Architect i2000SR | 0.975 | 154.8 nmol/24h | 93.2 | 97.1 | [33] |
| LIAISON (DiaSorin) | 0.89 | 234 μg/24h | ~90* | ~90* | [31] [36] |
Note: *Estimated from ROC curves; exact values not provided in source.
The remarkable consistency in AUC values across methodologies highlights a key principle: while absolute concentration values differ substantially between methods, the relative separation between healthy individuals and CS patients remains comparable when optimized thresholds are employed. This diagnostic equivalence enables effective clinical utilization of immunoassays despite their analytical biases.
The Scientist's Toolkit: Research Reagent Solutions
Table 3: Essential Materials and Reagents for UFC Quantification
| Item | Function/Application | Examples/Specifications |
|---|---|---|
| Chromatography Columns | Steroid separation | ACQUITY UPLC BEH C8 (1.7 µm, 2.1×100 mm); Accucore Polar Premium for isomer separation [24] [34] |
| Mass Spectrometry Standards | Quantification and quality control | Cortisol-d4 (Toronto Research Chemicals); 13C-cortisol (Merck) for internal standardization [24] [34] |
| Immunoassay Platforms | High-throughput clinical analysis | Autobio A6200, Mindray CL-1200i, Snibe MAGLUMI X8, Roche 8000 e801 [23] [24] |
| Sample Preparation Materials | Analyte extraction and cleanup | Ethyl acetate, dichloromethane for liquid-liquid extraction; Turboflow columns for online SPE [33] [34] |
| Quality Control Materials | Method validation and monitoring | Liquichek Urine Chemistry Controls (Bio-Rad); MassCheck Cortisol Controls (Chromsystem) [33] [34] |
| Calibration Standards | Method calibration | Manufacturer-specific calibrators; NIST-traceable reference materials (NIST 921A) [24] |
Discussion and Future Perspectives
The evolving landscape of UFC quantification reflects broader trends in clinical mass spectrometry, where technological advancements are progressively addressing traditional limitations of throughput and accessibility [35] [34]. The development of streamlined "dilute-and-shoot" LC-MS/MS methods and automated online extraction approaches represents a significant step toward making mass spectrometric analysis more practical for routine clinical laboratories [35] [34]. These innovations maintain the superior specificity of mass spectrometry while reducing manual manipulation and improving analytical throughput.
Future methodological developments will likely focus on expanding steroid profiling capabilities beyond cortisol alone. Simultaneous quantification of cortisol, cortisone, and their phase II metabolites may enhance diagnostic discrimination between CS subtypes and other pathological conditions [35]. The integration of multi-steroid panels with computational analytics holds particular promise for differentiating mild CS from pseudo-Cushing's states, a persistent diagnostic challenge in clinical endocrinology [30] [35].
Method selection for UFC quantification must balance analytical specificity with practical considerations including test volume, technical expertise, and infrastructure resources. For high-volume reference laboratories and research applications requiring maximal specificity, LC-MS/MS remains the unequivocal gold standard [32] [34]. For routine clinical settings with appropriate method-specific reference intervals, modern immunoassays provide diagnostically equivalent performance with greater operational simplicity [23] [24]. This nuanced understanding enables evidence-based method selection tailored to specific clinical and research requirements.
Figure 2: Decision Framework for UFC Method Selection and Future Directions. This diagram outlines key considerations in selecting between methodological approaches and identifies emerging trends in steroid hormone quantification.
Host cell proteins (HCPs) constitute a major class of process-related impurities in biologics manufacturing that require rigorous monitoring to ensure drug safety, quality, and efficacy. These proteins are expressed endogenously by the host cell line (e.g., Chinese Hamster Ovary [CHO] cells) and can co-purify with the therapeutic product during downstream processing [37]. Even at residual parts-per-million (ppm) concentrations, certain HCPs can potentially compromise product quality by degrading the active pharmaceutical ingredient, induce immune responses in patients, or affect drug stability [37] [38]. Regulatory authorities, including the FDA and EMA, consider HCP levels a critical quality attribute (CQA), mandating their clearance throughout the purification process [37] [39].
The biopharmaceutical industry primarily utilizes two analytical techniques for HCP monitoring: immunoassays and mass spectrometry. This guide provides an objective comparison of these technologies, detailing their performance characteristics, experimental protocols, and appropriate applications within biopharmaceutical quality control.
Immunoassays for HCP Detection
Enzyme-Linked Immunosorbent Assay (HCP-ELISA) has been the standard technique for HCP quantification due to its simple handling, short analysis time, and high sensitivity [37]. This method employs polyclonal antibodies raised against the host cell population to detect a broad spectrum of HCPs immunologically [37] [10]. The result is expressed as an "immuno-equivalent" nanograms of HCP per milligram of drug substance, providing a total HCP value without identifying individual proteins [37].
Newer immunoassay platforms offer enhanced capabilities. Meso Scale Discovery (MSD) utilizes electrochemiluminescent detection with carbon electrode-integrated plates, providing ultra-low picogram-level detection limits and a dynamic range of up to five orders of magnitude [10]. Luminex xMAP technology employs antibody-linked magnetic microbeads, enabling highly multiplexed analysis of hundreds of analytes simultaneously [10].
Mass Spectrometry for HCP Detection
Liquid chromatography-mass spectrometry (LC-MS) has emerged as a powerful orthogonal method for HCP analysis, enabling identification and quantification of individual HCPs [37] [40]. This label-free, antibody-independent approach provides sequence-specific detection through peptide fragmentation patterns, allowing absolute quantification when combined with internal standards [40] [28].
Recent advances in MS technologies, including improved data acquisition strategies and artificial intelligence-assisted data interpretation, have significantly enhanced the sensitivity and reliability of HCP detection [40]. Regulatory agencies increasingly support MS as a complementary tool for comprehensive HCP characterization throughout drug development and manufacturing [37] [40].
Direct Performance Comparison
The table below summarizes the key characteristics of immunoassay and mass spectrometry techniques for HCP analysis:
Table 1: Performance Comparison of Immunoassays and Mass Spectrometry for HCP Monitoring
| Characteristic | Immunoassays (ELISA) | Mass Spectrometry (LC-MS) |
|---|---|---|
| Principle | Immunological recognition using anti-HCP antibodies [37] | Physical separation and mass-based detection [37] |
| Throughput | High [10] | Moderate to low [10] |
| Sensitivity | High (ppm level) [37] | Moderate to high (improving with new technology) [40] |
| Information Obtained | Total HCP amount (immuno-equivalent) [37] | Identity and quantity of individual HCPs [37] [40] |
| Multiplexing Capability | Limited (new platforms offer some multiplexing) [10] | High (can detect thousands of proteins simultaneously) [10] [38] |
| Antibody Dependency | Required (potential reagent supply challenges) [37] [10] | Not required [40] |
| Coverage Concerns | Possible low coverage for poorly immunogenic HCPs (e.g., low MW proteins) [37] [38] | Comprehensive with appropriate database [38] |
| Regulatory Status | Standard for batch release [37] | Orthogonal method; increasing regulatory acceptance [37] [40] |
Experimental Protocols
HCP-ELISA Workflow
The typical sandwich ELISA protocol for HCP detection involves several key stages:
- Plate Coating: A multi-well plate is coated with a capture antibody (polyclonal anti-HCP antibody) and incubated overnight [10].
- Blocking: The plate is blocked with a protein-based buffer (e.g., BSA) to prevent non-specific binding [10].
- Sample Incubation: Standards (with known HCP concentrations), controls, and test samples are added to the plate and incubated, allowing HCPs to bind the capture antibody [10].
- Detection Antibody Addition: A detection antibody (often the same anti-HCP antibody conjugated to an enzyme such as horseradish peroxidase) is added and forms a complex with captured HCPs [10].
- Signal Development: A substrate solution is added, producing a colorimetric, fluorescent, or chemiluminescent signal proportional to the amount of captured HCP [10].
- Quantification: The reaction is stopped, and the signal is measured. HCP concentration in unknowns is interpolated from the standard curve [10].
LC-MS/MS Workflow for HCP Analysis
Mass spectrometry-based HCP analysis follows a detailed workflow for precise identification and quantification:
- Sample Preparation: The drug product sample is processed to deplete the therapeutic protein (e.g., monoclonal antibody) and enrich the HCP population, enhancing detection sensitivity [39]. Methods may include antibody affinity extraction (AAE) chromatography or protein precipitation with perchloric acid [39] [28].
- Digestion: HCPs are denatured, reduced, alkylated, and digested with trypsin to generate peptides [28] [38].
- Liquid Chromatography: Tryptic peptides are separated by reverse-phase liquid chromatography based on hydrophobicity [28].
- Mass Spectrometry Analysis: Eluted peptides are ionized and analyzed by tandem mass spectrometry. Data-Dependent Acquisition (DDA) or Parallel Reaction Monitoring (PRM) scans are used to collect fragmentation spectra [28] [38].
- Data Analysis: Acquired spectra are searched against a host cell protein database (e.g., CHO genome) for identification. Quantification is achieved by comparing peptide signal intensities to internal heavy isotope-labeled standards [28] [38].
Figure 1: LC-MS/MS Workflow for HCP Analysis. This diagram outlines the key steps in mass spectrometry-based host cell protein identification and quantification.
Comparative Experimental Data
Quantitative Method Performance
Independent studies across various fields of protein analytics provide robust data for comparing immunoassay and MS performance:
Table 2: Comparative Analytical Performance from Validation Studies
| Study Context | Parameter | Immunoassay Performance | Mass Spectrometry Performance |
|---|---|---|---|
| Salivary Hormone Analysis [41] | Relationship with expected physiological patterns | Poor for estradiol and progesterone; better for testosterone | Showed expected differences for all hormones |
| Machine-learning classification accuracy | Lower classification accuracy | Superior classification results | |
| Urinary Free Cortisol Measurement [24] | Correlation with reference method | Strong correlation (Spearman r = 0.950-0.998) | Used as reference method |
| Diagnostic Accuracy (AUC) | High (AUC: 0.953-0.969) | Not applicable (reference method) | |
| Alzheimer's p-tau Biomarker Detection [28] | Diagnostic performance for amyloid-PET positivity | Slightly superior for p-tau181 and p-tau231 | High, but slightly lower than immunoassay for some variants |
| Performance for p-tau217 | High diagnostic performance | Highly comparable to immunoassay |
Coverage and Identification Capabilities
A critical advantage of LC-MS/MS lies in its comprehensive profiling capabilities. A study analyzing eight commercial antibody drug products using an extended CHO protein database identified numerous HCP impurities, including previously unannotated microproteins (proteins <100 amino acids) that might be missed by immunoassays due to low immunogenicity [38]. This demonstrates MS's power to reveal the complete HCP repertoire, which is vital for comprehensive risk assessment.
Implementation in Biopharmaceutical Development
Strategic Application of Techniques
The complementary strengths of immunoassays and mass spectrometry make them suitable for different stages of the drug development lifecycle:
- Early-Stage Process Development: LC-MS/MS is invaluable for identifying and quantifying individual HCPs throughout the downstream purification process. This detailed profile helps engineers optimize purification steps to remove problematic HCPs [37] [40].
- Late-Stage and Commercial Control: Once the process is locked, the speed, sensitivity, and throughput of HCP-ELISA make it the preferred tool for routine lot release testing and process consistency monitoring [37] [42].
- Orthogonal Monitoring: Regulatory authorities recommend using LC-MS/MS as an orthogonal method to validate the coverage and suitability of the HCP-ELISA, ensuring it detects all relevant HCPs, including those that are low abundance or poorly immunogenic [37] [39].
The Scientist's Toolkit: Essential Research Reagents and Materials
Successful HCP analysis requires specific reagents and tools for each platform:
Table 3: Key Research Reagent Solutions for HCP Analysis
| Item | Function | Key Considerations |
|---|---|---|
| Process-Specific Anti-HCP Antibodies [37] | Critical reagent for HCP-ELISA capture and detection. | Coverage must be validated for the specific cell line and process; reagent supply must be secured for product lifecycle [37]. |
| CHO (or other host cell) Protein Database [38] | Reference database for MS-based HCP identification. | Requires high-quality, comprehensive annotation; enhanced by ribosome sequencing (Ribo-seq) to include non-canonical ORFs and microproteins [38]. |
| Heavy Isotope-Labeled Peptide Standards (AQUA) [28] | Enables absolute quantification of specific HCPs by MS. | Peptide sequences must be unique to the target HCP; used to create calibration curves for precise measurement [28]. |
| Platform or Commercial HCP-ELISA Kits [37] | Off-the-shelf solution for initial process development. | Risk of insufficient coverage if HCP profile differs from the immunizing antigen; bridging studies required for reagent lot changes [37]. |
| Affinity Extraction Columns [39] | Depletes the therapeutic protein (e.g., mAb) from samples for MS analysis. | Enriches HCP content, significantly improving detection sensitivity for low-abundance impurities [39]. |
Figure 2: Complementary Roles of Immunoassays and Mass Spectrometry. Each technology offers distinct strengths, making them suitable for different but complementary applications in HCP control strategy.
Both immunoassays and mass spectrometry are indispensable for monitoring host cell protein impurities in biopharmaceuticals. HCP-ELISA remains the standard for high-throughput, sensitive quantification in quality control and batch release. In contrast, LC-MS/MS provides unrivalled detailed characterization, enabling identification of individual HCPs and supporting process development and risk assessment.
A robust HCP control strategy should leverage the strengths of both techniques. The trend is toward increased regulatory acceptance of mass spectrometry as an orthogonal method, with its role expected to grow as technologies advance and databases improve. The optimal approach involves using these tools complementarily to ensure the consistent production of safe, pure, and effective biologic drugs.
The global genetically modified (GM) crops market is projected to grow from $19 billion in 2018 to approximately $26 billion by 2024, reflecting increasing reliance on biotechnology to address agricultural challenges [10]. Most GM crop products are designed to express novel proteins that confer desirable traits such as herbicide tolerance or insect resistance [43]. Precise quantification of these proteins is essential throughout the product development lifecycle—from initial research and regulatory compliance to commercial seed production and international trade [10]. As trait portfolios expand to include multiple engineered characteristics, the analytical techniques for protein detection and measurement have evolved significantly, with immunoassays and mass spectrometry emerging as the principal technologies [10].
This guide provides a comparative analysis of these fundamental protein quantification techniques, focusing on their application in agricultural biotechnology. We examine the technical principles, performance characteristics, and practical considerations for implementing these methods in the evaluation of protein expression in genetically modified crops, providing researchers with objective data to inform their analytical strategy.
Key Protein Analysis Techniques: Principles and Applications
Protein analysis in GM crops encompasses several methodologies, each with distinct capabilities and applications. Traditional techniques include protein separation methods like sodium dodecyl sulfate polyacrylamide gel electrophoresis (SDS-PAGE), which separates proteins primarily by molecular weight, and two-dimensional gel electrophoresis (2-DE), which separates proteins based on both isoelectric point and molecular weight for analyzing complex samples [44]. Western blotting combines size-based separation with antibody-based detection to identify specific proteins from complex mixtures [44].
For protein identification, Edman Degradation sequences amino acids in a peptide, while mass spectrometry measures the mass-to-charge ratio of charged particles for determining masses and elucidating chemical structures [44]. Modern protein complex analysis methods include light scattering techniques, which are particularly sensitive to larger molecules and aggregation, and multi-detection GPC/SEC, which separates molecules by size before characterization [44].
Table 1: Fundamental Protein Analysis Techniques in Biotechnology
| Technique | Primary Principle | Main Applications in GM Crop Analysis |
|---|---|---|
| SDS-PAGE | Separation by molecular weight in electrical field | Initial protein separation, purity assessment |
| 2-DE | Separation by charge (pI) and molecular weight | Comparative proteomics, detecting unintended effects |
| Western Blot | Size separation + antibody detection | Specific protein identification, confirmation of expression |
| Mass Spectrometry | Mass-to-charge ratio measurement | Protein identification, quantification, post-translational modification analysis |
| Light Scattering | Size measurement via scattering patterns | Aggregation detection, size distribution analysis |
Comparative Analysis: Immunoassays vs. Mass Spectrometry
Immunoassay Platforms
Immunoassays have served as the cornerstone technique for protein quantification in GM crops for decades, leveraging specific antibody-protein interactions for detection [10]. The enzyme-linked immunosorbent assay (ELISA), particularly the sandwich format, employs two antibodies that bind different epitopes of the target protein—a capture antibody immobilized on a solid surface and a detection antibody conjugated to a signaling enzyme [10]. This configuration provides high specificity, with sensitivity typically ranging from 0.1 to 1 ng/mL (ppb) and a quantitative range spanning 2-3 orders of magnitude [10].
Newer immunoassay platforms offer enhanced capabilities. Luminex xMAP technology incorporates antibody-linked magnetic microbeads and flow cytometry for multiplexed analysis, allowing simultaneous measurement of multiple analytes [10]. This system provides a dynamic range of up to 5 orders of magnitude, though it requires careful handling of the antibody-conjugated beads which can be damaged by freezing [10]. Meso Scale Discovery (MSD) technology employs electrochemiluminescent detection with carbon electrode-integrated plates, offering exceptional sensitivity down to picogram levels and a wide dynamic range of five or more orders of magnitude [10]. MSD plates can be configured with up to 10 spots per well, each coated with different capture antibodies for limited multiplexing [10].
Mass Spectrometry Platforms
Liquid chromatography coupled with tandem mass spectrometry (LC-MS/MS) has emerged as a powerful alternative for protein quantitation, combining physical separation capabilities with precise mass identification [10]. This approach involves digesting proteins into peptides, separating them chromatographically, and analyzing them via mass spectrometry [45]. The isobaric tags for relative and absolute quantitation (iTRAQ) method represents a high-throughput approach with strong accuracy, sensitivity, and repeatability, overcoming some limitations of 2-DE which has limited ability to detect low-abundance proteins [46].
LC-MRM-MS (multiple reaction monitoring) has been developed for highly specific quantification of target proteins in complex matrices, making it suitable for analyzing specific trait proteins in GM crops [45]. This targeted mass spectrometry approach offers excellent specificity by monitoring predefined precursor-to-product ion transitions, with sensitivity comparable to immunoassays and robust multiplexing capabilities [10].
Table 2: Performance Comparison of Protein Quantification Techniques
| Parameter | ELISA | Luminex | MSD | LC-MS/MS |
|---|---|---|---|---|
| Sensitivity | 0.1-1 ng/mL | Similar to ELISA | pg/mL level | Comparable to immunoassays |
| Dynamic Range | 2-3 orders of magnitude | Up to 5 orders of magnitude | 5+ orders of magnitude | 3-4 orders of magnitude |
| Multiplexing Capacity | Single-plex | High (potentially 100+ analytes) | Moderate (up to 10-plex) | High (depends on method) |
| Sample Throughput | High | Moderate to High | Moderate to High | Moderate |
| Development Time | Long (antibody production) | Long (antibody production) | Long (antibody production) | Medium (method development) |
| Specificity Source | Antibody pairs | Antibody pairs | Antibody pairs | Mass-to-charge ratio |
Experimental Protocols for Protein Quantification
Immunoassay Protocol: Sandwich ELISA
The sandwich ELISA protocol begins with coating a microplate with capture antibody specific to the target protein, typically incubating overnight at 4°C [10]. After blocking with a protein-based buffer to prevent nonspecific binding, samples and protein standards are added to the plate and incubated for 1-2 hours at room temperature [10]. Following washing, a detection antibody conjugated to an enzyme (such as horseradish peroxidase) is added to form the sandwich complex [10]. After additional washing, a substrate solution is added, and the enzymatic reaction produces a measurable signal proportional to the target protein concentration [10]. The reaction is stopped with acid, and absorbance is measured spectrophotometrically [10]. Quantification is achieved by interpolating sample signals from a standard curve generated with known concentrations of purified protein [10].
Mass Spectrometry Protocol: LC-MS/MS with iTRAQ
For iTRAQ-based comparative proteomics, proteins are first extracted from GM crop tissues using appropriate lysis buffers [46]. The protein samples are then digested with trypsin to generate peptides, which are labeled with iTRAQ reagents of different masses [46]. The labeled peptides are pooled and fractionated by liquid chromatography to reduce complexity [46]. The fractions are analyzed by tandem mass spectrometry, which fragments the peptides and generates spectra used to identify the proteins and quantify their expression levels based on iTRAQ reporter ions [46]. Bioinformatics tools then process the mass spectrometry data to identify differentially expressed proteins between GM and non-GM counterparts [46].
Research Reagent Solutions for Protein Analysis
Successful protein quantification in GM crops requires specific reagents and materials tailored to each analytical platform. For immunoassays, the critical components include high-affinity antibody pairs recognizing distinct epitopes on the target protein, purified protein standards for calibration curve generation, and appropriate detection systems such as enzyme conjugates with compatible substrates [10]. For mass spectrometry-based approaches, essential reagents include proteolytic enzymes (typically trypsin) for protein digestion, isotopic or isobaric labeling tags for quantification, stable isotope-labeled internal standard peptides, and chromatographic solvents compatible with LC-MS systems [46].
Table 3: Essential Research Reagents for Protein Quantification
| Reagent Category | Specific Examples | Function in Analysis |
|---|---|---|
| Detection Antibodies | Monoclonal, polyclonal antibodies | Specific binding to target proteins for immunoassays |
| Protein Standards | Purified transgenic proteins | Calibration curve generation for quantification |
| Labeling Reagents | iTRAQ, TMT tags | Multiplexed quantification in mass spectrometry |
| Digestion Enzymes | Trypsin, Lys-C | Protein digestion to peptides for MS analysis |
| Chromatography Media | C18, C8 reverse-phase columns | Peptide separation prior to mass spectrometry |
| Internal Standards | Stable isotope-labeled peptides | Normalization and quantification in targeted MS |
Applications in Safety Assessment and Regulation
Proteomic analysis plays a crucial role in the safety assessment of GM crops by detecting potential unintended effects resulting from genetic modification [43]. The concept of "substantial equivalence" provides a framework for comparison between GM crops and their conventional counterparts, with proteomics offering a direct means to evaluate changes at the protein level [43]. Profiling technologies enable simultaneous comparison of thousands of protein components without prior knowledge of their identity, facilitating a comprehensive assessment of unintended effects [47].
Comparative proteomic studies have demonstrated that environmental factors often contribute more significantly to protein expression differences than the genetic modification itself [47]. For instance, a study of MON810 maize hybrids grown in different agroecosystems in Brazil revealed that the environment was the primary source of variation in protein expression patterns [47]. Similarly, an iTRAQ-based proteomic analysis of multiple GM soybean lines found that differences in protein expression among natural genotypic varieties were greater than those caused by genetic modification [46]. These findings highlight the importance of appropriate experimental design that accounts for environmental and genetic background variations when assessing the safety of GM crops.
The comparative analysis of immunoassays and mass spectrometry for protein quantification in GM crops reveals complementary strengths that can be strategically deployed throughout the product development pipeline. Immunoassays provide robust, high-throughput capabilities well-suited for routine analysis of known proteins, while mass spectrometry offers unparalleled specificity and growing multiplexing capacity for complex trait stacks [10]. The selection between these techniques should be guided by specific analytical needs, considering factors such as required sensitivity, number of targets, available resources, and stage of product development [10].
As GM crops continue to evolve with more sophisticated traits and stacked characteristics, advances in both technologies will further enhance our ability to comprehensively characterize protein expression [10]. The integration of proteomic data with other omics approaches will provide increasingly robust safety assessment frameworks, ensuring the continued responsible development of agricultural biotechnology products [43] [47].
High-throughput proteomics is undergoing a revolutionary transformation, driven by innovations that simultaneously enhance multiplexing capacity, analytical speed, and detection sensitivity. This evolution is critical for advancing biomedical research and therapeutic development, as proteins represent the functional effectors in biological systems and primary targets for most pharmaceuticals. The field is currently characterized by two complementary technological approaches: affinity-based immunoassays and mass spectrometry (MS)-based methods. While immunoassays leverage antibody-antigen recognition for highly specific protein detection, mass spectrometry provides untargeted discovery capabilities through precise mass-to-charge ratio measurements of ionized peptides [48] [49]. Recent advancements in both domains are pushing the boundaries of what can be achieved in proteomic analysis, enabling researchers to quantify thousands of proteins across numerous samples with unprecedented depth and precision. These technological strides are particularly impactful for drug development, where understanding protein dynamics, post-translational modifications, and complex biological pathways is essential for identifying valid therapeutic targets and biomarkers [50]. This guide provides a comprehensive comparison of current high-throughput proteomics platforms, examining their performance characteristics, experimental requirements, and suitability for different research applications within the context of a comparative study between immunoassay and mass spectrometry methodologies.
Comparative Analysis of High-Throughput Proteomic Platforms
The table below summarizes the key performance characteristics of major proteomic technologies available in 2025, highlighting innovations in multiplexing and speed:
Table 1: Performance Comparison of High-Throughput Proteomic Platforms
| Technology/Platform | Method Principle | Multiplexing Capacity | Sensitivity | Key Performance Metrics | Best Applications |
|---|---|---|---|---|---|
| Orbitrap Astral Zoom MS [51] [52] | High-resolution accurate mass spectrometry | Not explicitly stated (untargeted) | Increased sensitivity (specifics not provided) | 35% faster scan speeds, 40% higher throughput, 50% expanded multiplexing | Deep quantitation, biomarker discovery, biopharma applications |
| Orbitrap Excedion Pro MS [51] | Orbitrap hybrid MS with alternative fragmentation | Not explicitly stated (untargeted) | Enhanced sensitivity | Combines Orbitrap MS with alternative fragmentation technologies | Biotherapeutic characterization (mAbs), post-translational modification analysis |
| nELISA/CLAMP [53] | DNA-mediated bead-based sandwich immunoassay | 191-plex panel demonstrated | Sub-pg/mL sensitivity across 7 orders of magnitude | Eliminates reagent cross-reactivity, high-throughput compatible | High-fidelity phenotypic screening, inflammatory secretome profiling |
| Olink [48] [50] | Proximity Extension Assay (PEA) | 92-plex inflammation panel used in studies | High sensitivity (specifics not provided) | Exceptional specificity and sensitivity, requires smaller sample volumes | Biomarker studies, large-scale proteomic cohorts |
| NULISA [48] | Nucleic Acid Linked Immuno-Sandwich Assay | 250-plex inflammation panel | Attomolar sensitivity reported | High multiplexing with minimal sample volume | High-plex analysis from limited samples (e.g., tape strips) |
| Meso Scale Discovery (MSD) [48] | Electrochemiluminescence immunoassay | 43-plex custom panel used in studies | Highest sensitivity among compared immunoassays | Detected 70% of shared proteins vs. 30% for NULISA and 16.7% for Olink | Absolute protein quantification, samples with variable content |
| ZenoTOF 8600 [54] [52] | Time-of-flight mass spectrometry with Zeno trap | Not explicitly stated (untargeted) | Up to 30x higher sensitivity than predecessor | Up to 10x sensitivity gains in lipidomics/metabolomics | Metabolomics, lipidomics, small molecule analysis |
| timsTOF Systems [54] | Trapped ion mobility spectrometry with TOF | Not explicitly stated (untargeted) | Breakthrough sensitivity for small molecules | Enhanced ion mobility separation, 4D-proteomics | Metabolomics, lipidomics, single-cell proteomics |
Detailed Technology Assessments
Mass Spectrometry Innovations
Recent advancements in mass spectrometry have dramatically improved analysis speed and depth of coverage for proteomic studies. Thermo Fisher Scientific's Orbitrap Astral Zoom mass spectrometer, introduced at ASMS 2025, represents a significant leap forward with 35% faster scan speeds, 40% higher throughput, and 50% expanded multiplexing capabilities compared to its predecessor [51] [52]. These improvements enable researchers to process large sample sets more efficiently; for example, analysis of 6,000 patient research samples can now be completed in approximately 100 days instead of 1,000 days [52]. The platform's enhanced sensitivity and analytical coverage allow researchers to extract richer data from limited sample material, accelerating discoveries in precision medicine and complex diseases like Alzheimer's and cancer [51].
The Orbitrap Excedion Pro MS addresses specific needs in biopharmaceutical development, particularly for characterizing complex biomolecules like monoclonal antibodies (mAbs) [51]. As the first platform to combine next-generation Orbitrap hybrid mass spectrometry with alternative fragmentation technologies, it provides deeper insights into therapeutic proteins, oligonucleotides, and fusion proteins. This system delivers faster, higher-quality protein and post-translational modification data, supporting drug development across cardiology, neurology, and oncology [51] [52].
Alternative MS platforms have also demonstrated substantial improvements. Bruker's timsMetabo mass spectrometer provides breakthrough sensitivity, separation, and annotation confidence for 4D-metabolomics and 4D-lipidomics, while SCIEX's ZenoTOF 8600 system offers up to 30x higher sensitivity than previous models, enabling quantification of previously undetectable low-level metabolites [54] [52].
Advanced Multiplexed Immunoassays
Multiplexed immunoassays have made remarkable progress in overcoming traditional limitations of reagent-driven cross-reactivity (rCR), which has historically restricted multiplexing beyond ~25-plex [53]. The novel nELISA platform exemplifies this progress by integrating a CLAMP (colocalized-by-linkage assays on microparticles) design with an advanced multicolor bead barcoding system called emFRET [53]. This innovative approach preassembles antibody pairs on target-specific barcoded beads, ensuring spatial separation between noncognate assays. Detection employs toehold-mediated strand displacement, where fluorescently labeled DNA oligos simultaneously untether and label detection antibodies. This methodology achieves sub-picogram-per-milliliter sensitivity across seven orders of magnitude, enabling high-fidelity profiling of 191 proteins across 7,392 samples in under one week [53].
Comparative studies evaluating immunoassay performance have revealed significant differences in detection capabilities. A 2025 study comparing MSD, NULISA, and Olink platforms for analyzing protein markers in challenging stratum corneum tape strip samples found that MSD demonstrated the highest sensitivity, detecting 70% of shared proteins, followed by NULISA (30%) and Olink (16.7%) [48]. The study examined 30 shared proteins across platforms and found that four proteins (CXCL8, VEGFA, IL18, and CCL2) were detected by all three platforms with good correlation (interclass correlation coefficients 0.5-0.86). MSD provided the additional advantage of absolute protein concentrations, enabling normalization for variable sample content, while NULISA and Olink required smaller sample volumes and fewer assay runs [48].
Experimental Protocols and Methodologies
Standardized Workflows for High-Throughput Proteomics
The reliability of proteomic data heavily depends on standardized experimental protocols and appropriate data analysis workflows. For mass spectrometry-based approaches, particularly Data-Independent Acquisition (DIA) methods, specialized informatics solutions are essential for accurate protein identification and quantification.
Table 2: Key Research Reagent Solutions for High-Throughput Proteomics
| Reagent/Material | Function | Application Examples |
|---|---|---|
| DNA-barcoded beads [53] | Spatial separation of immunoassays to prevent cross-reactivity | nELISA platform for high-plex protein detection |
| Phosphate-buffered saline with Tween 20 [48] | Protein extraction buffer for challenging samples | Extraction of proteins from stratum corneum tape strips |
| Spectral libraries [55] | Reference for peptide identification in DIA-MS | DIA-NN, Spectronaut, and PEAKS software analysis |
| Post-translational modification-specific antibodies [53] | Detection of specific protein modifications | CLAMP assays for phosphorylated proteins (e.g., phospho-RELA) |
| Stable isotope-labeled standards | Absolute quantification of proteins and peptides | Mass spectrometry-based precise quantification |
| emFRET barcoding system [53] | High-density bead multiplexing with four fluorophores | nELISA platform enabling 384 distinct barcodes |
DIA-MS Single-Cell Proteomics Workflow
A comprehensive benchmarking study published in Nature Communications in 2025 evaluated informatics workflows for data-independent acquisition single-cell proteomics [55]. The experimental protocol involved:
Sample Preparation: Simulated single-cell-level proteome samples were constructed using tryptic digests of human HeLa cells, yeast, and Escherichia coli proteins with different composition ratios. The total protein abundance injected into the LC-MS/MS system was 200 pg to mimic low input for single-cell proteome analysis.
LC-MS/MS Analysis: Samples were analyzed by diaPASEF using a timsTOF Pro 2 mass spectrometer with six technical replicates (repeated injections) for each sample.
Data Analysis Strategies: Three popular DIA data analysis software tools (DIA-NN, Spectronaut, and PEAKS Studio) were compared using multiple spectral library strategies:
- Sample-specific spectral libraries built from DDA data
- Public spectral libraries from community resources
- Library-free analysis using predicted spectral libraries
Performance Evaluation: Tools were benchmarked on identification coverage, quantitative accuracy and precision, missing value rates, and ability to handle the unique features of single-cell data, such as loss of fragment ions and blurred boundaries between analyte signals and background [55].
The study found that Spectronaut's directDIA workflow quantified the highest number of proteins and peptides (3066 ± 68 proteins and 12,082 ± 610 peptides per run), while DIA-NN showed advantages in quantitative accuracy, and PEAKS performed well in proteome coverage with sample-specific spectral libraries [55].
Diagram 1: Comparative proteomics workflows showing parallel processes for mass spectrometry and immunoassay approaches. MS workflows involve sample digestion, separation, ionization, and data interpretation, while immunoassays rely on antibody binding and signal detection.
Analytical Framework for Technology Selection
Application-Based Platform Selection
Choosing the appropriate proteomic technology requires careful consideration of research objectives, sample characteristics, and analytical requirements. The following guidelines can assist researchers in selecting optimal platforms:
For Discovery Proteomics and Unknown Biomarker Identification: Mass spectrometry approaches, particularly Orbitrap Astral Zoom and timsTOF systems, offer superior capabilities due to their untargeted nature and ability to detect unexpected protein modifications or variants without prior knowledge of targets [51] [54] [52].
For High-Throughput Targeted Analysis of Known Panels: Immunoassay platforms such as nELISA, MSD, and Olink provide advantages in throughput, sensitivity, and cost-efficiency when analyzing predefined protein sets across thousands of samples [53] [48] [50].
For Analysis of Complex Matrices with Limited Sample Volume: NULISA and Olink platforms require smaller sample volumes, making them suitable for precious samples with limited availability, while MSD provides superior sensitivity for challenging samples like tape strips [48].
For Biotherapeutic Characterization and Post-Translational Modification Analysis: Orbitrap Excedion Pro MS offers specialized capabilities for characterizing monoclonal antibodies, fusion proteins, and post-translational modifications through its combination of Orbitrap technology with alternative fragmentation methods [51].
Critical Considerations for Experimental Design
Several factors must be addressed when designing high-throughput proteomic studies:
Batch Effects and Normalization: Systematic differences across batches can lead to data biases mistaken for biological variation. Implementation of appropriate normalization strategies and batch effect correction methods is essential, particularly for large-scale studies [55].
Missing Value Handling: In single-cell proteomics and analyses with limited sample material, missing values tend to be more prevalent as protein abundance approaches detection limits. Selection of appropriate imputation methods significantly impacts downstream analysis [55].
Platform-Specific Strengths: Rather than seeking a universal "best" platform, researchers should match technology strengths to specific applications. For example, MSD provides absolute quantification advantageous for samples with variable protein content, while nELISA offers exceptional multiplexing without cross-reactivity [53] [48].
Diagram 2: Proteomics platform selection guide based on research objectives, showing pathway from study goal to appropriate technology choices for discovery, targeted, and specialized applications.
The field of high-throughput proteomics continues to evolve rapidly, with significant innovations in both mass spectrometry and immunoassay technologies driving improvements in multiplexing capacity, analytical speed, and detection sensitivity. Mass spectrometry platforms like the Orbitrap Astral Zoom and timsTOF systems offer increasingly deep coverage and quantitative precision for discovery proteomics, while advanced immunoassay systems including nELISA, MSD, and NULISA provide exceptional sensitivity and throughput for targeted applications. Rather than representing competing alternatives, these technological approaches offer complementary strengths that researchers can leverage based on specific study requirements. The ongoing development of standardized workflows, improved data analysis algorithms, and benchmarked experimental protocols further enhances the reliability and reproducibility of proteomic data. As these technologies continue to mature and integrate with other omics approaches, they promise to unlock new insights into protein biology and accelerate the development of novel therapeutics across diverse disease areas.
The accurate quantification of specific proteins is a cornerstone of biological research, clinical diagnostics, and biopharmaceutical development. Researchers face a fundamental choice between two powerful analytical platforms: immunoassays and mass spectrometry (MS). Each technique offers distinct advantages and limitations, but no single method is universally superior for all applications. Immunoassays, which rely on specific antibody-antigen interactions, have been the workhorse of protein quantification for decades due to their efficiency, adaptability, and established credibility in various industries [10]. In contrast, mass spectrometry has emerged as a powerful alternative, providing unparalleled specificity through direct measurement of protein mass and sequence [56].
The expanding complexity of scientific questions—from analyzing multi-protein complexes in drug development to validating biomarkers in clinical samples—demands a more nuanced selection process than simply choosing the most sensitive or accessible technology. This guide provides an objective, application-driven framework for selecting between immunoassay and mass spectrometry approaches, supported by comparative experimental data and detailed methodological protocols. By matching technical capabilities to specific research requirements, scientists can optimize their experimental outcomes while efficiently allocating resources.
Technical Principles and Core Methodologies
Immunoassay Platforms: Antibody-Based Detection
Immunoassays quantify proteins through the specific binding between antibodies and their target antigens. The most common format, sandwich enzyme-linked immunosorbent assay (ELISA), employs two antibodies that recognize different epitopes on the target protein: a capture antibody immobilized on a solid surface and a detection antibody conjugated to an enzyme or other signaling molecule [10] [57]. The detection system generates a measurable signal (colorimetric, fluorescent, or chemiluminescent) proportional to the amount of captured protein, which is quantified against a standard curve of known concentrations.
Newer immunoassay technologies offer enhanced capabilities. Meso Scale Discovery (MSD) utilizes electrochemiluminescence detection with carbon electrode-integrated microplates, providing exceptional sensitivity (ultra-low picogram level detection) and a wide dynamic range of up to five orders of magnitude [10]. Luminex xMAP technology employs antibody-linked color-coded magnetic microbeads, enabling multiplexed quantification of hundreds of analytes simultaneously in a single sample [10]. These platforms maintain the fundamental antibody-based detection principle while improving throughput, sensitivity, and multiplexing capacity.
Mass Spectrometry Platforms: Mass-Based Identification and Quantification
Mass spectrometry identifies and quantifies proteins by measuring the mass-to-charge ratios of ionized peptides derived from enzymatic digestion (typically trypsin) of protein samples. In liquid chromatography-tandem mass spectrometry (LC-MS/MS), peptides are separated by liquid chromatography before ionization and mass analysis [10] [56]. The first mass analyzer selects precursor ions of specific masses, which are then fragmented in a collision cell, and the resulting fragment ions are analyzed by a second mass analyzer.
Targeted MS approaches, such as multiple reaction monitoring (MRM), enhance sensitivity and quantification accuracy by focusing on specific precursor-fragment ion pairs (transitions) unique to the target peptides [56]. For absolute quantification, stable isotope-labeled standards (SIS)—synthetic peptides or proteins with identical sequence but heavier isotopes—are spiked into samples at known concentrations, providing internal calibration for precise measurement of endogenous protein levels [56]. This approach compensates for variability in sample preparation and ionization efficiency.
Comparative Performance Analysis
Analytical Performance Parameters
Table 1: Direct Comparison of Immunoassay and Mass Spectrometry Performance Characteristics
| Performance Parameter | Immunoassays | Mass Spectrometry |
|---|---|---|
| Sensitivity | Commercial ELISA: 0.1-1 ng/mL (ppb) [10]MSD: Ultra-low picogram level [10] | Comparable to immunoassays with proper sample preparation [10] |
| Specificity | High, but potentially limited by antibody cross-reactivity [10] | Exceptional, based on mass identification of unique peptides [10] [56] |
| Multiplexing Capacity | Luminex: Hundreds of proteins simultaneously [10]MSD: Up to 10-plex per well [10] | LC-MS/MS: Dozens to hundreds with targeted methods [10] |
| Dynamic Range | ELISA: 2-3 orders of magnitude [10]MSD/Luminex: Up to 5 orders of magnitude [10] | Typically 2-3 orders of magnitude, depending on instrumentation [58] |
| Sample Throughput | High (amenable to automation) [10] | Moderate (LC separation limits throughput) [59] |
| Development Time | Lengthy due to antibody production and optimization [10] | Method development faster with available instrumentation [10] |
| Assay Cost | Lower operational cost, higher reagent cost | Higher instrumentation cost, lower per-sample cost at scale |
Experimental Evidence from Direct Comparisons
A comprehensive 2025 study directly compared immunoassay and mass spectrometry performance for plasma proteomics, analyzing 88 samples with both Olink Explore 3072 proximity extension assays (immunoassay platform) and HiRIEF LC-MS/MS [59]. The platforms demonstrated complementary proteome coverage, with Olink detecting more low-abundance proteins and MS providing better coverage of mid-to-high abundance proteins (see Figure 1). Quantitative agreement between platforms was moderate (median correlation: 0.59), influenced primarily by technical factors rather than biological variables [59].
Table 2: Application-Based Method Selection Guide
| Research Application | Recommended Technique | Supporting Evidence |
|---|---|---|
| High-Throughput Clinical Screening | Immunoassays (especially automated platforms) | Higher throughput, lower operational complexity [24] |
| Biomarker Verification | Mass spectrometry | Superior specificity for distinguishing homologous proteins and modified proteoforms [10] [59] |
| Multiplexed Analysis of Limited Sample | Immunoassays (Luminex, MSD) or Targeted MS | Highest multiplexing capabilities with minimal sample consumption [10] |
| Absolute Quantification | Mass spectrometry with SIS | Unmatched accuracy with isotope dilution [56] |
| Low-Abundance Protein Detection | Immunoassays (MSD, SERS) | Potentially higher sensitivity for certain targets [10] [57] |
| Analysis of Protein Modifications | Mass spectrometry | Direct identification of PTMs without specific reagents [50] |
A 2024 methodological comparison for urinary free cortisol measurement demonstrated that while newer direct immunoassays showed strong correlation with LC-MS/MS (Spearman coefficient r = 0.950-0.998), all immunoassays exhibited proportional positive biases compared to the MS reference method [24]. Despite these biases, immunoassays maintained high diagnostic accuracy for Cushing's syndrome (AUC >0.95), highlighting that the choice between techniques may depend on whether absolute accuracy or clinical discrimination is the primary objective [24].
Experimental Protocols for Implementation
Standard Sandwich ELISA Protocol
Principle: A capture antibody specific to the target protein is immobilized on a microplate. The sample containing the analyte is added, followed by a detection antibody that binds to a different epitope on the captured protein. The detection antibody is linked to an enzyme (e.g., horseradish peroxidase) that catalyzes a colorimetric, fluorescent, or chemiluminescent reaction proportional to the analyte concentration [10] [57].
Key Reagents:
- Coating Buffer ( carbonate-bicarbonate buffer, pH 9.6)
- Capture Antibody (target protein-specific)
- Blocking Buffer (BSA or casein in PBS)
- Protein Standards (purified target protein for calibration curve)
- Detection Antibody (enzyme-conjugated, target-specific)
- Wash Buffer (PBS with 0.05% Tween-20)
- Substrate Solution (TMB for colorimetric, AMPPD for chemiluminescent)
- Stop Solution (acid for colorimetric assays)
Step-by-Step Workflow:
- Coat plate with capture antibody in coating buffer, incubate overnight at 4°C
- Wash 3× with wash buffer, block with blocking buffer for 1-2 hours at room temperature
- Wash 3×, add standards and samples, incubate 2 hours at room temperature
- Wash 3×, add detection antibody, incubate 1-2 hours at room temperature
- Wash 3×, add substrate solution, incubate 15-30 minutes
- Add stop solution (if required), measure absorbance/fluorescence/luminescence
- Generate standard curve, interpolate sample concentrations
Critical Validation Parameters:
- Standard curve linearity (R² > 0.99)
- Intra- and inter-assay precision (CV < 15%)
- Spike recovery (80-120%)
- Limit of detection and quantification
Targeted Mass Spectrometry Protocol with SIS
Principle: Proteins are enzymatically digested into peptides, and stable isotope-labeled internal standards are added for precise quantification. Liquid chromatography separates peptides, which are then ionized and analyzed by tandem mass spectrometry. Quantification is achieved by comparing the signal intensity of endogenous peptides to their isotope-labeled counterparts [56] [58].
Key Reagents:
- Lysis Buffer (compatible with downstream digestion)
- Reduction/Alkylation Reagents (DTT/TCEP and iodoacetamide)
- Proteolytic Enzyme (typically trypsin)
- Stable Isotope-Labeled Standards (SIS peptides)
- LC-MS Grade Solvents (water, acetonitrile with 0.1% formic acid)
Step-by-Step Workflow:
- Extract proteins from sample matrix using appropriate lysis buffer
- Reduce disulfide bonds (5 mM DTT, 30 min at 60°C)
- Alkylate cysteine residues (15 mM iodoacetamide, 30 min in dark)
- Digest proteins with trypsin (0.3 units/μg protein, 37°C for 20 hours)
- Add stable isotope-labeled internal standard peptides
- Desalt peptides using C18 solid-phase extraction
- Separate peptides by reversed-phase nanoLC
- Analyze by tandem MS with multiple reaction monitoring (MRM)
- Quantify by comparing peak areas of endogenous and labeled peptides
Critical Validation Parameters:
- Retention time stability (CV < 1%)
- Ion ratio consistency (< 20% deviation from standard)
- Intra- and inter-assay precision (CV < 20%)
- Linearity of calibration curves (R² > 0.99)
- Lower limit of quantification (signal-to-noise > 10)
Research Reagent Solutions Toolkit
Table 3: Essential Research Reagents for Protein Quantification
| Reagent Category | Specific Examples | Function | Technical Considerations |
|---|---|---|---|
| Antibodies | Capture and detection antibody pairs | Specific molecular recognition | Critical for immunoassay specificity; requires validation for cross-reactivity [10] |
| Protein Standards | Recombinant purified proteins | Calibration curve generation | Must be highly pure and accurately quantified [10] |
| Stable Isotope-Labeled Standards | SIS peptides or proteins | Internal standardization for MS | Should be added early in workflow to account for preparation variability [56] |
| Enzymes | Trypsin, Lys-C | Protein digestion for MS | Requires optimization of enzyme-to-substrate ratio and incubation time [58] |
| Chromatographic Media | C18 stationary phase | Peptide separation | Particle size and pore structure impact resolution and sensitivity [56] |
| Signal Generation Reagents | TMB, ECL substrates | Signal amplification in immunoassays | Selection impacts sensitivity and dynamic range [57] |
Decision Framework and Future Perspectives
The choice between immunoassays and mass spectrometry should be guided by a systematic evaluation of research requirements. Immunoassays are preferable when high throughput, maximum sensitivity, or operational simplicity are primary concerns, particularly for established biomarkers with well-characterized antibody reagents. Mass spectrometry excels when absolute quantification, specificity for homologous proteins, detection of post-translational modifications, or multiplexed analysis without predetermined targets is required [10] [56].
Emerging technologies are bridging the historical gaps between these platforms. Surface-enhanced Raman spectroscopy (SERS) detection for immunoassays offers potentially 1.5-2 orders of magnitude lower limits of detection compared to conventional fluorescence-based immunoassays [57]. Benchtop protein sequencers are making protein characterization more accessible without specialized MS operation expertise [50]. Meanwhile, improvements in MS sensitivity and throughput are expanding its applicability to lower-abundance proteins and larger sample cohorts [59] [50].
For the most challenging analytical requirements, a combined approach leveraging both technologies may be optimal. Immunoassays can provide initial screening with high sensitivity, while mass spectrometry offers orthogonal verification with superior specificity. As the proteomics field continues to advance, this application-driven framework will enable researchers to select the most appropriate technology based on their specific protein quantification needs, rather than defaulting to familiar but potentially suboptimal methodologies.
Overcoming Challenges: Strategies for Enhanced Accuracy and Reproducibility
Addressing Cross-Reactivity in Immunoassays and Interference in MS
The accurate quantification of specific proteins is a cornerstone of biomedical research, clinical diagnostics, and drug development. Two principal analytical techniques dominate this field: immunoassays and mass spectrometry (MS). Immunoassays, leveraging the specific binding between antibodies and antigens, are prized for their high throughput, sensitivity, and relative ease of use [10]. Mass spectrometry, particularly liquid chromatography-tandem mass spectrometry (LC-MS/MS), separates and detects molecules based on their mass-to-charge ratio, offering high specificity and the ability to multiplex [60] [10]. A critical challenge for both methods is the potential for analytical interference, which can compromise result accuracy. For immunoassays, cross-reactivity with structurally similar compounds is a major source of false positives [61] [62]. Mass spectrometry, while highly specific, is not immune to issues such as ion suppression or isobaric interference from compounds with nearly identical mass [63]. This guide provides a comparative analysis of these interferences, supported by experimental data, to inform method selection for protein quantification research.
Cross-Reactivity in Immunoassays: Mechanisms and Data
Immunoassay interference arises from substances that alter the measurable concentration of the analyte or disrupt antibody binding [62]. A primary source is cross-reactivity, where antibodies bind to non-target molecules that share structural similarities with the target analyte [62]. This is a well-documented issue in urine drug screening (UDS), where a positive immunoassay result for a drug class (e.g., amphetamines) can be caused by off-target medications [61] [64]. Other endogenous interferents include heterophile antibodies, human anti-animal antibodies, and rheumatoid factor, which can bridge capture and detection antibodies in immunometric assays, leading to falsely elevated results [62]. Furthermore, sample conditions like hemolysis (red blood cell breakdown), icterus (high bilirubin), and lipemia (high lipids) can also cause significant analytical errors in many immunoassay systems [65] [66].
Experimental Data on Immunoassay Cross-Reactivity
A multicenter comparison of 25-OH vitamin D immunoassays from four major manufacturers (Abbott, Beckman Coulter, Roche, Siemens) quantified interference from endogenous substances and the cross-reactive metabolite 3-epi-25-OH-vitamin D3 [65] [66]. The study used residual patient samples with known interferents and samples spiked with 3-epi-25-OH-D3.
Table 1: Interferences in Vitamin D Immunoassays [65] [66]
| Interference Type | Immunoassay Platforms Affected | Observed Impact |
|---|---|---|
| Hemolysis | Roche | Significant interference |
| Icterus | Beckman Coulter, Siemens | Significant interference |
| Lipemia | All four platforms (Abbott, Beckman, Roche, Siemens) | Significant interference |
| 3-epi-25-OH-D3 Cross-reactivity | Beckman Coulter, Roche | Higher total Vitamin D measurements |
Another study on urinary free cortisol (UFC) immunoassays highlighted how cross-reactivity can be mitigated. Newer, direct immunoassays from Autobio, Mindray, Snibe, and Roche showed strong correlations with LC-MS/MS, a reference method with high specificity [24]. This suggests advancements in antibody engineering have improved specificity, reducing cross-reactivity with other cortisol metabolites, even without organic solvent extraction.
A Novel Approach for Discovering Cross-Reactivities
Traditional discovery of cross-reactivities is inefficient and relies on sporadic case reports [61]. A novel, systematic approach uses data from Electronic Health Records (EHRs) to hypothesize new cross-reactivities. This method involves:
- Data Assembly: Linking large datasets of UDS results to patients' documented medication exposures [61].
- Statistical Analysis: Using logistic regression to quantify the odds of a false-positive screen given previous exposure to a specific drug ingredient [61].
- Experimental Validation: Spiking the identified compounds into drug-free urine and testing them on the UDS immunoassays to confirm cross-reactivity [61]. This data-driven model successfully validated 12 out of 13 hypothesized assay-ingredient pairs, discovering previously unknown cross-reactivities affecting assays for amphetamines, buprenorphine, cannabinoids, and methadone [61].
Diagram 1: EHR-Driven Cross-Reactivity Discovery Workflow.
Interference in Mass Spectrometry: Challenges and Solutions
Interference in MS-Based Quantification
While mass spectrometry is highly specific, its measurements are not immune to interference. A primary challenge is the presence of other molecules in the sample that can co-elute with the target analyte during liquid chromatography and suppress or enhance its ionization, a phenomenon known as matrix effects [63]. In complex biological mixtures, different peptides can have nearly identical mass-to-charge (m/z) ratios, leading to isobaric interference where the signal from a non-target peptide obscures the target [63]. For accurate quantification, software algorithms must carefully detect and filter out these interferences by examining characteristics like peak width, isotope distribution patterns, and retention time [63].
Epimer Interference in Vitamin D Analysis
A specific example of interference in MS is the cross-reactivity with the vitamin D metabolite 3-epi-25-OH-vitamin D3. This epimer has the same molecular weight as 25-OH-vitamin D3 and is present at physiologically high levels in newborns, infants, and pregnant women [65] [66]. In the multicenter vitamin D study, MS methods that did not separate the epimer from the primary 25-OH-vitamin D3 showed significant cross-reactivity. When analyzing Level 4 NIST Standard Reference Material 972a and samples spiked with 3-epi-25-OH-D3, these non-epimer-separating MS methods yielded higher total vitamin D measurements, similar to some immunoassays [65] [66]. This underscores that MS methods must be carefully designed, in this case using chromatographic separation, to resolve epimers and ensure accurate results for specific patient populations.
Direct Comparative Studies: Immunoassay vs. Mass Spectrometry
Vitamin D Analysis
The multicenter study provides a direct comparison of immunoassay and MS performance under interfering conditions. The key findings are summarized below.
Table 2: Comparison of Immunoassay and MS Performance with Interferents [65] [66]
| Analytical Challenge | Immunoassay Performance | Mass Spectrometry Performance | Research Implications |
|---|---|---|---|
| Endogenous Interferents | Affected by hemolysis, icterus, lipemia (varies by platform). | Generally more resistant to these common sample interferences. | MS is preferable for samples of poor quality or with visible lipemia. |
| Metabolite Cross-reactivity | Beckman & Roche showed high cross-reactivity with 3-epi-25-OH-D3. | Non-epimer-separating MS methods also showed high cross-reactivity. | MS methods must be validated for epimer separation for pediatric/prenatal research. |
| Overall Specificity | Variable; improvement in bias limits is required. | High, but dependent on chromatographic separation. | MS provides superior specificity when methods are optimally configured. |
Salivary Sex Hormone Analysis
A comparative study of salivary sex hormones (estradiol, progesterone, testosterone) found a strong between-methods relationship for testosterone only when comparing ELISA and LC-MS/MS [41]. For estradiol and progesterone, the ELISA showed much lower validity. Furthermore, machine-learning classification models revealed better results with LC-MS/MS, and only LC-MS/MS showed the expected physiological differences in estradiol and testosterone levels between groups of women [41]. This demonstrates that for low-concentration analytes in complex matrices like saliva, the superior specificity of LC-MS/MS is critical for generating valid biological data.
Urinary Free Cortisol Analysis
A 2025 study comparing four new direct immunoassays to LC-MS/MS for urinary free cortisol (UFC) found strong correlations (Spearman coefficient r = 0.950 to 0.998) [24]. All immunoassays exhibited a proportional positive bias compared to LC-MS/MS. Despite this bias, the immunoassays demonstrated high diagnostic accuracy for identifying Cushing's syndrome, with areas under the curve (AUC) >0.95 [24]. This indicates that for well-defined clinical applications, modern immunoassays can perform adequately, though method-specific cut-off values must be established.
Experimental Protocols for Interference Testing
Protocol for Evaluating Immunoassay Cross-Reactivity
The following protocol, derived from the reviewed studies, provides a framework for systematically testing immunoassay interference [65] [61] [66].
Sample Collection and Preparation:
- Collect residual patient samples with known interferents: hemolyzed, icteric, lipemic, and those with high rheumatoid factor or from specific patient populations (e.g., myeloma, renal failure) [65] [66].
- Prepare spiked samples by adding known concentrations of potential cross-reactants (e.g., drug metabolites, structurally similar compounds, or epimers like 3-epi-25-OH-D3) to drug-free or pooled matrix [65] [61].
- Use standardized reference materials, such as the NIST Standard Reference Material 972a for vitamin D, which contains characterized levels of metabolites [65] [66].
Experimental Analysis:
- Analyze all prepared samples and a set of control samples using the immunoassay platform(s) under investigation.
- In parallel, analyze the same sample set using a reference method, ideally LC-MS/MS, to establish the "true" analyte concentration [24].
Data Analysis:
- Compare results from interferent-containing samples to control samples and the reference method.
- A significant deviation (e.g., >10% bias) in the test results indicates interference.
- For spiked samples, calculate the apparent concentration of the target analyte caused by the cross-reactant to determine the degree of cross-reactivity.
Protocol for Assessing MS Interference and Specificity
Ensuring specificity in MS methods, particularly for distinguishing between isobaric compounds, requires careful method development [63].
Chromatographic Method Development:
Mass Spectrometric Detection:
- Use tandem mass spectrometry (MS/MS) to monitor multiple fragment ions (transitions) for each analyte.
- For each compound, select one quantitative transition and one or more qualitative transitions. The ratio of these transitions should be consistent across samples and match the ratio from a pure standard.
Data Processing and Interference Detection:
- Use software to examine peak shapes in both the m/z and retention time dimensions.
- Analyze the isotope distribution pattern of the peptide or molecule; a dot-product similarity score can be used to compare the observed pattern to the theoretical one, helping to detect co-eluting interferents [63].
- Monitor the accuracy of the measured peptide mass, which should be highly reproducible even at peak tails.
Diagram 2: Key Steps for Assessing MS Specificity.
Research Reagent Solutions for Protein Quantitation
Table 3: Essential Materials for Immunoassay and MS Protein Quantitation
| Item | Function | Key Considerations |
|---|---|---|
| High-Affinity Antibodies | Core component of immunoassays for specific antigen capture and detection. | Specificity (minimal cross-reactivity) and consistent lot-to-lot supply are critical [10] [62]. |
| Purified Protein Standard | Used to generate a calibration curve for quantitative interpolation. | Must be highly pure and accurately characterized; source (e.g., recombinant) can affect antibody binding [10]. |
| Stable Isotope-Labeled Peptides | Internal standards for MS quantitation; account for sample loss and ionization variability. | Ideally introduced early in the workflow (e.g., SILAC); 13C/15N labels are preferred over deuterium to avoid retention time shifts [63]. |
| LC-MS/MS System | Platform for separating complex mixtures (LC) and specifically identifying/quantifying proteins (MS/MS). | High-resolution mass analyzers (e.g., Orbitrap) and nanoflow LC improve sensitivity and specificity [60] [63]. |
| Specialized Buffers & Blockers | Used in immunoassays to minimize non-specific binding and background signal. | Can include agents to block heterophile antibody interference [62]. |
The choice between immunoassays and mass spectrometry for specific protein quantification is multifaceted. Immunoassays offer high throughput and operational convenience but are susceptible to cross-reactivity and specific matrix effects, which can lead to inaccurate results [65] [62] [66]. Mass spectrometry provides superior specificity and is less affected by common immunoassay interferents, but it requires significant expertise, is lower throughput, and must be meticulously designed to avoid its own forms of interference, such as from isobaric compounds [65] [66] [63].
The decision framework for researchers should be guided by:
- Required Specificity: For measuring specific proteoforms, metabolites, or in the presence of known cross-reactants, LC-MS/MS is the definitive choice.
- Sample Throughput and Cost: For high-volume testing where known interferences are minimal, modern, validated immunoassays can be highly effective and efficient [24].
- Population Context: As demonstrated with pediatric vitamin D testing, the biological context (e.g., high epimer levels) must inform method selection and validation [65] [66].
Ultimately, MS serves as the reference method for validating immunoassays and resolving discrepant results. As both technologies advance—with immunoassays gaining specificity through better antibodies and MS becoming more accessible and high-throughput—their complementary roles in ensuring accurate protein quantification will continue to be essential for rigorous scientific research.
The accurate quantification of specific proteins is a cornerstone of biomedical research and biopharmaceutical development. The fidelity of this quantification is fundamentally dependent on the initial steps of sample preparation, where pre-analytical variables and digestion efficiency play a critical role. Within the field, two principal analytical platforms are employed: immunoassays and mass spectrometry (MS). Immunoassays, including traditional enzyme-linked immunosorbent assays (ELISA) and advanced multiplexing platforms like Meso Scale Discovery (MSD) and Luminex, rely on specific antibody-antigen interactions for protein detection and quantification [10]. Conversely, liquid chromatography-tandem mass spectrometry (LC-MS/MS) separates and detects proteins based on their mass-to-charge ratio, offering high specificity and the ability to multiplex without the need for proprietary antibodies [10].
The choice between these techniques influences every aspect of sample preparation. While immunoassays have historically been the workhorse for protein quantification due to their operational simplicity and high throughput, LC-MS/MS is increasingly adopted for its superior specificity, ability to detect multiple analytes simultaneously, and capacity to provide absolute quantification [10] [40]. This guide provides a objective comparison of these platforms, focusing on how pre-analytical variables and digestion efficiency impact their performance, supported by recent experimental data and detailed methodologies.
Comparative Analysis of Immunoassays and Mass Spectrometry
The selection of an analytical platform involves balancing factors such as specificity, sensitivity, multiplexing capability, and operational requirements. The table below summarizes the core characteristics of immunoassays and mass spectrometry for protein quantification.
Table 1: Core Characteristics of Immunoassays and Mass Spectrometry
| Feature | Immunoassays (e.g., ELISA, MSD, Luminex) | Mass Spectrometry (LC-MS/MS) |
|---|---|---|
| Principle of Detection | Antibody-based binding and signal emission (colorimetric, fluorescent, electrochemiluminescent) [10] | Physical separation by mass and charge; detection based on mass-to-charge ratio [10] |
| Specificity | High, but dependent on antibody quality; potential for cross-reactivity with homologous proteins [10] [24] | Very high; sequence-specific detection minimizes cross-reactivity [10] [28] |
| Sensitivity | Generally high (e.g., ELISA can detect 0.1-1 ng/mL); MSD offers ultralow picogram-level detection [10] | Comparable to immunoassays; capable of low picogram per milliliter levels in plasma [10] [67] |
| Multiplexing Capability | Possible with platforms like MSD and Luminex (up to 10+ analytes simultaneously) [10] [48] | High; can quantify hundreds of proteins in a single run without predefined targets [10] [40] |
| Critical Reagents | Requires a constant supply of high-quality antibodies and purified protein standards [10] | Requires stable isotope-labeled peptide standards and proteolytic enzymes (e.g., trypsin) [28] [67] |
| Sample Throughput | Generally high and amenable to automation [10] | Lower throughput due to longer analysis times, but improving with new workflows [10] [28] |
| Data Output | Relative or absolute concentration (if with standard curve) [10] | Absolute quantification (with internal standards) [28] [40] |
Performance Comparison in Practical Applications
Recent head-to-head studies provide empirical evidence for the relative performance of these techniques across different application fields.
Table 2: Experimental Performance Comparison from Recent Studies
| Application Context | Finding | Implication for Platform Selection |
|---|---|---|
| Diagnosing Cushing's Syndrome (Urinary Free Cortisol) [24] | Four new direct immunoassays showed strong correlation with LC-MS/MS (Spearman r = 0.950-0.998) and high diagnostic accuracy (AUC >0.95). | For well-defined, single-analyte tests, modern immunoassays can perform on par with LC-MS/MS, simplifying workflow by eliminating extraction. |
| Detecting Alzheimer's Pathology (CSF p-tau) [28] | Mass spectrometry and immunoassays for p-tau217 were highly comparable. However, immunoassays for p-tau181 and p-tau231 showed slightly superior performance to MS. | Performance can be analyte-dependent. Immunoassays may retain an advantage for certain specific phosphorylated peptides. |
| Skin Biomarker Analysis (Stratum Corneum) [48] | MSD demonstrated the highest detection sensitivity (70% of proteins) in a challenging low-protein sample, compared to NULISA (30%) and Olink (16.7%). | For low-abundance proteins in complex matrices, the choice of platform (even within immunoassays) critically impacts data quality. |
| Host Cell Protein (HCP) Monitoring [40] | MS provides detailed, sequence-specific detection of HCPs, complementing traditional immunoassays which may lack coverage and specificity. | MS is a powerful orthogonal method for characterizing complex protein impurities where antibody coverage may be incomplete. |
Experimental Protocols for Sample Preparation
The reliability of any protein quantification result is contingent on rigorous and reproducible sample preparation. The protocols below outline typical workflows for both techniques.
Protocol for Immunoassay Sample Preparation (e.g., UFC Extraction)
This protocol is adapted from a method comparison study for urinary free cortisol (UFC) [24].
- Sample Collection: Collect 24-hour urine in an appropriate container. Aliquot and store frozen (e.g., -80°C) until analysis.
- Sample Pre-treatment (Direct Method): For modern immunoassays, samples are often thawed, mixed, and centrifuged to remove particulates. No organic solvent extraction is required, simplifying the workflow [24].
- Analysis:
- Load samples, calibrators, and quality controls onto the automated immunoassay platform (e.g., Autobio A6200, Mindray CL-1200i, Roche e801).
- The instrument automatically performs all incubation and washing steps.
- The signal is measured, and a calibration curve is used to interpolate protein concentrations.
Protocol for Mass Spectrometry Sample Preparation (e.g., CSF p-tau)
This protocol details the sample preparation for quantifying phosphorylated tau in cerebrospinal fluid using LC-MS [28].
- Sample Denaturation and Digestion:
- Internal Standard Addition: Spike a known amount of heavy isotope-labeled peptide standards into 250 µL of CSF sample. This step is critical for absolute quantification [28] [67].
- Protein Precipitation: Add perchloric acid to precipitate the majority of CSF proteins, while tau remains in solution. Vortex, incubate on ice, and centrifuge at 30,000 × g for 10 minutes at 4°C.
- Solid-Phase Extraction (SPE): Transfer the supernatant to a 96-well SPE plate. Wash the plate with 5% methanol and elute the peptides with 50% acetonitrile and 0.1% trifluoroacetic acid.
- Trypsin Digestion: Lyophilize the eluates by vacuum centrifugation. Reconstitute the dry samples in a trypsin solution (2.5 µg/mL in 50 mM ammonium bicarbonate) and incubate at 37°C overnight to digest proteins into peptides [28].
- Liquid Chromatography-Mass Spectrometry Analysis:
- Liquid Chromatography: Inject the tryptic peptides into the LC system. Peptides are separated on a C18 column using a gradient of water and methanol.
- Mass Spectrometry: Analyze the eluting peptides using a high-resolution mass spectrometer (e.g., Orbitrap) in parallel reaction monitoring (PRM) mode. The heavy and light peptides are detected and quantified based on their specific mass transitions [28].
The Scientist's Toolkit: Essential Research Reagents and Materials
Successful execution of protein quantification experiments requires specific, high-quality reagents. The following table lists essential materials for the described protocols.
Table 3: Essential Reagents and Materials for Protein Quantification
| Item | Function/Description | Typical Application |
|---|---|---|
| High-Affinity Antibodies | Bind specifically to the target protein (capture) and a second epitope (detection) for sandwich immunoassays [10]. | Immunoassays (ELISA, MSD, Luminex) |
| Purified Protein Standard | A characterized standard used to generate a calibration curve for interpolating sample concentrations [10]. | Immunoassays |
| Stable Isotope-Labeled Peptide Standards (AQUA Peptides) | Heavy isotope-labeled internal standards that behave identically to the target analyte but are distinguishable by MS; essential for absolute quantification [28]. | Mass Spectrometry |
| Trypsin (Sequencing Grade) | A proteolytic enzyme that cleaves proteins at specific amino acid residues (lysine and arginine) to generate peptides for MS analysis [28]. | Mass Spectrometry |
| Solid-Phase Extraction (SPE) Plates | Used to desalt and concentrate peptide samples prior to LC-MS analysis, improving sensitivity and signal-to-noise ratio [28]. | Mass Spectrometry |
| Digestion Acids (e.g., Nitric Acid, Aqua Regia) | Mineral acids used to decompose organic matrices in solid samples (e.g., tissue) for elemental or metal-bound protein analysis via ICP-MS or AAS [68] [69]. | Elemental Analysis / Sample Digestion |
| Magnetic Microbeads (Luminex) | Color-coded beads coated with capture antibodies, enabling multiplexed analysis of many analytes in a single well [10]. | Multiplex Immunoassays |
| SULFO-TAG Labels (MSD) | Electrochemiluminescent labels that emit light upon electrochemical stimulation, providing high sensitivity and a wide dynamic range [10]. | MSD Immunoassays |
The optimization of sample preparation is a critical determinant of success in protein quantification. The choice between immunoassays and mass spectrometry is not a matter of declaring one universally superior, but rather of selecting the right tool for the specific research question, analyte, and resource context. Immunoassays offer robust, high-throughput, and relatively simple workflows, making them ideal for routine analysis of single or a few well-defined analytes, particularly in clinical settings [24]. Mass spectrometry, while often more complex and requiring specialized expertise, provides unrivalled specificity, the potential for discovery, and the ability to multiplex extensively without antibody interference, making it powerful for complex impurity profiling [40], biomarker verification [67], and when absolute quantification is required [28].
As both technologies continue to evolve—with immunoassays achieving higher sensitivity and mass spectrometry becoming more accessible and high-throughput—the trend is toward their complementary use. Integrating both platforms within a development or research pipeline can provide a comprehensive and orthogonal validation strategy, ensuring the highest data quality and confidence in results for researchers and drug development professionals.
Accurate protein and hormone quantification in complex biological matrices represents a fundamental challenge in biomedical research and drug development. The selection of an appropriate analytical technique directly impacts the reliability of data, the validity of scientific discoveries, and ultimately, clinical decision-making. Within this context, a significant comparative focus has emerged between immunoassays and liquid chromatography-tandem mass spectrometry (LC-MS/MS). Immunoassays, utilizing antibodies for detection, have been widely adopted in clinical laboratories due to their automation-friendly workflows and high throughput. In contrast, LC-MS/MS offers an alternative approach with potentially superior specificity by separating and detecting analytes based on their mass-to-charge ratios. The central thesis of this guide is that while both techniques have distinct places in the researcher's toolkit, LC-MS/MS provides demonstrably superior analytical validity for specific protein quantification, particularly in research settings where maximum accuracy is paramount. This guide provides an objective comparison of their performance, supported by recent experimental data, to inform method selection for researchers and scientists.
Methodological Comparison: Core Techniques and Workflows
Immunoassay Techniques
Immunoassays are biochemical methods that use the specific binding between an antibody and its target antigen for quantification. The most common formats are:
- Enzyme-Linked Immunosorbent Assay (ELISA): A plate-based technique where an enzyme-conjugated antibody produces a measurable signal proportional to the analyte concentration [41].
- Chemiluminescence Immunoassay (CLIA): Utilizes enzyme-triggered light emission as the detection signal, often providing a broader dynamic range than colorimetric ELISA [24].
- Electrochemiluminescence Immunoassay (ECLIA): A technology that uses electrochemical reactions to trigger light emission, known for high sensitivity and robustness [24].
A fundamental limitation of these platforms is their susceptibility to interference. Antibodies may cross-react with structurally similar molecules or metabolites, leading to overestimation. Furthermore, endogenous components in samples, such as heterophile antibodies or autoantibodies, can bind to reagent antibodies, causing either falsely elevated or suppressed results [70]. For instance, anti-reagent antibodies can bridge capture and detection antibodies in a sandwich assay, generating a signal in the absence of the target analyte, which can lead to serious clinical misinterpretation [70].
Liquid Chromatography-Tandem Mass Spectrometry (LC-MS/MS)
LC-MS/MS is a hyphenated technique that combines the physical separation capability of liquid chromatography with the high specificity and sensitivity of mass spectrometry.
- Liquid Chromatography (LC): Separates analytes from a complex sample matrix based on their chemical properties, reducing ion suppression and interferences.
- Tandem Mass Spectrometry (MS/MS): The separated analytes are ionized and filtered in the first mass analyzer, fragmented in a collision cell, and the resulting characteristic fragments are analyzed in a second mass analyzer. This provides a highly specific "fingerprint" for the target molecule [71].
The process involves digesting proteins into peptides, separating them via LC, and then quantifying them based on the intensity of specific precursor and fragment ion signals (XICs - Extracted Ion Chromatograms) [71]. This method is less susceptible to structural cross-reactivity because it identifies molecules based on a combination of retention time, parent mass, and fragment ion spectrum.
The experimental workflows for both techniques are summarized in the diagram below, highlighting key procedural differences.
Comparative Performance Data from Recent Studies
Direct comparative studies reveal critical differences in the performance of immunoassays and LC-MS/MS across various analytes and sample types. The following tables summarize quantitative findings from recent investigations.
Table 1: Comparison of Immunoassays and LC-MS/MS for Salivary Sex Hormone Quantification in Healthy Adults [41]
| Hormone | Technique | Key Performance Finding | Between-Methods Relationship |
|---|---|---|---|
| Testosterone | ELISA | Poor validity compared to LC-MS/MS | Strong |
| Testosterone | LC-MS/MS | Superior performance; shows expected differences in women | Strong |
| Estradiol | ELISA | Much less valid than LC-MS/MS | Weak/Poor |
| Estradiol | LC-MS/MS | Superior performance with machine-learning models | Weak/Poor |
| Progesterone | ELISA | Much less valid than LC-MS/MS | Weak/Poor |
| Progesterone | LC-MS/MS | Superior performance | Weak/Poor |
Table 2: Diagnostic Performance of Four New Direct Immunoassays for Urinary Free Cortisol vs. LC-MS/MS [24]
| Immunoassay Platform | Correlation with LC-MS/MS (Spearman r) | Area Under Curve (AUC) for Cushing's Diagnosis | Sensitivity (%) | Specificity (%) |
|---|---|---|---|---|
| Autobio A6200 | 0.950 | 0.953 | 89.66 - 93.10 | 93.33 - 96.67 |
| Mindray CL-1200i | 0.998 | 0.969 | 89.66 - 93.10 | 93.33 - 96.67 |
| Snibe MAGLUMI X8 | 0.967 | 0.963 | 89.66 - 93.10 | 93.33 - 96.67 |
| Roche 8000 e801 | 0.951 | 0.958 | 89.66 - 93.10 | 93.33 - 96.67 |
The data in Table 1 underscores a fundamental finding: while testosterone measurement by ELISA may show a strong correlation with LC-MS/MS, the validity of ELISA for estradiol and progesterone is considerably lower. This study concluded that despite its technical challenges, LC-MS/MS was superior for salivary sex steroid profiling in healthy adults [41]. Table 2 shows that newer immunoassay platforms can demonstrate very strong correlations with LC-MS/MS for urinary free cortisol and maintain high diagnostic accuracy. However, a consistent finding across studies is that immunoassays often exhibit a proportionally positive bias, meaning they tend to report higher concentrations than LC-MS/MS, likely due to cross-reactivity with metabolite compounds [24]. This highlights the critical need for method-specific reference ranges.
The Scientist's Toolkit: Essential Research Reagent Solutions
Selecting the appropriate reagents and materials is fundamental to the success of any quantification experiment. The following table details key solutions used in the featured techniques.
Table 3: Essential Research Reagents and Materials for Protein Quantification
| Item | Function/Description | Primary Application |
|---|---|---|
| High-Specificity Antibodies | Bind target analyte with minimal cross-reactivity; the core of any immunoassay. | Immunoassays (ELISA, CLIA) |
| Calibrators & Controls | Standardize instrument response and validate assay performance across runs; traceability to reference materials (e.g., NIST 921) is key [24]. | Immunoassays & LC-MS/MS |
| Tryptic Digest Enzymes | Protease that cleaves proteins into predictable peptides for bottom-up proteomics analysis. | LC-MS/MS Sample Prep |
| Stable Isotope-Labeled Internal Standards | Labeled analogs of the target analyte that correct for sample loss and ion suppression, enabling highly precise quantification. | LC-MS/MS |
| LC Columns (e.g., C8, C18) | Chromatographic medium that separates peptides based on hydrophobicity prior to mass spec analysis. | LC-MS/MS |
| Solid-Phase Extraction (SPE) Plates | Used to clean up samples, remove interfering salts, and concentrate analytes for improved sensitivity. | LC-MS/MS Sample Prep |
Experimental Protocols for Key Comparative Studies
To ensure reproducibility and a deep understanding of the generated data, the methodologies from the pivotal studies cited herein are detailed below.
- Sample Collection: Saliva samples were collected from three cohorts: 72 combined oral contraceptive users, 99 naturally cycling women (in early follicular and pre-ovular phases), and 47 men.
- Sample Analysis: Each sample was analyzed in parallel using two techniques:
- ELISA: Commercial Salimetrics kits were used according to the manufacturer's instructions.
- LC-MS/MS: Detailed protocols were followed for chromatographic separation and mass spectrometric detection.
- Data Analysis: Multivariate and computational approaches, including machine-learning classification models, were used to compare the performance and validity of the two techniques.
- Sample Cohort: Residual 24-hour urine samples from 337 patients (94 with Cushing's syndrome and 243 non-CS patients) were used.
- Immunoassay Analysis: UFC was measured using direct (extraction-free) methods on four automated platforms: Autobio A6200, Mindray CL-1200i, Snibe MAGLUMI X8, and Roche e801. Reagents and calibrators were specific to each platform.
- Reference Method Analysis: A laboratory-developed LC-MS/MS method was used as the reference. Urine samples were diluted and mixed with an internal standard (cortisol-d4) before injection into a SCIEX Triple Quad 6500+ mass spectrometer.
- Statistical Comparison: Passing-Bablok regression and Bland-Altman plots were used for method comparison. Diagnostic performance was evaluated using ROC curve analysis.
The logical process of method selection and validation, as informed by the data from these protocols, is illustrated below.
The body of evidence consistently demonstrates that LC-MS/MS provides superior analytical specificity for protein and hormone quantification in complex matrices, effectively minimizing the cross-reactivity and interference issues that can plague immunoassay methods [41] [70]. This makes LC-MS/MS the gold standard for research applications requiring the highest level of accuracy, such as biomarker discovery and mechanistic studies. However, modern immunoassays remain powerful tools, particularly in clinical environments where high throughput, rapid turnaround, and operational simplicity are primary concerns. The choice between techniques is not a simple binary but a strategic decision based on the specific requirements of the project. Researchers must weigh the need for absolute specificity against practical constraints, always acknowledging the method-dependent nature of the results. As the field advances, the ongoing refinement of both immunoassay antibodies and LC-MS/MS workflows will continue to push the boundaries of reliable quantification, further enabling robust scientific discovery and drug development.
The quantitative analysis of specific proteins is a cornerstone of biomedical research and therapeutic development. For years, scientists have relied primarily on two methodological pillars: immunoassays and mass spectrometry (MS). Immunoassays, with their roots in antibody-antigen recognition, offer high sensitivity and operational convenience, while mass spectrometry provides unparalleled specificity and the ability to detect multiple analytes simultaneously. Today, the performance landscape of these techniques is being radically transformed by two powerful forces: the integration of artificial intelligence (AI) and the development of novel, ultra-sensitive assay designs. This guide objectively compares the current performance benchmarks of these advanced platforms, providing researchers and drug development professionals with the experimental data and protocols needed to inform their analytical strategies.
Performance Comparison: Quantitative Data
The following tables summarize key performance metrics for advanced immunoassays and mass spectrometry techniques, based on recent experimental studies.
Table 1: Comparative Performance of Advanced Immunoassays for Pathogen Toxin Detection
| Assay Platform | Target Analytes | Limit of Detection (LOD) | Response Time | Key Innovation |
|---|---|---|---|---|
| Bead-Based Electrophoretic Immunoassay [72] | Cholera Toxin (CT), Staphylococcal Enterotoxin B (SEB) | 0.1 fM | < 10 minutes | Simultaneous electrophoretic analyte concentration and magnetic bead capture in a flow cell. |
| Bead-Based Electrophoretic Immunoassay [72] | CT and SEB in tap water | Demonstrated continuous operation for 12 hours | Real-time | Integrated into a continuous flow system for online monitoring. |
Table 2: Diagnostic Performance of Urinary Free Cortisol Immunoassays vs. LC-MS/MS
| Immunoassay Platform | Correlation with LC-MS/MS (Spearman r) | Diagnostic Sensitivity for Cushing's Syndrome | Diagnostic Specificity for Cushing's Syndrome |
|---|---|---|---|
| Autobio A6200 [23] | 0.950 | 89.66% - 93.10% | 93.33% - 96.67% |
| Mindray CL-1200i [23] | 0.998 | 89.66% - 93.10% | 93.33% - 96.67% |
| Snibe MAGLUMI X8 [23] | 0.967 | 89.66% - 93.10% | 93.33% - 96.67% |
| Roche 8000 e801 [23] | 0.951 | 89.66% - 93.10% | 93.33% - 96.67% |
Table 3: AI-Designed Antibody Therapeutics in Development
| Company / Entity | AI Application | Therapeutic Target / Area | Development Stage (as of 2025) |
|---|---|---|---|
| Aulos Bioscience [73] | De novo design of a human mAb against IL-2 | Cancer (Selective T-cell engagement) | First fully computationally designed antibody in clinical trials (Imneskibart/AU-007) |
| LabGenius [74] | Generative AI for multi-specific T-cell engagers | Solid Tumors | Investigational New Drug (IND) filing expected in 2026 |
| Generate:Biomedicines [74] | Generative AI for affinity and half-life optimization | Severe Asthma, COPD | Phase I Trials (GB0895) |
| Nabla Bio [74] | De novo design against challenging membrane targets | Cancer (e.g., CLDN4, CXCR7) | Preclinical (Antibodies generated against 8 targets) |
Experimental Protocols for Key Techniques
Protocol for Ultrasensitive Bead-Based Electrophoretic Immunoassay
This protocol, adapted from a 2025 study, details the steps for achieving fM-level sensitivity for protein toxins [72].
- Step 1: Bead Conjugation. Superparamagnetic carboxylated beads (e.g., Dynabeads MyOne, 1 µm) are conjugated with specific monoclonal antibodies using standard EDC/NHS chemistry according to the manufacturer's protocol.
- Step 2: Assembly of Electrophoretic Flow Cell. The core innovation is a custom flow cell. A flow channel (0.3 mm diameter) is formed between two pieces of wet dialysis membrane, clamped between Plexiglas blocks. The blocks contain chambers for electrode buffer and platinum electrodes to create an electric field perpendicular to the fluid flow. A steel magnetic concentrator is fixed near the channel to create a high magnetic field gradient.
- Step 3: Continuous Flow Operation. The sample and the suspension of antibody-conjugated beads (0.02% in a low-conductivity imidazole-glycine buffer) are pumped into the flow cell at rates of 10 µL/min and 0.5 µL/min, respectively. A voltage (200 V) is applied, causing electrophoretic concentration of the analyte into the compact spatial region where the beads are simultaneously held by magnetic forces.
- Step 4: Binding and Detection. The beads with bound analyte are carried by viscous flow to a microarray surface patterned with capture antibodies. A small magnet underneath the microarray retains the beads via single specific interactions. Beads bound to the microarray are counted using an optical microscope with a dark-field illuminator and custom software for bright spot detection.
Protocol for AI-Driven Antibody Design and Validation
This generalized protocol synthesizes the workflows used by companies like Nabla Bio, Xaira, and LabGenius [74] [73].
- Step 1: Target Specification and In-Silico Design. The target protein and desired epitope (if known) are defined. A generative AI model (e.g., transformer-based or diffusion model) is used to design thousands of novel antibody sequences predicted to bind the target with high affinity and possess optimal drug-like properties (developability, low immunogenicity, stability).
- Step 2: In-Vitro Validation. A subset of the highest-ranking AI-designed sequences (typically tens to hundreds) is synthesized and expressed. Their binding affinity and specificity for the target are experimentally validated using techniques like surface plasmon resonance (SPR) or bio-layer interferometry (BLI).
- Step 3: Multi-Parameter Optimization. The functional and biophysical properties of the lead candidates are tested in high-throughput, automated assays. This data is fed back into the AI model in an iterative "closed loop" to refine the designs and co-optimize for multiple properties simultaneously (e.g., selectivity, potency, and expressibility).
- Step 4: Functional and Preclinical Characterization. The top optimized candidates are produced at a larger scale and undergo comprehensive in vitro and in vivo testing to confirm their therapeutic efficacy and safety profile before selection for clinical development.
Workflow and Pathway Diagrams
The following diagrams visualize the core workflows of the advanced techniques discussed.
AI-Driven Antibody Development Cycle
The Scientist's Toolkit: Essential Research Reagents and Materials
The following table lists key reagents and materials essential for implementing the advanced techniques described in this guide.
Table 4: Key Research Reagent Solutions for Advanced Protein Quantification
| Reagent / Material | Function / Application | Example / Specification |
|---|---|---|
| Superparamagnetic Beads [72] | Solid phase for antibody conjugation; enabled by magnetic manipulation in novel immunoassays. | Dynabeads MyOne, 1 µm diameter, carboxylated. |
| Monoclonal Antibodies [72] | Provide assay specificity by binding target analyte; critical for both immunoassays and MS enrichment. | Affinity-purified antibodies; specific for targets like CT and SEB. |
| Low-Conductivity Buffer [72] | Essential for electrophoretic techniques to allow efficient application of an electric field without excessive heat. | 20 mM imidazole, 10 mM glycine, 0.03% F-127, pH 9.0. |
| Microarray Substrate [72] | Platform for high-density spotting of capture antibodies for multiplexed detection. | Plasma-treated dialysis membrane or functionalized glass slides. |
| SOMAmer/APTamer Reagents [50] | Nucleic acid-based affinity reagents used in platforms like SomaScan for large-scale proteomic studies. | Enable quantification of thousands of proteins from a single sample. |
| Anti-protein Antibodies (Multiplex) [50] | Used in spatial proteomics platforms (e.g., Phenocycler Fusion) to map protein expression in intact tissues. | High-quality antibodies from resources like the Human Protein Atlas. |
| AI/ML Software Platforms [74] [73] | In-silico design and optimization of antibody sequences and properties. | Proprietary platforms from companies like Nabla Bio, Xaira, Absci. |
Head-to-Head Comparison: Analytical Performance and Real-World Concordance
In clinical and research settings, the precise quantification of proteins is fundamental to diagnostics, therapeutic drug monitoring, and biomedical research. Two primary analytical techniques dominate this field: immunoassays and mass spectrometry (MS). Immunoassays, which rely on specific antibody-antigen interactions, have been the workhorse of clinical laboratories for decades due to their efficiency, adaptability, and established credibility [10]. Formats such as enzyme-linked immunosorbent assay (ELISA), Luminex, and Meso Scale Discovery (MSD) offer varying degrees of sensitivity and multiplexing capabilities. In contrast, liquid chromatography coupled with tandem mass spectrometry (LC-MS/MS) represents a more recent technological advancement, providing exceptional specificity and growing capacity for multiplexing [10]. The central challenge for researchers and clinicians lies in selecting the appropriate method for a given application, a decision that hinges on understanding the comparative performance characteristics of these techniques. This guide provides an objective comparison of immunoassay and MS platforms, supported by experimental data and detailed methodologies, to inform decision-making for protein quantification in clinical contexts.
Fundamental Principles and Comparative Characteristics
The core distinction between these techniques lies in their mechanism of detection. Immunoassays quantify proteins based on molecular recognition, using antibodies to capture and detect target analytes, often with enzymatic, fluorescent, or chemiluminescent signaling [10]. Mass spectrometry, particularly LC-MS/MS, separates ions based on their mass-to-charge ratio after ionization, providing direct structural information about the analyte [75].
Table 1: Fundamental Characteristics of Immunoassays and Mass Spectrometry
| Feature | Immunoassays | Mass Spectrometry |
|---|---|---|
| Principle of Detection | Antibody-antigen binding with indirect signal detection (colorimetric, fluorescent, etc.) | Physical separation and detection of ions based on mass-to-charge ratio |
| Specificity | Dependent on antibody specificity; susceptible to cross-reactivity [76] | High intrinsic specificity; can distinguish between proteoforms and metabolites [77] |
| Throughput | Generally high | Moderate, but improving with automation |
| Multiplexing Capability | Available in newer platforms (e.g., Luminex, MSD) [10] | Inherently multiplexable; can measure dozens of analytes simultaneously [10] |
| Sensitivity | High (e.g., pico-gram level for MSD) [10] | Comparable to immunoassays; potentially superior for some applications [10] |
| Development Time & Cost | Relatively fast and low cost for established kits | Lengthy method development; high initial instrument cost |
| Reagent Dependency | Requires high-quality, batch-specific antibodies [10] | Requires stable isotope-labeled internal standards [77] |
The following workflow diagrams illustrate the fundamental procedural differences between a common immunoassay and a typical LC-MS/MS workflow.
Workflow Comparison of ELISA and LC-MS/MS
Experimental Data from Comparative Studies
Empirical comparisons consistently reveal critical differences in performance. The following tables summarize findings from key studies across various clinical applications.
Table 2: Comparison of Immunoassay and MS for Methotrexate (MTX) Monitoring [77]
| Parameter | EMIT Immunoassay | EIA Immunoassay | LC-MS/MS |
|---|---|---|---|
| Correlation (r) | >0.93 vs. LC-MS/MS | >0.93 vs. LC-MS/MS | Reference Method |
| Key Limitation | Cross-reactivity with DAMPA & 7-OH-MTX metabolites, leading to overestimation | Cross-reactivity with metabolites, leading to overestimation | High specificity; distinguishes parent drug from metabolites |
| Clinical Impact | Potential for unnecessary prolongation of leucovorin rescue | Potential for unnecessary prolongation of leucovorin rescue | Accurate drug level assessment for optimal therapy |
| LLOQ | Commercially defined | Commercially defined | 0.01 µmol/L |
Table 3: Comparison of Immunoassay and MS for Estradiol (E2) Measurement [76]
| Parameter | Immunoassay (RIA/ECLIA) | Mass Spectrometry |
|---|---|---|
| Correlation (Spearman r) | 0.53 - 0.76 vs. MS | Reference Method |
| Association with CRP | Significant (rS = 0.29, P<0.001); positive correlation | No association (rS = -0.01 to 0.03, NS) |
| Association with ABI | Significant inverse association (lost after CRP adjustment) | No significant association |
| Association with BMD | Positive association | Positive association |
| Interpretation | Susceptible to interference (e.g., by CRP or CRP-associated factor) | Robust; unaffected by inflammatory state |
A study on Alzheimer's disease biomarkers further illustrates this complex landscape. While immunoassay and mass spectrometry measurements of p-tau217 were highly comparable for identifying amyloid-β pathology, immunoassays for p-tau181 and p-tau231 showed slightly superior performance compared to their antibody-free MS counterparts [28]. This demonstrates that the performance hierarchy is not absolute and can be analyte-dependent.
Detailed Experimental Protocols for Method Comparison
To generate reliable comparative data, a rigorously designed method comparison study is essential. The following protocols outline standard procedures for evaluating these techniques.
Study Design:
- Sample Size: A minimum of 40, and preferably 100, patient samples should be included.
- Sample Selection: Samples must cover the entire clinically meaningful measurement range and be analyzed over multiple days (at least 5) to mimic real-world conditions.
- Measurement: Duplicate measurements for both methods are recommended to minimize random variation.
- Sample Handling: Analyze samples by both methods within a short time span (e.g., 2 hours) to ensure stability.
Statistical Analysis:
- Initial Graphing: Create scatter plots and difference plots (Bland-Altman plots) for visual inspection of the data relationship and to identify outliers.
- Avoid Inadequate Statistics: Neither correlation coefficients (r) nor t-tests are sufficient alone to assess comparability. Correlation measures association, not agreement, and t-tests may miss clinically significant differences [78].
- Regression Analysis: For data covering a wide range, use linear regression (e.g., Deming or Passing-Bablok) to estimate constant (y-intercept) and proportional (slope) systematic error.
- Bias Estimation: The systematic error (bias) at a critical medical decision concentration (Xc) is calculated as SE = Yc - Xc, where Yc is the value given by the regression line of the test method for Xc [79].
- Sample Preparation: Add a known amount of stable isotope-labeled internal standard (SIL-IS) to the serum or plasma sample. Precipitate proteins using an agent like perchloric acid. Purify the supernatant using solid-phase extraction (SPE).
- Digestion (for bottom-up proteomics): Reconstitute the sample and digest with trypsin at 37°C overnight to break the protein into peptides.
- Liquid Chromatography: Separate the resulting peptides using a reverse-phase LC column with a gradient of water and organic solvent (e.g., acetonitrile).
- Mass Spectrometry Analysis: Ionize the eluting peptides (e.g., via electrospray ionization) and analyze using a tandem mass spectrometer. The instrument is set to specifically monitor the precursor and fragment ions (Multiple Reaction Monitoring - MRM) of the target peptide and its SIL-IS counterpart.
- Quantification: The ratio of the peak area of the target analyte to the peak area of the SIL-IS is used for quantification, interpolated from a calibration curve.
- Plate Preparation: Use a plate pre-coated with capture antibodies (MSD) or antibody-conjugated magnetic beads (Luminex) for each target protein.
- Incubation: Add standards, controls, and patient samples to the plate/beads and incubate to allow antigen-antibody binding.
- Washing: Wash to remove unbound substances.
- Detection: Add a mixture of detection antibodies conjugated to a label (e.g., SULFO-TAG for MSD, phycoerythrin for Luminex).
- Signal Measurement: For MSD, apply an electrical current to the plate electrodes to induce chemiluminescence. For Luminex, use a laser to excite the fluorescent dyes within the beads and the detection label.
- Quantification: Interpolate protein concentrations from a standard curve generated with known amounts of the protein.
The following diagram outlines the logical process for designing and executing a robust method comparison study, incorporating the key steps and statistical evaluations discussed.
Method Comparison Study Decision Flowchart
The Scientist's Toolkit: Essential Reagents and Materials
Successful implementation of these techniques requires specific, high-quality reagents and materials.
Table 4: Essential Research Reagent Solutions for Protein Quantification
| Reagent / Material | Function / Description | Primary Technique |
|---|---|---|
| Capture & Detection Antibodies | High-affinity, protein-specific antibodies for immobilizing the analyte and generating a detection signal. | Immunoassay |
| Purified Protein Standard | A well-characterized standard of the target protein, used to generate the calibration curve for quantification. | Immunoassay, MS |
| Stable Isotope-Labeled Internal Standard (SIL-IS) | An analyte analog with heavy isotopes (e.g., ²H, ¹³C); corrects for sample preparation and ionization variability. | LC-MS/MS |
| Solid-Phase Extraction (SPE) Plates | Used to purify and concentrate the analyte from complex biological matrices prior to analysis. | LC-MS/MS |
| Trypsin (Sequencing Grade) | Proteolytic enzyme used to digest proteins into peptides for "bottom-up" MS analysis. | LC-MS/MS (Bottom-Up) |
| Magnetic Microbeads / Electrochemiluminescent Plates | Solid phases for multiplexed immunoassays (e.g., Luminex uses color-coded beads, MSD uses carbon electrode spots). | Multiplex Immunoassay |
| Quality Control (QC) Materials | Samples with known analyte concentrations, used to monitor the accuracy and precision of each analytical run. | Immunoassay, MS |
The choice between immunoassay and mass spectrometry is context-dependent. Immunoassays are ideal for high-throughput routine testing where cost-effectiveness and speed are priorities, and where the assay's specificity for the target has been rigorously validated against potential interferences. They remain the practical choice for many clinical laboratories.
Mass spectrometry is the superior choice when high specificity is required to distinguish between closely related proteoforms, metabolites, or in the presence of known interfering substances [76] [77]. It is also the preferred technology for new biomarker development and validation, and for applications requiring multiplexing of several analytes not available in a single immunoassay panel.
Ultimately, LC-MS/MS often serves as the reference method for validating immunoassays due to its high specificity. When comparative studies reveal a medically unacceptable bias, and especially when the MS result is linked to a clinically relevant outcome, MS should be considered the method of choice for that application, provided resources permit.
The accurate quantification of proteins, such as cytokines in clinical research or newly expressed proteins in genetically modified (GM) crops, is fundamental to advancing our understanding of disease mechanisms and validating novel biotechnologies. For researchers and drug development professionals, selecting the optimal protein quantification platform is complicated by a plethora of available options, each with distinct advantages and limitations. The core challenge lies in achieving sufficient analytical sensitivity and reliable detectability in complex biological matrices like serum, plasma, or plant tissue extracts, where target proteins are often present at low concentrations amid a high background of interfering substances.
This guide provides an objective comparison of contemporary multiplex immunoassay platforms and mass spectrometry (MS), framing the evaluation within a broader thesis on comparative protein quantification research. The performance of these technologies is critically assessed based on head-to-head studies, with a focus on their ability to deliver robust, reproducible data from challenging samples, thereby empowering scientists to make informed, fit-for-purpose platform selections.
The landscape of protein quantification is dominated by immunoassay-based platforms and the emerging challenge of liquid chromatography-tandem mass spectrometry (LC-MS/MS). Immunoassays rely on the specific interaction between an antibody and its target protein, with detection achieved through various signaling methods, including electrochemiluminescence (ECL) and fluorescence [10].
Performance Comparison of High-Sensitivity Multiplex Platforms
A recent 2025 comparative study evaluated three highly sensitive, multiplex immunoassay platforms—MSD S-plex, Olink Target 48, and Quanterix SP-X—against the widely used MSD V-plex for quantitative cytokine analysis in serum and stimulated plasma samples. The findings offer a critical, data-driven perspective for platform selection [80].
Table 1: Key Performance Metrics from a Comparative Study of High-Sensitivity Multiplex Platforms
| Platform | Relative Sensitivity (Rank) | Key Strengths | Considerations |
|---|---|---|---|
| MSD S-plex | Most sensitive | Ultra-sensitive detection; results confirmed by parallelism and antibody knockdown experiments for specificity. | Fit-for-purpose performance should be assessed on a per-analyte basis. |
| Olink Target 48 | Second most sensitive | Enticing combination of sensitivity and high multiplex capability. | Well-suited for studies where many cytokines require quantitation. |
| Quanterix SP-X | Third most sensitive | High-sensitivity platform. | — |
| MSD V-plex | Least sensitive of the four | Widely used and validated; provides high utility across drug development programs. | Lower sensitivity than newer platforms. |
The study concluded that while absolute concentrations for some cytokines differed greatly across platforms, all showed strong correlation. The MSD S-plex should be a priority for applications requiring ultra-sensitive detection, whereas the Olink Target 48 is an excellent choice when a large panel of cytokines must be measured without compromising sensitivity [80].
Immunoassay Platforms versus Mass Spectrometry
While multiplex immunoassays are a mainstay, LC-MS/MS has become an established alternative for protein quantitation. The choice between these techniques depends on the specific analytical needs of the project [10].
Table 2: Comparison of Immunoassays and Mass Spectrometry for Protein Quantification
| Feature | Immunoassays (ELISA, MSD, Luminex) | Liquid Chromatography-Tandem Mass Spectrometry (LC-MS/MS) |
|---|---|---|
| Principle | Antibody-antigen binding with colorimetric, fluorescent, or ECL detection. | Physical separation by LC followed by mass-to-charge ratio identification. |
| Throughput | Relatively high, amenable to automation. | High throughput and multiplexing capabilities. |
| Sensitivity | Can be very high (e.g., ultra-sensitive pico-gram level for MSD). | Comparable sensitivity to many immunoassays. |
| Specificity | High, but cross-reactivity with homologous proteins can be an issue. | High intrinsic specificity, can distinguish between highly homologous proteins. |
| Multiplexing | Possible with platforms like MSD and Luminex. | Inherently supports multiplexed analysis. |
| Reagents | Requires high-quality, batch-controlled antibodies and purified protein standards. | Relies on stable and definable synthetic peptides as internal standards. |
| Development Time | Can be lengthy due to antibody production and optimization. | Method development can be complex but does not require proprietary antibodies. |
| Best Suited For | High-throughput, specific analysis of well-defined targets with available antibodies. | Multiplexed quantification of targets with high specificity, especially when antibodies are unavailable or face cross-reactivity issues [10]. |
Experimental Protocols and Data Analysis
Understanding the fundamental workflows and data analysis pipelines is crucial for implementing these technologies and interpreting results accurately.
Key Experimental Protocols
Multiplex Immunoassay Protocol (e.g., MSD, Luminex) The general workflow for a multiplex immunoassay, such as those from Meso Scale Discovery (MSD) or Luminex, involves several key stages. In a sandwich-style assay, a capture antibody is first immobilized on a solid surface (e.g., a spot on an MSD plate or a color-coded magnetic bead in Luminex). The sample is then incubated, allowing the target protein analyte to bind to the capture antibody. After washing, a detection antibody, conjugated to a signal-generating molecule (e.g., MSD's SULFO-TAG for ECL or a fluorophore for Luminex), is added to form a complex. The final signal is measured and is proportional to the amount of captured protein. Quantification is achieved by interpolating signals from a standard curve of known analyte concentrations run in parallel [10].
LC-MS/MS Protocol for Protein Quantitation For LC-MS/MS, proteins are first extracted from the sample matrix and then digested into peptides using an enzyme like trypsin. These peptides are separated by liquid chromatography (LC) based on their physicochemical properties. As they elute from the LC column, they are ionized and introduced into the mass spectrometer. The first mass analyzer (MS1) selects ions of a specific mass-to-charge ratio (m/z) corresponding to the target peptide. These precursor ions are then fragmented, and a second mass analyzer (MS2) detects the resulting fragment ions. This creates a unique "fingerprint" for the peptide. A stable isotope-labeled version of the target peptide is typically used as an internal standard for precise quantification. The response ratio of the native peptide to the labeled internal standard is used to calculate the original protein concentration [10].
Data Analysis and Quality Control
Robust data analysis is critical for deriving meaningful insights from multiplex protein data. A standardized pipeline includes:
- Data Acquisition and Clean-up: Combined data is annotated with clinical/experimental metadata. Multiple datasets may require normalization to make them comparable. Data is cleaned by addressing missing titles, QC warnings, and removing non-representative samples [81].
- Quality Control and Exploratory Data Analysis: The overall data structure is assessed using tools like principal component analysis (PCA) plots to identify outliers or non-normal distributions [81].
- Statistical Analysis: After QC, statistical tests are selected to answer the biological question. Results are visualized using box plots, volcano plots, etc., with adjustments for multiple testing [81].
- Biological Interpretation: Differentially expressed proteins are placed in biological context using comprehensive annotation databases to understand their relation to pathways or diseases of interest [81].
Visual quality control tools are equally important. For multiplex tissue imaging, plugins exist to evaluate cell staining quality (StainV&QC), compare cell classification results (ClassV&QC), and review cell-cell interactions (InteractionV&QC). These tools help identify issues like weak staining, misclassification, or imaging artifacts that could compromise final conclusions [82].
Essential Research Reagent Solutions
The reliability of any protein quantification assay hinges on the quality and consistency of its core reagents. The following table details key materials essential for successful experiment execution.
Table 3: Key Research Reagents and Materials for Protein Quantification Assays
| Reagent/Material | Function | Critical Considerations |
|---|---|---|
| Matched Antibody Pairs | For sandwich immunoassays (ELISA, MSD, Luminex); a capture antibody immobilizes the analyte, and a detection antibody enables quantification. | Specificity and affinity are paramount. Cross-reactivity, especially with homologous proteins in GM crops or endogenous proteins in serum, must be evaluated [10]. |
| Purified Protein Standard | Used to generate a calibration curve for interpolating analyte concentrations in samples. | Must be highly pure, well-characterized, and ideally identical to the native protein. Sourced from trait-specific crops or heterologous expression systems [10]. |
| SULFO-TAG Labels | Used in MSD assays for detection; emits light upon electrochemical stimulation, providing the signal for quantification. | Enables the high sensitivity and wide dynamic range characteristic of the MSD platform [10]. |
| Color-Coded Magnetic Beads | The core of Luminex xMAP technology; each bead set can be coated with a different capture antibody, enabling multiplexing. | Beads are sensitive to freezing and require careful handling and storage. Bead sets must be spectrally distinct [10]. |
| Stable Isotope-Labeled Peptides | Serve as internal standards in LC-MS/MS; they behave identically to native peptides during analysis but are distinguishable by mass. | Allow for highly precise quantification by correcting for sample preparation and ionization variability [10]. |
| Blocking Buffers | Used in immunoassays to cover nonspecific binding sites on solid surfaces, thereby reducing background signal. | Composition is critical for minimizing noise and preventing false positives. |
The evaluation of multiplex platforms for protein quantification reveals a landscape without a single universal "best" option. Instead, the optimal choice is dictated by the specific demands of the research question. For applications demanding the highest possible sensitivity for a defined set of analytes, the MSD S-plex platform emerges as a leading candidate. When the research scope requires measuring a larger panel of proteins without a significant sacrifice in sensitivity, the Olink platform presents a compelling solution.
In contexts where antibody cross-reactivity is a major concern, such as with homologous proteins in GM crops, or when high-quality antibodies are unavailable, LC-MS/MS serves as a powerful orthogonal or primary technique, offering high specificity and multiplexing capabilities. Ultimately, researchers must conduct a thorough fit-for-purpose assessment, weighing factors such as required sensitivity, multiplexing depth, specificity, throughput, and cost against their project's goals to select the most appropriate platform for achieving reliable and meaningful results.
The selection between immunoassays and mass spectrometry (MS) for protein quantification is a critical decision in biomedical research and drug development. Each technology offers distinct advantages and faces specific limitations, making it essential to understand their performance characteristics and the regulatory validation requirements that govern their application. Immunoassays, such as the proximity extension assays (PEA) used by Olink or Meso Scale Discovery (MSD) platforms, rely on antibody-antigen interactions for protein detection [27] [48]. In contrast, MS-based approaches utilize physical separation and mass-based detection of protein-derived peptides, providing sequence-specific information [40] [27]. The choice between these platforms influences not only experimental outcomes but also the pathway for method validation and regulatory compliance. This guide provides an objective comparison of these technologies, supported by experimental data, to inform researchers, scientists, and drug development professionals in their analytical strategy.
Technology Comparison: Fundamental Principles and Performance
Core Technological Differences
The fundamental differences between immunoassays and mass spectrometry stem from their underlying detection mechanisms. Immunoassays are affinity-based methods that use antibodies, aptamers, or other binding reagents to specifically recognize and quantify target proteins. Techniques like Olink's PEA require two antibodies binding to the same target for detection, which enhances specificity [27]. These methods generally involve simpler sample preparation and analysis workflows compared to MS, making them suitable for high-throughput applications [27].
Mass spectrometry approaches, including liquid chromatography-tandem MS (LC-MS/MS), measure proteins through direct physical properties by digesting proteins into peptides, separating them chromatographically, and determining their mass-to-charge ratios [27]. MS provides highly specific identification and quantification based on peptide sequences, enabling the detection of specific proteoforms and post-translational modifications [40] [27]. The HiRIEF LC-MS/MS method, for instance, combines high-resolution isoelectric focusing with LC-MS/MS to achieve substantial analytical depth [27].
Table 1: Core Characteristics of Immunoassay and Mass Spectrometry Platforms
| Characteristic | Immunoassays (Olink, MSD, NULISA) | Mass Spectrometry (LC-MS/MS) |
|---|---|---|
| Detection Principle | Antibody-based affinity binding | Physical mass-to-charge measurement |
| Sample Throughput | Generally high | Variable, often lower due to extensive sample preparation |
| Multiplexing Capacity | Targeted, predefined panels | Can be untargeted or targeted |
| Specificity Mechanism | Antibody pairs (PEA) or aptamers | Sequence-specific peptide detection |
| Protein Modification Detection | Limited unless specific antibodies exist | Direct detection of modifications possible |
| Sample Volume Requirements | Low (e.g., 10-30 µL for NULISA) [48] | Typically higher (e.g., 250-300 µL for CSF p-tau) [28] |
Quantitative Performance and Analytical Coverage
Direct comparative studies reveal distinct performance patterns between these technological approaches. A 2025 study comparing HiRIEF LC-MS/MS and Olink Explore 3072 on 88 plasma samples analyzing 1,129 overlapping proteins found complementary proteome coverage between platforms [27]. MS demonstrated higher coverage of mid- to high-abundance proteins, particularly predicted secreted proteins, enzymes, metabolic proteins, and immunoglobulins [27]. Conversely, Olink showed superior detection of low-abundance proteins, especially cytokines, predicted membrane proteins, and CD markers [27].
Both platforms exhibited high precision in technical replicates, with median coefficients of variation (CV) of 6.8% for MS and 6.3% for Olink [27]. Most proteins had CVs below 15% in both datasets (85% for MS, 81% for Olink), demonstrating robust reproducibility for both technologies [27].
In specialized applications like detecting phosphorylated tau (p-tau) biomarkers for Alzheimer's disease, a 2024 study found that immunoassay-based p-tau biomarkers were slightly superior to antibody-free MS-based methods for p-tau181 and p-tau231, while p-tau217 measurements were highly comparable between platforms [28]. This suggests that performance differences may be analyte-specific.
Table 2: Analytical Performance Comparison Across Platforms
| Performance Metric | HiRIEF LC-MS/MS | Olink Explore 3072 | MSD | NULISA |
|---|---|---|---|---|
| Proteins Detected (in 88 samples) | 2,578 | 2,913 | N/A | N/A |
| Overlap with Reference Plasma Proteome | Higher | Lower | N/A | N/A |
| Detection of Low-Abundance Proteins | Lower coverage | Higher coverage | Highest in SCTS [48] | Intermediate in SCTS [48] |
| Technical Precision (Median CV) | 6.8% | 6.3% | N/A | N/A |
| Quantitative Agreement (Median Correlation) | 0.59 (IQR: 0.33-0.75) with Olink | 0.59 (IQR: 0.33-0.75) with MS | N/A | N/A |
| Missing Value Frequency | 53% of proteins had ≥1 missing value | 35% of proteins had ≥1 missing value | N/A | N/A |
Regulatory Validation Frameworks
General Validation Principles
Regulatory guidance for bioanalytical method validation ensures data quality, reliability, and reproducibility. The FDA Guidance for Industry on Bioanalytical Method Validation outlines core requirements for assays used in supporting regulatory submissions [83]. For immunoassays, the College of American Pathologists (CAP) provides updated guidelines (2024) specifically for immunohistochemical assays, which include harmonized validation requirements for predictive markers with a minimum 90% concordance requirement for all IHC assays [84].
For mass spectrometry applications in biopharmaceutical quality control, regulatory agencies are increasingly supporting MS as a reliable tool, particularly for monitoring aspects like host cell proteins (HCPs) [40]. The multi-attribute method (MAM) by LC-MS peptide mapping has the potential to replace multiple conventional purity/impurity assays for biopharmaceutical release and stability testing, provided it includes robust new peak detection (NPD) functionality validated according to ICH Q2 guidelines [85].
Application-Specific Validation Considerations
Validation requirements vary significantly based on the application and sample matrix. For tissue-based assays, the 2024 CAP guidelines recommend separate validation for each assay-scoring system combination (e.g., for HER2 or PD-L1 with different scoring systems by tumor site) [84]. For cytology specimens not fixed identically to tissues used for initial validation, separate validations with minimum 10 positive and 10 negative cases are required [84].
In stratum corneum tape strip (SCTS) analysis, a challenging matrix with low protein yield, platform selection significantly impacts detectability. A 2025 study found MSD demonstrated highest sensitivity (detecting 70% of shared proteins), followed by NULISA (30%) and Olink (16.7%) [48]. This highlights how matrix-specific validation is essential for reliable results.
For biopharmaceutical impurity monitoring, MS-based HCP detection offers detailed, sequence-specific information that complements traditional immunoassays [40]. The validation of such methods must demonstrate reliability in detecting low-level impurities throughout biopharmaceutical production.
Experimental Protocols for Cross-Platform Comparison
Plasma Proteomics Workflow
The following workflow is adapted from a 2025 comparative study of HiRIEF LC-MS/MS and Olink Explore 3072 [27]:
Sample Preparation:
- MS Method: Deplete high-abundance proteins from plasma samples, digest proteins, perform tandem mass tag (TMT) labeling, fractionate peptides using high-resolution isoelectric focusing (HiRIEF), and analyze by LC-MS/MS with data-dependent acquisition.
- Olink Method: Dilute plasma samples according to manufacturer specifications and analyze using proximity extension assay technology with 3072-plex protein coverage.
Data Acquisition:
- MS Parameters: Use LC-MS/MS with appropriate gradient separation; typically 2-hour gradients per fraction for deep profiling.
- Olink Parameters: Follow manufacturer protocols for amplification and reading using standard real-time PCR instruments.
Data Analysis:
- MS Data: Process using peptide-spectrum matching against sequence databases; quantify based on TMT reporter ions or label-free approaches.
- Olink Data: Use normalized protein expression (NPX) values provided by the manufacturer's software pipeline.
CSF Phospho-Tau Quantification Protocol
For comparing immunoassay and MS-based quantification of Alzheimer's biomarkers [28]:
Sample Preparation:
- Immunoassay: Use established Simoa (TRIAD cohort) or MSD (BioFINDER-2 cohort) protocols with appropriate calibrators and controls.
- MS Method: Spike 250µL CSF with heavy isotope-labeled peptide standards, perform protein precipitation with perchloric acid, centrifuge, filter through 0.45µm membrane, solid-phase extraction cleanup, lyophilize, then tryptic digest overnight at 37°C.
Data Acquisition:
- Immunoassay: Follow manufacturer's protocols for each platform.
- MS Analysis: Use liquid chromatography-parallel reaction monitoring (PRM) on a hybrid Orbitrap mass spectrometer; analyze data using Skyline software with single-point calibration using heavy labeled peptides.
Essential Research Reagent Solutions
Table 3: Key Reagents and Materials for Cross-Platform Protein Quantification
| Reagent/Material | Function | Application Examples |
|---|---|---|
| Heavy Isotope-Labeled Peptide Standards | Internal standards for absolute quantification by MS | AQUA peptides for p-tau quantification [28] |
| Tandem Mass Tags (TMT) | Multiplexed relative quantification in MS | TMT labeling in HiRIEF LC-MS/MS [27] |
| Proximity Extension Assay Reagents | Antibody pairs with DNA tags for highly multiplexed immunoassay | Olink Explore 3072 platform [27] |
| Solid-Phase Extraction Plates | Sample cleanup and concentration prior to MS | Oasis PRiME HLB plates for CSF p-tau analysis [28] |
| High-Abundance Protein Depletion Kits | Remove abundant proteins to enhance detection of low-abundance targets | Plasma proteomics by MS [27] |
| Multiplex Immunoassay Kits | Simultaneous quantification of multiple predefined targets | MSD, NULISA, and Olink panels [48] |
Workflow and Regulatory Pathway Visualization
The choice between immunoassays and mass spectrometry for protein quantification involves balancing multiple factors, including required sensitivity, analytical specificity, throughput needs, and regulatory considerations. Immunoassays generally offer superior sensitivity for low-abundance proteins and higher throughput, while mass spectrometry provides broader proteome coverage, specificity for protein variants, and ability to detect unexpected analytes. As regulatory agencies increasingly recognize mass spectrometry as a reliable quality control tool [40], both platforms have important roles in modern protein quantification workflows. The optimal approach for many applications may involve leveraging the complementary strengths of both technologies, as demonstrated by the moderate quantitative agreement (median correlation: 0.59) between platforms in comparative studies [27]. Understanding the specific validation requirements for each technology in different applications and matrices is essential for generating reliable, regulatory-compliant data in both research and drug development settings.
This guide provides an objective comparison between mass spectrometry (MS) and immunoassays for specific protein quantification, critical for researchers, scientists, and drug development professionals selecting appropriate analytical platforms. The analysis reveals that immunoassays generally offer superior throughput and lower operational costs for targeted protein analysis, whereas mass spectrometry provides broader specificity, greater multiplexing flexibility, and more comprehensive protein characterization, albeit with higher instrumentation investment and more complex workflows. The choice between platforms depends heavily on project-specific requirements for sensitivity, multiplexing capacity, budget, and need for direct protein identification.
Table 1: Platform Comparison Overview
| Feature | Mass Spectrometry | Immunoassays (Multiplex) |
|---|---|---|
| Primary Strength | Untargeted discovery, sequence-specific data, flexible multiplexing | High-throughput targeted analysis, ease of use |
| Typical Instrument Cost | $50,000 - $1.5M+ [86] | Lower (platform-dependent) |
| Operational Cost (per sample) | ~$75 - $1,000 (service rates) [87] [88] | Varies by platform and plex level |
| Throughput | Lower (complex sample prep) [27] | High [27] |
| Sensitivity | Attomole (amol) level possible [89] | Platform-dependent (e.g., attomolar claims) [48] |
| Proteome Coverage | 2,578 proteins (HiRIEF LC-MS/MS) [27] | 2,923 proteins (Olink Explore 3072) [27] |
| Quantitative Precision (Median CV) | 6.8% (HiRIEF LC-MS/MS) [27] | 6.3% (Olink Explore) [27] |
Instrumentation and Capital Expenditure
The initial capital outlay for analytical instrumentation represents a significant portion of the total cost of ownership and varies dramatically between technologies.
Mass Spectrometry Systems
Mass spectrometer costs are highly dependent on the technology, sensitivity, and resolution required [86].
- Entry-Level Systems ($50,000 - $150,000): Typically quadrupole mass analyzers, suited for routine analysis in environmental testing or quality control.
- Mid-Range Systems ($150,000 - $500,000): Include triple quadrupole (triple quad) and time-of-flight (TOF) systems, offering higher sensitivity and faster data acquisition for pharmaceutical research or clinical diagnostics.
- High-End Systems ($500,000+): Orbitrap and Fourier transform ion cyclotron resonance (FT-ICR) systems provide unparalleled precision and resolution for proteomics and metabolomics, with prices exceeding $1.5 million for ultra-high-resolution configurations [86].
Immunoassay Platforms
Immunoassay platforms generally require a lower initial capital investment than high-end mass spectrometers. Specific costs for platforms like Meso Scale Discovery (MSD), Olink, and NULISA are not detailed in the search results, but they are recognized for high-throughput capabilities and simpler operational workflows [48].
Operational Expenses and Throughput
Beyond the initial purchase, ongoing operational costs and throughput are critical for project planning and budgeting.
Operational Cost Drivers for Mass Spectrometry
The total cost of ownership for a mass spectrometer includes substantial recurring expenses [86]:
- Annual Service Contracts: $10,000 to $50,000.
- Consumables & Reagents: Vacuum pumps, calibration standards, gases, and ionization sources.
- Software Licensing: Annual fees for data processing and compliance tracking.
- Labor: Technically demanding operation and data analysis.
For labs without in-house instruments, university core facility rates provide insight into per-sample costs (Table 2).
Table 2: Example Mass Spectrometry Service Rates (Academic)
| Service | Description | Cost (Academic) |
|---|---|---|
| Molecular Mass Determination | ESI-TOF/MS analysis by staff [87] | $75 per sample |
| HPLC-ESI-MS/MS + Database Analysis | Prepared sample, high complexity (Orbitrap) [88] | $120 per sample |
| Peptide Mapping | Includes digestion and 2hrs of data processing [87] | $550 per sample |
| DIA-MS Protein ID & Quantification | Per injection on an Orbitrap Lumos [88] | $170 per injection |
Throughput and Cost Considerations for Immunoassays
Immunoassays excel in high-throughput scenarios. The Olink Explore 3072 platform, for example, can analyze 2,923 proteins across many samples simultaneously [27]. Key operational advantages include:
- Straightforward Sample Preparation: Less complex than MS protocols, reducing hands-on time and required expertise [48].
- Small Sample Volume Requirements: NULISA and Olink require smaller sample volumes, which is beneficial for limited samples [48].
- Reduced Assay Runs: The high multiplexing capacity means fewer overall runs are needed to measure a large number of analytes [48].
Performance Comparison in Protein Quantification
Direct comparisons of MS and immunoassays reveal complementary strengths and weaknesses in real-world applications.
Proteome Coverage and Specificity
A comparative study of HiRIEF LC-MS/MS and Olink Explore 3072 on 88 plasma samples demonstrated complementary coverage [27].
- MS detected 2,578 unique proteins.
- Olink detected 2,923 proteins.
- The overlap was 1,129 proteins, indicating each platform accesses a unique portion of the proteome.
The coverage also differed by protein abundance and type [27]:
- MS showed higher coverage of mid- to high-abundance proteins, including secreted proteins, enzymes, and proteins involved in hemostasis and blood coagulation.
- Immunoassays demonstrated higher coverage of low-abundance proteins, particularly cytokines, signaling proteins, and membrane proteins.
Sensitivity and Precision
Both platforms can achieve high sensitivity and excellent precision.
- Mass Spectrometry: A specialized Laser Desorption/Ionization Time-of-Flight MS (LDI-TOF MS) immunoassay demonstrated sensitivity at the attomole (amol) level for the SARS-CoV-2 Spike S1 subunit antibody [89].
- Immunoassays: The NULISA platform reports attomolar sensitivity [48].
- Precision: Both HiRIEF LC-MS/MS and Olink Explore showed high quantitative precision, with median technical coefficients of variation (CV) of 6.8% and 6.3%, respectively [27].
Quantitative Agreement
A study comparing three immunoassay platforms (MSD, NULISA, Olink) on skin tape strip samples highlighted variability in detectability. MSD demonstrated the highest sensitivity, detecting 70% of shared proteins, followed by NULISA (30%) and Olink (16.7%) [48]. For proteins detected by all platforms, correlation can be strong, with interclass correlation coefficients ranging from 0.5 to 0.86 for specific markers like CXCL8, VEGFA, IL18, and CCL2 [48].
Experimental Protocols for Platform Evaluation
Protocol 1: Mass Spectrometry-Based Plasma Proteomics (HiRIEF LC-MS/MS)
This protocol is used for in-depth, untargeted plasma proteome profiling [27].
- Sample Preparation:
- Deplete high-abundance proteins from plasma samples.
- Digest proteins into peptides using a protease like trypsin.
- Label peptides with Tandem Mass Tag (TMT) reagents for multiplexed quantification.
- High-Resolution Isoelectric Focusing (HiRIEF):
- Separate labeled peptides based on their isoelectric point (pI) using HiRIEF. This fractionation increases proteome coverage.
- Liquid Chromatography-Tandem Mass Spectrometry (LC-MS/MS):
- Analyze fractions via reverse-phase liquid chromatography coupled to a high-resolution tandem mass spectrometer (e.g., Orbitrap).
- Use Data-Dependent Acquisition (DDA) to fragment the most abundant ions.
- Data Analysis:
- Identify and quantify peptides by matching experimental mass spectra to theoretical spectra in protein sequence databases (peptide-spectrum matching).
Protocol 2: Multiplex Immunoassay (Proximity Extension Assay)
This protocol outlines the steps for a high-multiplex immunoassay like Olink [27].
- Incubation:
- Incuminate the sample with pairs of antibodies linked to DNA oligonucleotides.
- Each target protein is bound by two specific antibodies, bringing their DNA tags into proximity.
- Proximity Extension:
- When the two antibodies bind to the target protein, their DNA strands hybridize.
- A DNA polymerase extends one strand, creating a double-stranded DNA "barcode" unique to the specific protein target.
- Quantification:
- The DNA barcode is quantified using a highly sensitive method like quantitative real-time PCR (qPCR) or next-generation sequencing (NGS).
- The amount of barcode measured is directly proportional to the initial concentration of the target protein.
Essential Research Reagent Solutions
The following table details key reagents and materials essential for conducting these protein quantification analyses.
Table 3: Key Research Reagents and Materials
| Item | Function | Platform Context |
|---|---|---|
| Tandem Mass Tags (TMT) | Chemical labels that enable multiplexed quantification of peptides from different samples in a single MS run. | Mass Spectrometry [27] |
| DNA-linked Antibodies | Paired antibodies that bind a specific protein; each is attached to a unique DNA oligonucleotide that forms a quantifiable barcode upon proximity binding. | Proximity Extension Assay (e.g., Olink) [27] |
| Anti-Cytotoxin Antibodies | Used to capture antibody-drug conjugates (ADCs) or their payloads for subsequent LC-MS/MS analysis of total antibody, conjugated antibody, and free drug. | Mass Spectrometry for ADC Analysis [90] |
| Trypsin | Protease enzyme used to digest proteins into smaller peptides, which are more amenable to separation and analysis by MS. | Mass Spectrometry [90] |
| Stable Isotope-Labeled Internal Standards | Synthetic peptides or proteins with heavy isotopes used for precise and accurate quantification in MS-based assays. | Mass Spectrometry (Quantification) [89] |
| Magnetic Beads/Capture Reagents | Solid-phase support used to immobilize and enrich specific analytes (like ADCs) from a complex biological matrix prior to analysis. | Mass Spectrometry & Immunoassays [90] |
The decision between mass spectrometry and immunoassays for protein quantification is not a matter of one platform being universally superior. It requires a careful cost-benefit analysis aligned with project goals.
- Immunoassays are optimal for high-throughput, targeted protein analysis where speed, sensitivity, and lower operational complexity are priorities.
- Mass spectrometry is ideal for discovery-phase research, applications requiring absolute specificity, characterizing novel proteins or modifications, and analyzing complex drug modalities like ADCs.
The emerging trend is not to view these technologies as competitors but as complementary tools. Integrating MS and immunoassays can provide a more comprehensive and reliable profile of the proteome, validating findings and leveraging the unique strengths of each platform to advance biomedical research and drug development [27].
The quantification of specific proteins is a cornerstone of biomedical research and drug development. For decades, immunoassays and mass spectrometry (MS) have served as the primary analytical techniques for this purpose, yet each has distinct strengths and limitations. Immunoassays provide high throughput and sensitivity but can be limited by antibody availability and specificity due to cross-reactivity [10] [91]. In contrast, mass spectrometry offers exceptional specificity and the ability to multiplex without dedicated reagents for each target, but has traditionally faced throughput constraints and requires specialized instrumentation [10] [92]. This guide objectively compares the performance of these platforms and explores integrated approaches that combine their advantages for specific protein quantification in pharmaceutical and clinical research.
Technology Platform Comparison
Fundamental Principles and Workflows
Immunoassays are bioanalytical methods that rely on the specific binding between an antibody and its target antigen (analyte) [91]. They can be formatted as competitive or sandwich assays (the latter for larger analytes with multiple epitopes) and may be heterogeneous (requiring a separation step) or homogeneous [93] [91]. Common detection methods include colorimetric, fluorescent, chemiluminescent, or electrochemiluminescent signaling [93]. The key advantage of immunoassays is their ability to directly analyze complex biological matrices like blood, plasma, or urine with minimal sample pretreatment, enabling high throughput and excellent sensitivity, often to the pg/ml or ng/ml level [91].
Mass Spectrometry measures the mass-to-charge ratio (m/z) of ionized molecules. When applied to protein quantification, it is typically coupled with liquid chromatography (LC) in bottom-up approaches where proteins are enzymatically digested into peptides, which are then separated, ionized, and analyzed [94]. Quantification is achieved by comparing the signal intensity of target peptides to heavy isotope-labeled internal standards, providing absolute quantification [28] [94]. The key advantage of MS is its high specificity, as it can distinguish between different protein isoforms and post-translational modifications (e.g., phosphorylated tau variants p-tau181, p-tau217, p-tau231) based on mass differences, with minimal risk of cross-reactivity [28].
Direct Performance Comparison: Analytical and Diagnostic Metrics
Recent studies provide direct experimental data comparing the performance of modern immunoassays and mass spectrometry for specific protein quantification.
Table 1: Analytical Performance of Immunoassays vs. LC-MS/MS for Urinary Free Cortisol (UFC) [24]
| Platform | Principle | Correlation with LC-MS/MS (Spearman r) | Proportional Bias | Diagnostic AUC for Cushing's Syndrome |
|---|---|---|---|---|
| Autobio A6200 | Competitive Chemiluminescence | 0.950 | Positive | 0.953 |
| Mindray CL-1200i | Sandwich Chemiluminescence | 0.998 | Positive | 0.969 |
| Snibe MAGLUMI X8 | Competitive Chemiluminescence | 0.967 | Positive | 0.963 |
| Roche 8000 e801 | Competitive Electrochemiluminescence | 0.951 | Positive | 0.958 |
| Reference LC-MS/MS | Liquid Chromatography-Tandem MS | - | - | - |
This study demonstrated that all four evaluated immunoassays showed strong correlations with LC-MS/MS and high diagnostic accuracy (AUC >0.95) for Cushing's syndrome, despite a positive proportional bias. This indicates that while absolute values may differ, immunoassays maintain high clinical utility when using method-specific cut-offs [24].
Table 2: Performance of Immunoassays vs. Mass Spectrometry for Alzheimer's Disease p-tau Biomarkers [28]
| p-tau Variant | Technology | Performance vs. Immunoassay | Key Finding |
|---|---|---|---|
| p-tau217 | Mass Spectrometry (LC-MS) | Highly Comparable | Diagnostic performance, effect sizes, and associations with PET biomarkers were highly similar. |
| p-tau181 | Mass Spectrometry (LC-MS) | Lower Performance | Mass spectrometry-based performance was inferior to established immunoassays. |
| p-tau231 | Mass Spectrometry (LC-MS) | Lower Performance | Mass spectrometry-based performance was inferior to established immunoassays. |
This comparison in the BioFINDER-2 and TRIAD cohorts revealed that while MS-based p-tau217 was highly comparable to immunoassay, antibody-free MS measurements for p-tau181 and p-tau231 showed slightly lower performance, suggesting that immunoassays currently hold an advantage for these specific analytes [28].
Experimental Protocols for Method Comparison
To ensure valid and reproducible comparisons between platforms, rigorous experimental design and protocol execution are essential. The following methodologies are adapted from recent comparative studies.
Protocol 1: Method Comparison for Urinary Biomarker Quantification
This protocol is derived from a study comparing four immunoassays with LC-MS/MS for urinary free cortisol [24].
- Sample Preparation: Collect 24-hour urine samples from well-characterized patient cohorts (e.g., 94 Cushing's syndrome patients and 243 non-CS patients). Aliquot and store residual samples at -80°C until analysis. Avoid freeze-thaw cycles.
- LC-MS/MS Analysis (Reference Method):
- Dilute urine specimens 20-fold with pure water.
- Add a known concentration of internal standard (e.g., cortisol-d4).
- Centrifuge the mixture and inject the supernatant into the LC-MS/MS system.
- Use a UPLC system with a C8 column and a binary mobile phase (water and methanol).
- Operate the mass spectrometer in positive electrospray ionization mode with Multiple Reaction Monitoring (MRM).
- Immunoassay Analysis (Test Methods):
- Perform direct immunoassays (without extraction) on the respective automated platforms (e.g., Autobio A6200, Mindray CL-1200i, Snibe MAGLUMI X8, Roche e801).
- Use manufacturer-specific reagents, calibrators, and quality controls.
- Follow manufacturer instructions precisely for incubation times, reagent volumes, and washing steps.
- Data Analysis:
- Use Passing-Bablok regression and Bland-Altman plots to assess correlation and agreement between each immunoassay and LC-MS/MS.
- Perform ROC analysis to determine diagnostic performance (AUC, sensitivity, specificity) and establish optimal, method-specific cut-off values for disease identification.
Protocol 2: Comparison for CSF Phosphoprotein Quantification
This protocol is based on a study comparing immunoassay and MS for phosphorylated tau in cerebrospinal fluid [28].
- Sample Collection: Collect CSF from cohorts with defined clinical diagnoses (Cognitively Unimpaired, Mild Cognitive Impairment, Alzheimer's Disease, Other Neurodegenerative Diseases). Centrifuge to remove cells and aliquot for storage at -80°C.
- Immunoassay Protocol:
- Simoa: Use commercial or custom kits on an HD-X analyzer. Dilute CSF samples as needed within the quantitative range of the assay.
- MSD: Use validated assays on the Meso Scale Discovery platform according to manufacturer protocols.
- ELISA: Perform standard enzyme-linked immunosorbent assay procedures for specific variants.
- Mass Spectrometry Protocol (LC-MS):
- Sample Prep: Precipitate majority proteins from 250 µL CSF using perchloric acid, leaving tau in solution. Isolate the supernatant.
- Solid-Phase Extraction (SPE): Load supernatant onto an Oasis PRiME HLB µElution plate. Wash and elute peptides.
- Trypsin Digestion: Reconstitute lyophilized eluates in trypsin solution and incubate overnight at 37°C.
- LC-MS Analysis: Analyze tryptic peptides using liquid chromatography coupled to a high-resolution mass spectrometer (e.g., Orbitrap) in Parallel Reaction Monitoring (PRM) mode.
- Quantification: Spike in heavy isotope-labeled peptide standards (AQUA peptides) for absolute quantification. Analyze data using software like Skyline.
- Data Correlation: Compare analyte concentrations obtained by both methods using Bland-Altman analysis. Correlate results with orthogonal disease biomarkers (e.g., amyloid-PET, tau-PET) and perform ROC analysis to assess diagnostic accuracy.
The Scientist's Toolkit: Key Research Reagent Solutions
Successful protein quantification, regardless of platform, relies on a set of critical reagents and instruments. The following table details essential materials and their functions.
Table 3: Essential Reagents and Instruments for Protein Quantification
| Item Category | Specific Examples | Function & Importance |
|---|---|---|
| Antibodies | Capture & Detection Matched Pairs (for sandwich IA), Polyclonal/Monoclonal (for competitive IA) [91] | The core reagent defining specificity in immunoassays. Affinity-purified antibodies are preferred for optimal performance and low cross-reactivity. |
| Labeling Systems | Enzymes (HRP, ALP), Fluorescent Probes, Chemiluminescent compounds (e.g., SULFO-TAG for MSD) [93] [91] | Generate a detectable signal proportional to the amount of captured analyte. Choice affects sensitivity (e.g., signal amplification by enzymes) and detection mode. |
| Standards & Controls | Recombinant Protein, Synthetic Peptide (AQUA) Standards, Quality Control Samples [93] [28] | Essential for creating calibration curves for quantification and for monitoring assay precision and accuracy across runs. |
| Separation Matrices | 96/384-well Microwell Plates, Magnetic Beads (e.g., for Luminex, SISCAPA) [91] [95] | Provide a solid phase for immobilizing capture antibodies or antigens, facilitating the separation of bound and free analytes. |
| Chromatography | U/HPLC Systems, C8/C18 Reverse Phase Columns [24] [28] | Critical for MS workflows; separates complex peptide mixtures prior to ionization, reducing signal suppression and improving sensitivity. |
| Mass Spectrometers | Triple Quadrupole (for MRM), Orbitrap (for high-resolution), SCIEX Triple Quad, Thermo Fusion Tribrid [24] [28] | The core instrument for MS; separates ions by m/z and provides the primary quantitative and qualitative data. |
| Automated Platforms | Autobio A6200, Mindray CL-1200i, Snibe MAGLUMI X8, Roche cobas e series, MSD, Luminex [24] [10] [95] | Automated immunoassay systems that standardize pipetting, incubation, and washing, enabling high throughput and reproducibility. |
Integrated Workflows and Future Outlook
The future of protein quantification in advanced research and development lies in strategic integration, leveraging the strengths of both immunoassays and mass spectrometry.
Hybrid Workflow: Immunoaffinity Enrichment Coupled with MS Detection
One powerful integrated approach involves using immunoaffinity for target enrichment prior to MS analysis. Techniques like SISCAPA use anti-peptide antibodies to enrich specific target peptides from a digested protein sample, which are then quantified by LC-MS/MS [94]. This combines the high specificity of immunoassays for sample preparation with the unparalleled specificity of MS for detection, significantly improving sensitivity and throughput for low-abundance proteins in complex matrices.
Strategic Platform Selection in Drug Discovery
The complementary nature of these technologies is evident in the drug discovery pipeline [92]:
- High-Throughput Screening (HTS): Immunoassays or other rapid detection methods are ideal for screening vast compound libraries due to their speed and automation.
- Hit Validation: Mass spectrometry is exceptionally valuable for confirming hits from primary screens, as its label-free, direct detection method eliminates artifacts common in optical assays (e.g., compound auto-fluorescence or quenching) [92].
- Lead Optimization: MS provides detailed information on metabolite identification and pharmacokinetic properties. Meanwhile, multiplexed immunoassays (e.g., Luminex, MSD) can efficiently profile the effects of lead compounds on multiple signaling pathways or biomarkers simultaneously [10] [95].
Immunoassays and mass spectrometry are not mutually exclusive technologies but are powerful partners in the quantification of specific proteins. Immunoassays excel in throughput, ease of use, and sensitivity for targeted screening in clinical and regulated environments. Mass spectrometry offers superior specificity, multiplexing potential for novel analytes, and absolute quantification without antibody dependency. The optimal choice depends on the application's specific requirements for throughput, specificity, multiplexing, and available resources. As both technologies continue to advance—with immunoassays becoming more specific and MS becoming faster and more sensitive—their synergistic integration will undoubtedly unlock new possibilities in biomedical research and personalized medicine.
Conclusion
Immunoassays and mass spectrometry are not mutually exclusive but rather complementary technologies in the protein quantification toolkit. Immunoassays offer robust, high-throughput capabilities ideal for routine analysis, with newer platforms demonstrating improved specificity without extraction. Mass spectrometry provides unparalleled specificity, multiplexing depth, and the ability to detect novel proteoforms, making it indispensable for discovery and complex impurity profiling. The choice between them hinges on specific application requirements: clinical throughput versus discovery depth, established single-analyte tests versus comprehensive profiling, and available resources. Future directions point toward increased integration of these platforms, leveraging AI for data analysis, developing more sensitive and multiplexed immunoassays, and establishing standardized validation frameworks. This synergy will be crucial for advancing personalized medicine, biopharmaceutical development, and systems biology research, ultimately enabling more precise and comprehensive protein analysis across diverse scientific disciplines.
References
- 1. ELISA vs. Multiplex Immunoassays: Why ELISA Remains ... [https://www.cusabio.com/c-21191.html?srsltid=AfmBOooL81e79IkE0j0HnJ0Y_UXMciYM-ETOL4acgN3lw6CgsScwc2yH]
- 2. Traditional protein analysis methods - Mass spectrometry ... [https://www.nautilus.bio/blog/traditional-means-to-study-proteins-mass-spectrometry/]
- 3. Mass spectrometry-based proteomics in forensic investigations [https://ejfs.springeropen.com/articles/10.1186/s41935-025-00484-8]
- 4. Advantages and Disadvantages of MS-Based Relative ... [https://www.mtoz-biolabs.com/advantages-and-disadvantages-of-ms-based-relative-protein-quantification.html]
- 5. Multiplex Assays vs ELISA in Complex Disease States [https://www.quanterix.com/what-you-need-to-know-about-multiplex-assays-vs-elisa-when-assessing-complex-disease-states/]
- 6. Comparison of Commercial ELISA Kits, a Prototype Multiplex ... [https://pmc.ncbi.nlm.nih.gov/articles/PMC6963675/]
- 7. Comparative assessment of a multiplex micro-chip ... [https://www.sciencedirect.com/science/article/abs/pii/S0022175925001073]
- 8. Method comparison and re-calibration of three top-used ... [https://www.sciencedirect.com/science/article/abs/pii/S0009898125002311]
- 9. Detection and Quantitation of Small Proteins Using Mass ... [https://www.sciencedirect.com/science/article/pii/S1535947625001513]
- 10. Immunoassays and Mass Spectrometry for Determination ... [https://pmc.ncbi.nlm.nih.gov/articles/PMC11046482/]
- 11. A Tutorial Review of Labeling Methods in Mass ... [https://pmc.ncbi.nlm.nih.gov/articles/PMC11342459/]
- 12. Label-Based and Label-Free Strategies for Protein Quantitation - PubMed [https://pubmed.ncbi.nlm.nih.gov/27975282/]
- 13. Label-Free Quantification Mass Spectrometry [https://www.creative-proteomics.com/resource/label-free-quantification-mass-spectrometry-guide.htm]
- 14. Tools for Label-free Peptide Quantification[image] - PMC [https://pmc.ncbi.nlm.nih.gov/articles/PMC3591650/]
- 15. Issues and Applications in Label-Free Quantitative Mass ... [https://pmc.ncbi.nlm.nih.gov/articles/PMC3562690/]
- 16. IonQuant Enables Accurate and Sensitive Label-Free ... [https://www.sciencedirect.com/science/article/pii/S1535947621000505]
- 17. Label-Free Quantitation | Thermo Fisher Scientific - US [https://www.thermofisher.com/us/en/home/industrial/mass-spectrometry/proteomics-mass-spectrometry/quantitative-proteomics-mass-spectrometry/label-free-quantitation.html]
- 18. Label-Free vs. Label-Based Quantitative Proteomics | Silantes [https://silantes.com/label-vs-label-free-quantitative-proteomics/]
- 19. Label-free vs Label-based Proteomics [https://www.creative-proteomics.com/resource/label-free-vs-labe-proteomics.htm]
- 20. Sensitivity and Specificity Fundamentals [https://www.beckmancoulter.com/en/blog/diagnostics/sensitivity-and-specificity-fundamentals]
- 21. Overview of Protein Assays Methods [https://www.thermofisher.com/us/en/home/life-science/protein-biology/protein-biology-learning-center/protein-biology-resource-library/pierce-protein-methods/overview-protein-assays.html]
- 22. Extending the dynamic range of biomarker quantification ... [https://www.nature.com/articles/s41467-023-39772-z]
- 23. Comparative evaluation of four new immunoassays and LC ... [https://pubmed.ncbi.nlm.nih.gov/40584217/]
- 24. Comparative evaluation of four new immunoassays and LC ... [https://pmc.ncbi.nlm.nih.gov/articles/PMC12205834/]
- 25. Conjugating immunoassays to mass spectrometry [https://pmc.ncbi.nlm.nih.gov/articles/PMC7539833/]
- 26. Mass spectrometry-based proteomics as an emerging tool in ... [https://clinicalproteomicsjournal.biomedcentral.com/articles/10.1186/s12014-023-09424-x]
- 27. Comparative evaluation of Olink Explore 3072 and mass ... [https://pmc.ncbi.nlm.nih.gov/articles/PMC12586489/]
- 28. Comparison of immunoassay- with mass spectrometry-derived ... [https://molecularneurodegeneration.biomedcentral.com/articles/10.1186/s13024-023-00689-2]
- 29. Comparative evaluation of four new immunoassays and LC ... [https://www.sciencedirect.com/science/article/pii/S235255172500037X]
- 30. Cortisol Measurements in Cushing's Syndrome: Immunoassay ... [https://pmc.ncbi.nlm.nih.gov/articles/PMC7054699/]
- 31. Performance of LC–MS/MS and immunoassay based 24-h ... [https://www.sciencedirect.com/science/article/abs/pii/S0960076018305788]
- 32. CORTU - Overview: Cortisol, Free, 24 Hour, Urine [https://www.mayocliniclabs.com/test-catalog/overview/8546]
- 33. Comparison of Direct and Extraction Immunoassay ... [https://synapse.koreamed.org/articles/1516083887]
- 34. Urinary Free Cortisol Determination and Interferences ... [https://www.mdpi.com/2218-1989/13/10/1063]
- 35. Determination of human urinary cortisol, cortisone and ... [https://www.sciencedirect.com/science/article/pii/S0009898125002037]
- 36. Performance of LC-MS/MS and Immunoassay Based 24-h ... [https://pubmed.ncbi.nlm.nih.gov/30959155/]
- 37. Monitoring process-related impurities in biologics–host cell ... [https://pmc.ncbi.nlm.nih.gov/articles/PMC8483941/]
- 38. Detection of host cell microprotein impurities in antibody ... [https://www.nature.com/articles/s41467-024-51870-0]
- 39. HCP Detection and Monitoring: BEBPA Insights [https://www.bioprocessintl.com/qa-qc/ebook-process-related-impurities-emerging-strategies-for-detection-identification-and-management-of-host-cell-proteins]
- 40. Advanced mass spectrometry techniques for monitoring ... [https://www.sciencedirect.com/science/article/pii/S0167779925003117]
- 41. Comparing immunoassay and mass spectrometry ... [https://www.sciencedirect.com/science/article/pii/S0306453025001027]
- 42. Points to Consider in Quality Control Method Validation ... [https://www.bioprocessintl.com/qa-qc/points-to-consider-in-quality-control-method-validation-and-transfer]
- 43. Proteomic evaluation of genetically modified crops [https://pmc.ncbi.nlm.nih.gov/articles/PMC3590489/]
- 44. Protein Analysis Techniques Explained [https://www.atascientific.com.au/3-protein-analysis-techniques/]
- 45. Development of Tier 2 LC-MRM-MS protein quantification ... [https://www.sciencedirect.com/science/article/pii/S2667145X22000499]
- 46. iTRAQ-based quantitative tissue proteomic analysis of ... [https://www.nature.com/articles/s41598-018-35996-y]
- 47. Comparative proteomic analysis of genetically modified maize ... [https://proteomesci.biomedcentral.com/articles/10.1186/1477-5956-11-46]
- 48. Comparison of three multiplex immunoassays for ... [https://www.nature.com/articles/s41598-025-23579-7]
- 49. Current Status of Protein Quantification Technologies [https://www.bioprocessintl.com/assays/current-status-of-protein-quantification-technologies]
- 50. 2025 Proteomics Breakthroughs [https://www.genengnews.com/topics/drug-discovery/2025-proteomics-breakthroughs/]
- 51. News Details - Investors - Thermo Fisher Scientific [https://ir.thermofisher.com/investors/news-events/news/news-details/2025/Thermo-Fisher-Scientific-Unveils-Next-generation-Mass-Spectrometers-at-ASMS-2025-to-Revolutionize-Biopharma-Applications-and-Omics-Research/default.aspx]
- 52. ASMS 2025: High Performance MS for 'Omics and PFAS [https://www.labcompare.com/10-Featured-Articles/619763-ASMS-2025-High-Performance-MS-for-Omics-and-PFAS/]
- 53. nELISA: a high-throughput, high-plex platform enables ... [https://www.nature.com/articles/s41592-025-02861-6]
- 54. Innovations Unveiled: Highlights from ASMS 2025 [https://www.sepscience.com/innovations-unveiled-highlights-from-asms-2025-12029]
- 55. Benchmarking informatics workflows for data-independent ... [https://www.nature.com/articles/s41467-025-65174-4]
- 56. Recent developments in mass-spectrometry-based targeted proteomics of clinical cancer biomarkers | Clinical Proteomics | Full Text [https://clinicalproteomicsjournal.biomedcentral.com/articles/10.1186/s12014-024-09452-1]
- 57. Immunoassays: Analytical and Clinical Performance ... [https://www.mdpi.com/1422-0067/25/4/2080]
- 58. Accuracy and Reproducibility in Quantification of Plasma Protein Concentrations by Mass Spectrometry without the Use of Isotopic Standards - PMC [https://pmc.ncbi.nlm.nih.gov/articles/PMC4608811/]
- 59. Comparative evaluation of Olink Explore 3072 and mass ... [https://www.nature.com/articles/s42004-025-01753-2]
- 60. Overview of Mass Spectrometry for Protein Analysis [https://www.thermofisher.com/us/en/home/life-science/protein-biology/protein-biology-learning-center/protein-biology-resource-library/pierce-protein-methods/overview-mass-spectrometry.html]
- 61. Discovering Cross-Reactivity in Urine Drug Screening ... [https://pmc.ncbi.nlm.nih.gov/articles/PMC7055671/]
- 62. Interferences in Immunoassay - PMC - PubMed Central - NIH [https://pmc.ncbi.nlm.nih.gov/articles/PMC1904417/]
- 63. Protein Quantitation Using Mass Spectrometry - PMC [https://pmc.ncbi.nlm.nih.gov/articles/PMC3758905/]
- 64. A Difficult Challenge for the Clinical Laboratory: Accessing ... [https://www.sciencedirect.com/science/article/pii/S2374289521003274]
- 65. Multicenter comparison of analytical interferences of 25-OH ... [https://pubmed.ncbi.nlm.nih.gov/38188654/]
- 66. Multicenter comparison of analytical interferences of 25-OH ... [https://www.sciencedirect.com/science/article/pii/S2352551723000410]
- 67. Tutorial: best practices and considerations for mass ... [https://www.nature.com/articles/s41596-021-00566-6]
- 68. Digestions [https://www.analytik-jena.com/products/chemical-analysis/sample-preparation/digestions/]
- 69. Optimization of an acid digestion procedure for the ... [https://pmc.ncbi.nlm.nih.gov/articles/PMC5726879/]
- 70. The Fundamental Flaws of Immunoassays and Potential ... [https://pmc.ncbi.nlm.nih.gov/articles/PMC2720067/]
- 71. Protein quantification across hundreds of experimental ... [https://pmc.ncbi.nlm.nih.gov/articles/PMC2732709/]
- 72. Ultrasensitive Bead-Based Immunoassay for Real-Time ... [https://pmc.ncbi.nlm.nih.gov/articles/PMC12109733/]
- 73. Antibody Industry Trends: October 2025 | Designing ... [https://www.linkedin.com/pulse/antibody-industry-trends-october-2025-designing-antibodies-artificial-ufxme]
- 74. Designed by AI: the future of antibody drugs [https://pharmaceutical-journal.com/article/feature/designed-by-ai-the-future-of-antibody-drugs]
- 75. Mass Spectrometric Immunoassays in Characterization of ... [https://www.mdpi.com/2227-7382/4/1/13]
- 76. Comparisons of Immunoassay and Mass Spectrometry ... [https://pmc.ncbi.nlm.nih.gov/articles/PMC3667264/]
- 77. Novel LC-MS/MS method for measuring methotrexate in ... [https://link.springer.com/article/10.1007/s43440-025-00807-5]
- 78. Statistical analysis in method comparison studies part one [https://acutecaretesting.org/en/articles/statistical-analysis-in-method-comparison-studies-part-one]
- 79. The Comparison of Methods Experiment [https://www.westgard.com/lessons/basic-method-validation/lesson23.html]
- 80. Comparison of highly sensitive, multiplex immunoassay platforms for streamlined clinical cytokine quantification - PubMed [https://pubmed.ncbi.nlm.nih.gov/39703153/]
- 81. A stepwise guide to navigating multiplex immunoassay ... [https://olink.com/blog/a-stepwise-guide-to-navigating-multiplex-immunoassay-data-analysis]
- 82. Visualization and quality control tools for large-scale ... [https://pmc.ncbi.nlm.nih.gov/articles/PMC10936381/]
- 83. FDA Guidance for Industry on Bioanalytical Method ... [https://labs.iqvia.com/blog/fda-guidance-bioanalytical-method-validation-biomarkers]
- 84. Principles of Analytic Validation of Immunohistochemical ... [https://www.cap.org/protocols-and-guidelines/cap-guidelines/current-cap-guidelines/principles-of-analytic-validation-of-immunohistochemical-assays]
- 85. Development, qualification, and application of a highly ... [https://pubmed.ncbi.nlm.nih.gov/41084101/]
- 86. Mass Spectrometer Costs: How Much Should You Budget? [https://www.excedr.com/blog/mass-spectrometer-pricing-guide]
- 87. Rates - UW School of Pharmacy - University of Washington [https://sop.washington.edu/department-of-medicinal-chemistry/research/mass-spectrometry-center/rates/]
- 88. Services & Fees (in-house rates) - Mass Spectrometry [https://wp.uthscsa.edu/mass-spec/services/fees/]
- 89. Development of a High-throughput Mass Spectrometry-based ... [https://pmc.ncbi.nlm.nih.gov/articles/PMC10909588/]
- 90. Optimizing ADC Bioassays: LC-MS/MS Blends Speed with ... [https://www.americanpharmaceuticalreview.com/Featured-Articles/613592-Optimizing-ADC-Bioassays-LC-MS-MS-Blends-Speed-with-Cost-Effectiveness/]
- 91. Immunoassay Methods and their Applications in ... [https://pmc.ncbi.nlm.nih.gov/articles/PMC3614608/]
- 92. Advances in high‐throughput mass spectrometry in drug ... [https://pmc.ncbi.nlm.nih.gov/articles/PMC9832828/]
- 93. Immunoassay Methods - Assay Guidance Manual - NCBI - NIH [https://www.ncbi.nlm.nih.gov/books/NBK92434/]
- 94. Quantifying Proteins by Mass Spectrometry [https://www.chromatographyonline.com/view/quantifying-proteins-mass-spectrometry]
- 95. Multiplex Immunoassays: Five Tips for Optimizing Your ... [https://www.bioradiations.com/multiplex-immunoassays-five-tips-for-optimizing-your-experiments/]