HPLC and GC-MS in Food Analysis: A Comprehensive Guide to Methods, Applications, and Optimization for Researchers
This article provides a comprehensive overview of High-Performance Liquid Chromatography (HPLC) and Gas Chromatography-Mass Spectrometry (GC-MS) methodologies for the analysis of food components and contaminants.
HPLC and GC-MS in Food Analysis: A Comprehensive Guide to Methods, Applications, and Optimization for Researchers
Abstract
This article provides a comprehensive overview of High-Performance Liquid Chromatography (HPLC) and Gas Chromatography-Mass Spectrometry (GC-MS) methodologies for the analysis of food components and contaminants. Tailored for researchers, scientists, and drug development professionals, it covers the foundational principles of both techniques, explores their specific applications across diverse food matrices—from mycotoxins in grains to PFAS in packaged foods—and offers practical troubleshooting and optimization strategies. The content further delves into method validation protocols and a comparative analysis of HPLC versus GC-MS, empowering professionals to select and implement the most appropriate analytical technique for their specific food safety and quality research objectives.
Core Principles of HPLC and GC-MS: Building a Foundation for Food Analysis
High-performance liquid chromatography (HPLC) and gas chromatography-mass spectrometry (GC-MS) represent two cornerstone analytical techniques in modern chemical analysis. HPLC is a broad analytical chemistry technique used to separate, identify, and quantify compounds in a liquid mixture using pressure-driven flow through a column packed with a stationary phase [1]. GC-MS combines two analytical tools—gas chromatography for separating volatile components and mass spectrometry for identification—to provide a powerful system for analyzing complex mixtures [2]. Within food analysis research, these techniques enable scientists to address critical challenges related to food safety, authenticity, quality control, and nutritional profiling, supporting the development of safer and higher-quality food products.
Core Principles and Instrumentation
High-Performance Liquid Chromatography (HPLC)
The fundamental principle of HPLC is the distribution of analytes between a mobile phase (liquid solvent) and a stationary phase (packing material within a column) [3]. Separation occurs as different compounds in a sample interact to varying degrees with the stationary phase, leading to different retention times as they are carried by the mobile phase through the system [1]. A typical HPLC instrument consists of four major components: a pump to deliver the mobile phase, an autosampler to inject the sample, a column for separation, and a detector to measure the compounds [1].
Separation Modes: HPLC separations are performed in two primary elution modes [1] [3]:
- Isocratic Elution: Uses a constant mobile phase composition throughout the analysis.
- Gradient Elution: Employs a changing mobile phase composition during the separation, typically by mixing two or more solvents in varying proportions.
Table 1: Key Chromatographic Parameters in HPLC
| Parameter | Symbol | Definition | Significance |
|---|---|---|---|
| Retention Time | tR | Time between sample injection and maximum peak signal | Compound identification |
| Delay Time | t0 | Time for non-retained compound to reach detector | System dead volume measurement |
| Peak Width | w | Width of the peak at baseline | Measure of separation efficiency |
| Tailing Factor | T | Ratio of trailing to leading peak width at 10% height (T = b/a) | Peak symmetry measurement |
Gas Chromatography-Mass Spectrometry (GC-MS)
GC-MS operates by first separating chemical mixtures using gas chromatography, then identifying and quantifying the components with mass spectrometry [2]. In the GC stage, a liquid sample is vaporized and carried by an inert gas through a column where separation occurs based on volatility and polarity [4]. The separated compounds then enter the mass spectrometer, where they are ionized (typically by electron ionization), fragmented, and analyzed based on their mass-to-charge ratios (m/z) [2] [4].
Mass Spectrometry Detection: GC-MS systems employ different mass analyzer configurations [4]:
- Single Quadrupole (GC-MS): Suitable for both targeted and untargeted analysis.
- Triple Quadrupole (GC-MS/MS): Provides higher selectivity and sensitivity for targeted quantification.
- High-Resolution Accurate Mass (HRAM) Systems: Enable comprehensive sample characterization with precise mass measurement.
Comparative Operational Principles
Table 2: Comparison of HPLC and GC-MS Core Characteristics
| Characteristic | HPLC | GC-MS |
|---|---|---|
| Separation Principle | Distribution between liquid mobile phase and solid stationary phase | Partitioning between gaseous mobile phase and liquid stationary phase |
| Mobile Phase | Liquid solvents (water, acetonitrile, methanol) | Inert gas (helium, hydrogen, nitrogen) |
| Sample Requirements | Non-volatile and semi-volatile compounds; liquid samples | Volatile and thermally stable compounds; requires vaporization |
| Common Detectors | UV-Vis, fluorescence, refractive index, mass spectrometry | Mass spectrometer (quadrupole, ion trap, TOF) |
| Primary Applications in Food Analysis | Sugars, organic acids, vitamins, pigments, phenolic compounds, mycotoxins [5] | Pesticides, volatile aromas, fatty acids, environmental contaminants [4] |
Advanced Techniques and Technological Innovations
HPLC Advancements
The field of liquid chromatography continues to evolve with significant advancements in column technology and system capabilities. Recent innovations focus on improving separation efficiency, peak shape, and analytical sensitivity [6]:
- Ultra-High-Performance Liquid Chromatography (UHPLC): Utilizes smaller stationary phase particles (<2 μm) and higher operating pressures (600-1200 bar) for improved resolution, sensitivity, and faster analysis compared to standard HPLC [1].
- Advanced Column Chemistries: New stationary phases including superficially porous particles (e.g., fused-core technology) and specialized ligands (e.g., phenyl-hexyl, biphenyl) provide enhanced selectivity for challenging separations [6].
- Inert Hardware: Columns with passivated or metal-free hardware minimize analyte-surface interactions, improving recovery for metal-sensitive compounds like phosphorylated species and certain PFAS compounds [6].
GC-MS Advancements
Modern GC-MS systems have seen substantial improvements in separation power and detection capabilities:
- Comprehensive Two-Dimensional GC (GC×GC): Enhances separation power by employing two columns with different stationary phases, significantly increasing peak capacity for complex samples [7].
- High-Resolution Mass Spectrometry: Provides accurate mass measurements that enable elemental composition determination and facilitate unknown compound identification [4].
- Low-Pressure GC-MS: Uses shorter mega-bore columns under reduced pressure conditions to achieve faster analysis times while maintaining separation efficiency [7].
Application Protocols in Food Analysis
Protocol: HPLC Analysis of PFAS in Food Samples
Principle: This method describes the determination of per- and polyfluoroalkyl substances (PFAS) in food using reversed-phase HPLC coupled with tandem mass spectrometry (LC-MS/MS), based on EPA Method 1633 [8].
Materials and Reagents:
- HPLC System: UHPLC system capable of gradient elution
- Analytical Column: C18 reversed-phase column (e.g., 2.1 × 100 mm, 1.7-2.7 μm particle size)
- Mass Spectrometer: Triple quadrupole MS with electrospray ionization (ESI)
- Solvents: LC-MS grade water, methanol, and acetonitrile
- Ammonium acetate for mobile phase additive
- Reference Standards: Target PFAS compounds (PFOA, PFOS, etc.)
Sample Preparation:
- Extraction: Homogenize food sample and extract using solid-phase extraction (SPE) or QuEChERS methodology.
- Clean-up: Perform dispersive solid-phase extraction (d-SPE) to remove matrix interferents.
- Concentration: Evaporate extract to near dryness under gentle nitrogen stream and reconstitute in injection solvent.
Chromatographic Conditions:
- Mobile Phase A: 2mM ammonium acetate in water
- Mobile Phase B: Methanol or acetonitrile
- Gradient Program: Initial 20% B, increase to 95% B over 10 minutes, hold for 3 minutes, re-equilibrate
- Flow Rate: 0.3-0.5 mL/min
- Column Temperature: 40°C
- Injection Volume: 5-10 μL
Mass Spectrometry Parameters:
- Ionization Mode: Electrospray ionization (ESI) in negative mode
- Detection Mode: Multiple reaction monitoring (MRM)
- Source Temperature: 300°C
- Nebulizer Gas: Nitrogen
Quantification:
- Prepare calibration standards covering expected concentration range (typically 0.1-100 ng/mL).
- Use internal standard calibration with isotopically labeled PFAS analogs.
- Establish retention times and MRM transitions for each target analyte.
Protocol: GC-MS Analysis of Food Aroma Compounds
Principle: This method describes the characterization of volatile aroma compounds in food products using headspace solid-phase microextraction (HS-SPME) coupled with GC-MS, applicable for flavor profiling and authenticity studies [9].
Materials and Reagents:
- GC-MS System: Gas chromatograph with mass spectrometer detector
- GC Column: Mid-polarity stationary phase (e.g., 5% phenyl polysiloxane, 30 m × 0.25 mm × 0.25 μm)
- SPME Fiber: Divinylbenzene/Carboxen/Polydimethylsiloxane (DVB/CAR/PDMS) coating
- Internal Standards: Deuterated compounds or alkylpyrazines for quantification
Sample Preparation:
- Homogenization: Grind solid food samples to uniform consistency.
- Equilibration: Weigh 2-5 g sample into 20 mL headspace vial, add internal standard.
- Extraction: Incubate sample at 40-60°C for 10-15 minutes, then expose SPME fiber to headspace for 30-45 minutes.
GC Conditions:
- Carrier Gas: Helium, constant flow 1.0 mL/min
- Injector Temperature: 250°C, splitless mode
- Oven Program: 40°C (hold 2 min), ramp to 240°C at 5°C/min, final hold 5 min
- Transfer Line Temperature: 250°C
Mass Spectrometry Conditions:
- Ionization Mode: Electron ionization (EI) at 70 eV
- Ion Source Temperature: 230°C
- Scan Range: m/z 35-350
- Solvent Delay: 2-3 minutes
Data Analysis:
- Identify compounds by comparing mass spectra with NIST/Adams libraries.
- Perform semi-quantification using internal standard method.
- Apply multivariate statistical analysis (PCA, PLS-DA) for pattern recognition when comparing multiple samples.
The Scientist's Toolkit: Essential Research Reagents and Materials
Table 3: Essential Research Reagents and Materials for HPLC and GC-MS Food Analysis
| Item | Function | Application Examples |
|---|---|---|
| C18 Reversed-Phase Columns | Separation of non-polar to moderately polar compounds | PFAS, pesticides, lipids, fat-soluble vitamins [8] [6] |
| HILIC Columns | Separation of polar and hydrophilic compounds | Sugars, organic acids, amino acids, water-soluble vitamins |
| Phenyl-Hexyl and Biphenyl Columns | Alternative selectivity through π-π interactions | Aromatic compounds, isomeric separations [6] |
| Inert Column Hardware | Minimize metal-analyte interactions | Phosphorylated compounds, chelating PFAS, metal-sensitive analytes [6] |
| LC-MS Grade Solvents | High purity mobile phases with minimal background | All LC-MS applications to reduce signal interference |
| SPME Fibers | Extraction and concentration of volatile compounds | Food aroma profiling, contaminant analysis [9] |
| QuEChERS Extraction Kits | Rapid sample preparation for complex matrices | Pesticide residues, veterinary drugs, contaminants [7] |
| Mass Spectrometry Reference Libraries | Compound identification through spectral matching | Unknown compound identification, aroma compound characterization [9] |
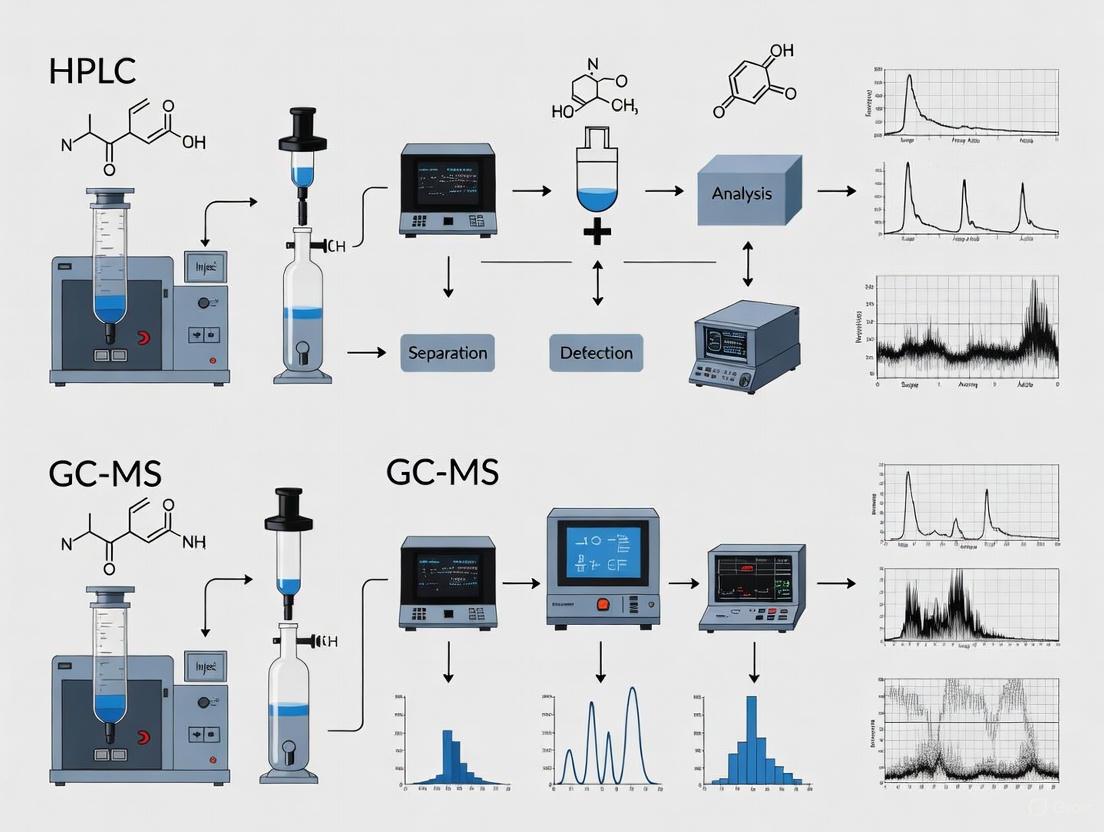
Workflow and Data Integration Diagrams
HPLC Instrumental Workflow
GC-MS Instrumental Workflow
Integrated Food Analysis Strategy
HPLC and GC-MS provide complementary analytical capabilities that form the foundation of modern food component analysis. HPLC excels in separating non-volatile and semi-volatile compounds, while GC-MS offers superior performance for volatile and thermally stable analytes. The continuing advancement of these technologies—including the development of more efficient separation columns, more sensitive detection systems, and improved sample preparation methodologies—ensures their ongoing critical role in food safety, authenticity, and quality research. The integration of these analytical techniques with chemometrics and machine learning approaches represents the cutting edge of food analysis, enabling researchers to extract maximum information from complex food matrices and address increasingly sophisticated analytical challenges.
The selection of an appropriate analytical technique is foundational to the success of any chemical analysis in food research. The fundamental physicochemical properties of the target analytes—specifically, their volatility and thermal stability—directly dictate the choice between High-Performance Liquid Chromatography (HPLC) and Gas Chromatography-Mass Spectrometry (GC-MS) [10] [11]. Within the context of food component analysis, an erroneous selection can lead to incomplete analysis, degraded compounds, and ultimately, inaccurate data.
This application note provides a structured framework for researchers, scientists, and drug development professionals to make an informed choice between HPLC and GC-MS. We detail the core principles, provide a direct comparative analysis, and offer practical experimental protocols for the analysis of food components, ensuring data reliability and method robustness in alignment with the rigorous demands of thesis research.
Core Principles and Comparative Analysis
High-Performance Liquid Chromatography (HPLC)
HPLC separates compounds dissolved in a liquid mobile phase using a solid stationary phase under high pressure [12]. Its principal advantage lies in its applicability to a wide range of compounds that are non-volatile, polar, or thermally unstable [10] [11]. Since the separation occurs in a liquid phase at ambient or controlled temperatures, it is ideally suited for analytes that would decompose or not vaporize at the temperatures required for GC-MS. This makes it indispensable for analyzing many pharmaceuticals, biomolecules, and food components like additives and pigments [12] [13].
Gas Chromatography-Mass Spectrometry (GC-MS)
GC-MS combines gas chromatography, which separates volatile compounds, with mass spectrometry, which provides definitive identification [14]. In GC, the sample is vaporized and carried by an inert gas through a column. Separation is based on the analyte's volatility and its interaction with the column's stationary phase [10]. The technique is exceptionally powerful for separating and identifying volatile and thermally stable compounds [11]. However, its major limitation is that the analyte must survive the vaporization process without decomposition. For polar or thermally labile compounds, this often necessitates a derivatization step to increase volatility and thermal stability [10] [11].
Technique Selection Guide
The table below summarizes the key characteristics of each technique to guide method selection.
Table 1: Comparative Analysis of HPLC and GC-MS for Food Component Analysis
| Aspect | HPLC | GC-MS |
|---|---|---|
| Analyte Suitability | Non-volatile, thermally unstable, polar, and high-molecular-weight compounds [10] [11] | Volatile and thermally stable compounds; polar compounds often require derivatization [10] [11] |
| Separation Principle | Differential partitioning between liquid mobile phase and solid stationary phase [12] | Partitioning between a gaseous mobile phase and a liquid stationary phase, based on volatility/polarity [14] |
| Typical Food Applications | Additives (e.g., preservatives, sweeteners), vitamins, organic acids, mycotoxins, pigments, antibiotics [13] | Aroma compounds, flavor volatiles, pesticide residues, fatty acids, volatile organic pollutants [10] [15] |
| Key Advantage | Broad applicability without need for volatility; gentle on labile molecules [12] [10] | High resolution and peak capacity for volatile mixtures; powerful identification via MS libraries [10] [14] |
| Primary Limitation | Higher solvent consumption; generally slower than GC; can have lower resolution [12] [10] | Limited to volatile/stable analytes; derivatization adds complexity; high temperatures can degrade samples [10] [11] |
The following decision flowchart provides a systematic approach for selecting the appropriate technique based on the analyte's properties.
Detailed Experimental Protocols
Protocol 1: HPLC Analysis of Non-Volatile Food Additives
This protocol is designed for the simultaneous determination of synthetic sweeteners (e.g., acesulfame, saccharin) and preservatives (e.g., benzoate, sorbate) in a beverage matrix [13].
Research Reagent Solutions
Table 2: Essential Reagents and Materials for HPLC Analysis
| Item | Function | Specification/Note |
|---|---|---|
| HPLC System | Instrumentation | With binary pump, autosampler, and DAD/UV-Vis detector [12] |
| C18 Column | Stationary Phase | 150 mm x 4.6 mm, 5 µm particle size for reversed-phase separation [16] |
| Ammonium Acetate Buffer | Mobile Phase Component | Provides buffered pH for consistent ionization of analytes [16] |
| HPLC-Grade Acetonitrile | Mobile Phase Component | Organic modifier for gradient elution [16] |
| Syringe Filters | Sample Cleanup | 0.22 µm or 0.45 µm, nylon or PVDF, to remove particulates [17] |
Sample Preparation Workflow
The sample preparation and analysis process is outlined below.
Procedure:
- Sample Preparation: Degas the beverage sample by sonication for 5 minutes. Dilute 1 mL of the degassed sample to 10 mL with mobile phase A (20 mM Ammonium Acetate, pH 4.5). Pass the diluted sample through a 0.45 µm syringe filter into an HPLC vial [17] [16].
- Mobile Phase Preparation: Prepare mobile phase A (20 mM Ammonium Acetate in HPLC-grade water, adjust pH to 4.5 with acetic acid) and mobile phase B (HPLC-grade Acetonitrile). Degas both phases by sonication or sparging with an inert gas [18].
- HPLC Method Conditions:
- Column: C18 (150 mm x 4.6 mm, 5 µm)
- Flow Rate: 1.0 mL/min
- Temperature: 30 °C
- Injection Volume: 10 µL
- Detection: UV-Vis Diode Array Detector (DAD), 230 nm
- Gradient Program: | Time (min) | %A | %B | | :--- | :--- | :--- | | 0 | 95 | 5 | | 10 | 80 | 20 | | 15 | 50 | 50 | | 15.1 | 95 | 5 | | 20 | 95 | 5 |
- Data Analysis: Identify compounds by comparing retention times with authentic standards. Quantify using external calibration curves prepared from standard solutions [17].
Protocol 2: GC-MS Analysis of Volatile Flavor Compounds
This protocol is suitable for profiling the volatile organic compounds responsible for the aroma in fruits (e.g., apples, grapes) using Headspace Solid-Phase Microextraction (HS-SPME) [15].
Research Reagent Solutions
Table 3: Essential Reagents and Materials for GC-MS Analysis
| Item | Function | Specification/Note |
|---|---|---|
| GC-MS System | Instrumentation | With split/splitless injector and a mass spectrometer detector [14] |
| Mid-Polarity GC Column | Stationary Phase | e.g., (5%-Phenyl)-methylpolysiloxane, 30 m x 0.25 mm ID, 0.25 µm film [14] |
| SPME Fiber | Sample Extraction | 50/30 µm DVB/CAR/PDMS is common for broad-range volatiles [15] |
| Internal Standard | Quantification Control | e.g., 4-Methyl-2-pentanone or deuterated analogs, corrects for injection variability [19] |
| Helium Carrier Gas | Mobile Phase | High-purity (99.999%) carrier gas for GC [14] |
Sample Preparation and Analysis Workflow
The workflow for analyzing volatile compounds via HS-SPME-GC-MS is as follows.
Procedure:
- Sample Preparation: Homogenize 5.0 g of fresh fruit pulp in a sealed container. Precisely weigh 2.0 g of the homogenate into a 20 mL headspace vial. Add 10 µL of internal standard solution (e.g., 100 ppm 4-Methyl-2-pentanone) and immediately cap the vial [19] [15].
- HS-SPME Extraction: Place the vial in a heated autosampler tray. Condition the SPME fiber (50/30 µm DVB/CAR/PDMS) according to manufacturer instructions. The automated method should include:
- Incubation: 60°C for 10 min with agitation.
- Extraction: Expose the fiber to the vial headspace at 60°C for 30 min.
- Desorption: Inject the fiber into the GC injector port for 5 min at 250°C in splitless mode [15].
- GC-MS Method Conditions:
- Column: (5%-Phenyl)-methylpolysiloxane, 30 m x 0.25 mm ID, 0.25 µm df
- Carrier Gas: Helium, constant flow of 1.0 mL/min
- Oven Program: | Time (min) | Rate (°C/min) | Temperature (°C) | Hold (min) | | :--- | :--- | :--- | :--- | | 0 | - | 40 | 2 | | 5 | 10 | 150 | 0 | | 10 | 25 | 250 | 2 |
- Injector: 250°C, splitless mode
- Mass Spectrometer: Electron Impact (EI) ionization at 70 eV; ion source temperature: 230°C; quadrupole temperature: 150°C; acquisition mode: Scan (m/z 35-350) [14].
- Data Analysis: Identify compounds by searching acquired mass spectra against commercial libraries (e.g., NIST). Use the internal standard for semi-quantification. For precise quantification, employ matrix-matched calibration curves to compensate for matrix effects [19] [15].
Critical Considerations for Robust Method Development
Managing Matrix Effects in Food Analysis
Matrix effects, where co-extracted compounds from the sample interfere with the analysis, are a significant challenge in food analysis, particularly in GC-MS [19]. These effects can cause signal suppression or enhancement, leading to inaccurate quantification.
- GC-MS: Matrix effects often manifest as signal enhancement due to the matrix components blocking active sites in the GC system, thus improving the transfer of the analyte into the column [19]. This is prevalent in complex food matrices.
- HPLC-MS: Matrix effects typically result in ion suppression in the mass spectrometer interface, reducing the signal for the target analyte [17].
Mitigation Strategies:
- Matrix-Matched Calibration: Prepare calibration standards in a blank extract of the same food matrix (e.g., pesticide-free apple extract). This is the most effective and widely recommended approach, especially for GC-MS analysis of pesticides [19].
- Sample Dilution: If the method sensitivity allows, diluting the sample extract can reduce the concentration of interfering matrix components [17].
- Improved Sample Cleanup: Utilize additional or more selective sample preparation steps, such as Solid-Phase Extraction (SPE), to remove specific interfering compounds from the extract [17] [19].
- Stable Isotope-Labeled Internal Standards: For LC-MS and GC-MS, these standards behave identically to the analyte during sample preparation and ionization, correcting for both losses and matrix effects [19].
Ensuring HPLC Retention Time Precision
Precise and reproducible retention times are critical for reliable analyte identification in HPLC. Several factors must be controlled [18]:
- Mobile Phase Composition: Use HPLC-grade solvents, prepare buffers fresh daily, and maintain consistent pH and ionic strength. Always degas the mobile phase to prevent air bubbles from affecting the pump's flow rate [18].
- Temperature Control: Maintain a constant column temperature using a column oven. Fluctuations in ambient lab temperature can directly impact retention times [18].
- Column Health and Maintenance: A column's performance degrades with use. Monitor system pressure and peak shape. Follow a regular column cleaning schedule and replace columns after ~1000-2000 injections or when performance drops [18].
The strategic selection between HPLC and GC-MS, grounded in a clear understanding of analyte volatility and thermal stability, is a critical determinant of success in food component analysis. HPLC serves as the versatile tool for a vast array of non-volatile and labile food compounds, from additives to nutrients. In contrast, GC-MS offers unparalleled separation and identification power for volatile flavor and aroma profiles, as well as for many pesticide residues.
By adhering to the structured protocols for method selection, sample preparation, and instrumental analysis outlined in this document, researchers can develop robust, reliable, and validated methods. Meticulous attention to mitigating matrix effects and controlling chromatographic parameters will ensure the generation of high-quality, reproducible data essential for rigorous scientific research, quality control, and regulatory compliance in the food industry.
Mass spectrometry (MS) has become a cornerstone analytical technique in food component analysis due to its powerful capability to identify and quantify chemical compounds with high specificity and sensitivity. When coupled with separation techniques like Gas Chromatography (GC) and High-Performance Liquid Chromatography (HPLC), MS enables researchers to detect a vast array of food components, from lipids and allergens to contaminants and flavor compounds, even within complex matrices. The continuous technological advancements in mass spectrometry are pushing the boundaries of detection, providing researchers and drug development professionals with the precise tools necessary to ensure food safety, quality, and nutritional value. This document outlines specific application notes and detailed protocols that highlight the critical role of MS in modern food analysis.
The field of mass spectrometry is evolving rapidly, with recent innovations focusing on improving resolution, speed, and confidence in compound identification. Key developments directly enhance the specificity and sensitivity required for challenging food matrices.
Next-Generation Orbital Trap Instruments
Thermo Fisher Scientific's recent launch of the Orbitrap Astral Zoom MS demonstrates a significant leap in performance for proteomics and biopharma applications, with metrics that are equally relevant for complex food protein analysis. This instrument delivers a 35% faster scan speed, 40% higher throughput, and a 50% expansion in multiplexing capabilities compared to its predecessor, enabling deeper coverage of protein biomarkers in food products [20].
The Rise of 4D-Metabolomics and Lipidomics
Bruker's novel timsMetabo mass spectrometer introduces a fourth dimension of separation—Trapped Ion Mobility Spectrometry (TIMS)—to liquid chromatography-mass spectrometry. This 4D-LC-TIMS-MS/MS platform provides:
- Unprecedented sensitivity for small molecule analysis.
- Collision Cross Section (CCS) measurements as a stable, reproducible molecular identifier, increasing annotation confidence.
- Enhanced separation of isomers and isobars, which is crucial for accurately profiling sugars, lipids, and other stereosensitive compounds in food. The system generates a "digital metabolome archive" for each sample, facilitating AI and machine learning data analysis [21].
Table 1: Performance Comparison of Advanced Mass Spectrometers
| Instrument/Technology | Key Advancement | Impact on Specificity & Sensitivity | Primary Food Application |
|---|---|---|---|
| Orbitrap Astral Zoom MS [20] | 35% faster scan speed; 40% higher throughput | Deeper proteomic coverage; richer data from limited sample | Protein quantification; allergen detection |
| timsMetabo with TIMS [21] | Adds ion mobility separation (CCS value) | Resolves isomers/isobars; reduces background noise | Metabolomics; lipidomics; flavor profiling |
| GC-MS with ML Integration [9] | Machine learning models for aroma prediction | Decodes complex volatile relationships; predicts sensory outcomes | Food aroma and quality control |
Application Notes in Food Analysis
The following applications demonstrate the practical implementation of MS techniques to solve real-world challenges in food science.
Application Note AN-001: Determination of Fatty Acids in Special Formula Milk Powder using GC-MS
- Objective: To establish a rapid, accurate, and cost-effective GC-MS method for profiling fatty acids in complex food matrices like special formula milk powder [22].
- Background: Foods for Special Medical Purposes (FSMPs) require rigorous quality control. Existing standard methods for fatty acid detection can be time-consuming and costly, creating a need for optimized protocols.
- Experimental Protocol: The detailed methodology is provided in Section 4.1.
- Results and Discussion: The developed method demonstrated excellent performance metrics [22]:
- Linearity: Correlation coefficients ranged from 0.9959 to 0.9997.
- Precision: Relative Standard Deviation (RSD) for precision was between 0.41% and 3.36%.
- Accuracy: The spiked recovery rate was 90.03%–107.76%, confirming high accuracy. Compared to the Chinese national standard GB 5009.168–2016, this method reduced the analysis time by 0.5 hours and was more cost-effective. It also provided a more comprehensive and subdivided fatty acid profile than the international standard AOAC 996.06 [22].
Application Note AN-002: Multi-component Sterol Analysis in Pre-prepared Dishes using GC-MS
- Objective: To develop a sensitive and selective GC-MS method for the simultaneous qualification and quantification of multiple sterols in pre-prepared dishes, which have complex matrices of fats, proteins, and seasonings [23].
- Background: Sterols are key functional components that affect the nutritional value of food. Their detection is hampered by matrix interference, making robust sample preparation critical.
- Experimental Protocol: The detailed methodology is provided in Section 4.2.
- Results and Discussion: The method was successfully validated and applied to real samples [23]:
- The method showed good linearity (correlation coefficients ≥0.99) across a concentration range of 1.0–100.0 μg/mL.
- It exhibited high sensitivity, with Limits of Detection (LODs) and Quantification (LOQs) of 0.05–5.0 mg/100 g and 0.165–16.5 mg/100 g, respectively.
- The average recovery rates were 87.0% to 106% with RSDs of 0.99–9.00%, proving its reliability for complex matrices. Application to actual pre-prepared dishes revealed significant variations in sterol content, dominated by meat ingredients, and successfully identified β-sitosterol, campesterol, and stigmasterol as major components [23].
Application Note AN-003: HPLC-MS/MS Analysis of PFAS in Food
- Objective: To detect and quantify Per- and Polyfluoroalkyl Substances (PFAS) in food and food packaging at parts-per-trillion (ppt) levels using advanced HPLC-MS/MS [8].
- Background: PFAS are persistent environmental contaminants that can migrate into food from packaging. Their analysis is challenging due to low regulatory limits and complex sample matrices.
- Key Technological Features:
- HPLC Advancements: Use of core-shell and monolithic columns for improved separation efficiency and faster analysis.
- Detection: Coupling with tandem mass spectrometry (LC-MS/MS) is essential for achieving the required sensitivity and specificity at ppt levels, as mandated by the U.S. EPA Method 1633 [8].
- Sample Preparation: Techniques like Solid-Phase Extraction (SPE) and QuEChERS are refined to improve recovery rates and reduce matrix effects.
- Regulatory Context: This application supports compliance with stringent regulations, such as the U.S. EPA's Maximum Contaminant Levels of 4 ppt for PFOA and PFOS in drinking water [8].
Detailed Experimental Protocols
Protocol P-001: GC-MS Analysis of Fatty Acids in Milk Powder
The following workflow details the sample preparation and analysis for determining fatty acids:
Materials and Reagents:
- Special formula milk powder sample
- n-Hexane (HPLC grade)
- Sodium methoxide solution in methanol
- Internal standard solution (e.g., C13-labeled fatty acid)
- Ultrapure water
Procedure:
- Lipid Extraction: Accurately weigh ~1 g of milk powder. Perform ultrasound-assisted lipid extraction in a solution state using n-hexane.
- Derivatization: Transfer the extracted lipids to a reaction vial. Add a defined volume of sodium methoxide in methanol solution to convert (methyl esterify) the fatty acids to their corresponding Fatty Acid Methyl Esters (FAMEs).
- GC-MS Analysis: Inject the derivatized sample into the GC-MS system under the following conditions [22]:
- Injection Mode: Split (10:1 ratio).
- Column: Appropriate fused-silica capillary column (e.g., DB-5MS).
- Temperature Program: A defined gradient from a low initial hold temperature (e.g., 60°C) to a high final temperature (e.g., 300°C).
- Ionization: Electron Impact (EI) at 70 eV.
- Quantification: Identify fatty acids by comparing retention times and mass spectra to certified standards. Quantify using the internal standard method, constructing a calibration curve for each target fatty acid.
Protocol P-002: Sterol Determination in Pre-prepared Dishes
The multi-step sample preparation for sterol analysis is critical for dealing with complex matrices:
Materials and Reagents:
- Homogenized pre-prepared dish sample
- Methanolic KOH solution (for saponification)
- n-Hexane (HPLC grade)
- Derivatization reagent (e.g., BSTFA + TMCS)
- Internal standard (e.g., 5α-cholestane)
- Ultrapure water
Procedure:
- Saponification: Weigh a homogenized sample (~2 g) into a flask. Add methanolic KOH and heat to hydrolyze (saponify) triglycerides and release free sterols.
- Extraction: After cooling, add ultrapure water to assist dispersion. Extract the free sterols with n-hexane. Combine the organic layers.
- Concentration: Evaporate the n-hexane extract to dryness under a gentle stream of nitrogen gas.
- Derivatization: Reconstitute the dry residue in a derivatization reagent (e.g., BSTFA) to convert sterols into more volatile trimethylsilyl (TMS) ether derivatives for improved GC separation and sensitivity [23].
- GC-MS Analysis: Inject the derivatized sample.
- Column: High-resolution capillary column (e.g., DB-5MS).
- Temperature Program: Use a optimized gradient to resolve sterol isomers (e.g., β-sitosterol, campesterol, stigmasterol).
- Detection: Operate MS in Selected Ion Monitoring (SIM) mode for higher sensitivity or full scan mode for untargeted profiling.
- Quantification: Quantify using the internal standard method, with calibration curves for each sterol.
The Scientist's Toolkit: Essential Research Reagent Solutions
Table 2: Key Reagents and Materials for MS-Based Food Analysis
| Item Name | Function/Benefit | Example Application |
|---|---|---|
| Sodium Methoxide in Methanol | Catalyst for transesterification of fatty acids to volatile FAMEs. | Fatty acid analysis in milk powder and oils [22]. |
| Saponification Reagent (e.g., Methanolic KOH) | Hydrolyzes triglycerides to release free sterols for analysis. | Sample prep for sterol determination in complex foods [23]. |
| Derivatization Reagents (e.g., BSTFA) | Increases volatility and thermal stability of polar compounds (e.g., sterols) for GC-MS. | Analysis of sterols, sugars, and other non-volatile analytes [23]. |
| Solid-Phase Extraction (SPE) Cartridges | Clean-up and pre-concentration of analytes; reduces matrix effects. | PFAS analysis in complex food matrices [8]. |
| QuEChERS Kits | Quick, Easy, Cheap, Effective, Rugged, Safe; multi-residue extraction. | Pesticide and contaminant analysis in fruits and vegetables. |
| Stable Isotope-Labeled Internal Standards | Corrects for analyte loss during preparation and ion suppression/enhancement during MS. | Essential for accurate quantification in LC-MS/MS and GC-MS [22] [23]. |
| QSee QC Suite & Reference Materials | Automated performance monitoring and long-term system stability for high-quality metabolomics data [21]. | Ensuring data quality and reproducibility in untargeted LC-MS studies. |
The selection of an appropriate detector is a critical step in the development of any chromatographic method, particularly in the field of food analysis where the accurate quantification of diverse components—from nutrients and bioactive compounds to contaminants and adulterants—is essential. Detectors convert the physical or chemical characteristics of analytes separated by High-Performance Liquid Chromatography (HPLC) or Gas Chromatography (GC) into measurable signals, defining the sensitivity, selectivity, and overall applicability of the method. This application note provides a detailed overview of four fundamental detectors—UV-Vis, Fluorescence (FLD), Flame Ionization (FID), and Mass Spectrometry (MS)—within the context of a thesis researching HPLC and GC-MS methods for food components. It includes performance comparisons, detailed experimental protocols from recent food safety research, and essential workflows to guide researchers and scientists in method selection and implementation.
Detector Fundamentals and Performance Comparison
Operational Principles
UV-Vis Detectors operate on the principle of the Beer-Lambert law, where analytes absorbing ultraviolet or visible radiation (typically 200-400 nm) in a flow cell cause a reduction in the transmitted light intensity, which is measured by a photodiode [24]. Modern variable wavelength detectors use a diffraction grating to select a specific wavelength, while diode array detectors (DAD) pass white light through the flow cell first, then disperse it onto an array of photodiodes to capture full spectra simultaneously, enabling peak purity assessment and library matching [24].
Fluorescence Detectors (FLD) offer higher specificity and sensitivity than UV-Vis by measuring the light emitted by analytes after they have been excited by a specific wavelength of light. This two-wavelength measurement (excitation and emission) significantly reduces background noise, making FLD ideal for trace analysis of native fluorescent compounds or those that can be derivatized to become fluorescent [25] [26].
Flame Ionization Detectors (FID) are nearly universal for GC. Analytes eluting from the column are combusted in a hydrogen/air flame, generating ions and free electrons from hydrocarbon backbones. An electrode collects these charged particles, generating a current proportional to the number of carbon atoms entering the flame [27]. FID is highly sensitive to most organic compounds but exhibits limited response to inorganic species, water, and permanent gases [27].
Mass Spectrometry Detectors (MS) provide unparalleled selectivity by separating and detecting ions based on their mass-to-charge ratio (m/z). MS can be coupled with either LC or GC (as LC-MS or GC-MS). It functions by ionizing analyte molecules, separating the resulting ions in a mass analyzer (e.g., Quadrupole, Time-of-Flight), and detecting them. MS detectors provide structural information, enable identification of unknown compounds through library matching, and are capable of extremely high sensitivity, especially in selected reaction monitoring (SRM) mode on tandem MS systems [28] [29].
Comparative Performance Metrics
The following table summarizes the key characteristics and food analysis applications of these detectors for easy comparison.
Table 1: Comparative Overview of Common Chromatographic Detectors
| Detector | Principle of Detection | Selectivity | Typical Sensitivity | Linear Dynamic Range | Example Food Applications |
|---|---|---|---|---|---|
| UV-Vis (DAD) | Absorption of UV/Vis light [24] | Selective for chromophores | Moderate (ng) | ~10³ | Vitamins, mycotoxins, food colorants, polyphenols [24] |
| Fluorescence (FLD) | Emission of light after excitation [25] | Highly selective for fluorophores | High (pg-fg) | ~10⁴ | Aflatoxins, Ochratoxin A [25], Bisphenol A [26], Polycyclic Aromatic Hydrocarbons |
| Flame Ionization (FID) | Combustion in H₂/air flame [27] | Universal for organic C-H bonds | High (pg) | ~10⁷ | Fatty acids, residual solvents, hydrocarbons, sugars (after derivatization) [27] |
| Mass Spectrometry (MS) | Mass-to-charge ratio (m/z) of ions | Highly Selective and Universal | Very High (fg-ag) | ~10⁵ | Pesticide residues, mycotoxins, drug residues, metabolomics, flavor compounds [28] [29] |
Application-Oriented Experimental Protocols
Protocol 1: HPLC-FLD for Determination of Ochratoxin A in Mouse Tissues
This validated protocol for monitoring mycotoxin exposure in neurodegeneration research demonstrates the high sensitivity of FLD [25].
3.1.1 Research Reagent Solutions
Table 2: Essential Reagents and Materials for OTA Analysis
| Item | Function / Specification |
|---|---|
| Ochratoxin A (OTA) Certified Standard | Primary analyte for calibration and quantification. |
| HPLC-Grade Acetonitrile and Methanol | Mobile phase components and extraction solvents. |
| Formic Acid or Acetic Acid | Mobile phase additive to improve chromatographic peak shape. |
| Ultrapure Water (Type I) | Aqueous component of the mobile phase. |
| Solid Phase Extraction (SPE) Cartridges | Clean-up and pre-concentration of samples (e.g., C18 or IAC). |
| Homogenizer (e.g., Polytron) | For homogenizing tissue samples (kidney, liver, brain, intestine). |
3.1.2 Method Conditions and Validation Data
Table 3: Validated HPLC-FLD Method Parameters for OTA [25]
| Parameter | Specification |
|---|---|
| Sample Types | Mouse plasma, kidney, liver, brain, intestine |
| LLOQ (Plasma) | 2.35 ng/mL |
| LLOQ (Tissues) | 9.4 ng/g |
| Linear Range | 2.35–22.83 ng/mL and 22.83–228.33 ng/mL |
| Accuracy (Recovery) | 74.8% (Plasma) to 87.6% (Kidney) |
| Precision (CV%) | < 12% for all matrices |
| Chromatographic Column | C18 column (e.g., 150 x 4.6 mm, 5 µm) |
| Mobile Phase | Aqueous acid (e.g., formic acid) and Acetonitrile (gradient) |
| FLD Detection | Ex: λex ~ 330 nm, λem ~ 460 nm |
3.1.3 Detailed Workflow
- Sample Homogenization: Precisely weigh tissue samples (~100 mg) and homogenize with a suitable volume of acidified aqueous acetonitrile (e.g., 50% ACN, 1% acetic acid).
- Extraction and Clean-up: Centrifuge the homogenate, collect the supernatant, and further purify using an immunoaffinity or reversed-phase SPE column to remove interfering matrix components.
- Evaporation and Reconstitution: Evaporate the eluted solvent to dryness under a gentle stream of nitrogen. Reconstitute the dry residue in a small volume of the HPLC starting mobile phase (e.g., 100-200 µL) to pre-concentrate the analyte.
- HPLC-FLD Analysis: Inject the reconstituted sample onto the HPLC system. Employ a gradient elution to separate OTA from any remaining co-extractives. Quantify OTA by comparing the peak area to a calibration curve of pure standards using fluorescence detection.
Protocol 2: HPLC-FLD for Determination of Bisphenol A in Canned Vegetables
This protocol highlights the application of FLD for monitoring migrant contaminants from food packaging [26].
3.2.1 Research Reagent Solutions
Table 4: Essential Reagents and Materials for BPA Analysis
| Item | Function / Specification |
|---|---|
| Bisphenol A (BPA) Certified Standard | Primary analyte for calibration. |
| HPLC-Grade Acetonitrile | Mobile phase component and solvent for standard preparation. |
| Ultrapure Water (Type I) | Aqueous component of the mobile phase. |
| Syringe Filters (0.22 µm or 0.45 µm, Nylon/PTFE) | For filtration of sample extracts prior to injection. |
| Canned Vegetable Samples | Food simulant or the liquid phase from canned goods. |
3.2.2 Method Conditions
- Chromatographic Column: C18 column (e.g., 250 x 4.6 mm, 5 µm).
- Mobile Phase: Gradient elution with water and acetonitrile.
- FLD Detection: Optimal excitation and emission wavelengths for BPA are typically λex = 230-275 nm and λem = 300-315 nm [26].
- Limit of Quantification (LOQ): 0.01 mg/kg, well below the specific migration limit of 0.05 mg/kg set by the EU [26].
3.2.3 Detailed Workflow
- Sample Collection: Drain the liquid phase from the canned vegetable sample into a clean beaker.
- Sample Preparation: Mix an aliquot of the liquid (e.g., 900 µL) with a small volume of organic solvent (e.g., 100 µL acetonitrile) to ensure compatibility with the HPLC mobile phase.
- Filtration: Pass the mixture through a 0.45 µm syringe filter directly into an HPLC vial.
- HPLC-FLD Analysis: Inject the filtered sample. BPA is quantified by external calibration. For confirmatory analysis, the same extract can be analyzed by LC-MS/MS [26].
Workflow and Technology Selection Diagrams
Detector Selection and Method Development Workflow
The following diagram outlines a logical decision-making process for selecting the most appropriate detector based on the analytical goal and the physicochemical properties of the target analyte.
Operational Principles of Key Detectors
The diagram below illustrates the fundamental components and operational processes of three core detectors.
The choice of detector is a foundational decision in chromatographic method development for food analysis. UV-Vis detectors offer a robust and cost-effective solution for compounds with chromophores, while fluorescence detection provides superior sensitivity and selectivity for targeted analysis of fluorophores. FID remains a stalwart for universal, quantitative GC analysis of organic compounds. However, mass spectrometry stands out for its unmatched versatility, providing the selectivity needed for confirmatory analysis, identification of unknowns, and sensitive quantification of trace-level contaminants in complex food matrices. As food safety and quality demands intensify, the trend is moving towards hyphenated techniques like LC-MS and GC-MS, with ongoing developments in instrumentation—such as miniaturization, improved ionization sources, and AI-driven data analysis—further enhancing their speed, sensitivity, and accessibility [30] [31]. By understanding the principles, capabilities, and applications of these key detectors, researchers can effectively design and implement analytical strategies to address the complex challenges in modern food science.
Chromatographic methods, primarily High-Performance Liquid Chromatography (HPLC) and Gas Chromatography-Mass Spectrometry (GC-MS), are cornerstone techniques for separating, identifying, and quantifying components in complex food matrices [32]. The journey from a raw food sample to an interpretable chromatogram is a multi-stage process where each step is critical for ensuring the accuracy, reliability, and reproducibility of the final analytical results. This workflow encompasses sample collection, preparation, instrumental analysis, and data interpretation, with the overarching goals of ensuring food safety, verifying quality, and complying with regulations [33] [7]. This application note details a standardized protocol for this entire workflow, contextualized within modern advancements in automation and sustainability for food research and development [34] [35].
Experimental Protocols
Sample Collection and Storage
The integrity of the entire analytical process hinges on proper initial sample handling [32].
Protocol for Solid Foods (e.g., vegetables, grains):
- Collection: Obtain a representative portion from the bulk sample. For heterogeneous materials (e.g., entire apples), multiple sub-samples from different locations should be taken and combined.
- Homogenization: Process the sample using a laboratory blender or grinder to create a consistent and homogeneous mixture.
- Storage: Immediately freeze the homogenized sample at -20 °C or below to inhibit microbial growth and chemical degradation. Store in an inert, airtight container to prevent moisture loss or absorption.
Protocol for Liquid Foods (e.g., juice, milk):
- Collection: Ensure the sample is well-mixed before aliquoting to prevent sedimentation.
- Storage: Refrigerate at 4 °C for short-term storage (hours to a few days). For long-term stability, freeze at -20 °C. Preservatives may be added depending on the analytes of interest.
Sample Preparation and Extraction
This is often the most critical and variable step, aimed at isolating target analytes from the complex food matrix while minimizing interferences [33].
Protocol 1: QuEChERS (Quick, Easy, Cheap, Effective, Rugged, and Safe) for Multi-Pesticide Residues
- Principle: This method combines extraction and clean-up into a streamlined process, ideal for non-polar to semi-polar analytes in a variety of food matrices [33] [36].
- Procedure:
- Weigh 10 ± 0.1 g of homogenized sample into a 50 mL centrifuge tube.
- Add 10 mL of acetonitrile and vortex vigorously for 1 minute.
- Add a pre-packaged salt mixture (typically containing MgSO₄ to remove water and NaOAc as a buffer) and shake immediately and vigorously for 1 minute.
- Centrifuge at >4000 RCF for 5 minutes.
- Transfer an aliquot of the upper acetonitrile layer to a dispersive Solid-Phase Extraction (dSPE) tube containing clean-up sorbents (e.g., PSA to remove organic acids, GCB for pigments, and MgSO₄).
- Vortex and centrifuge. The final supernatant is ready for analysis by GC-MS or LC-MS [33].
Protocol 2: Supported Liquid Extraction (SLE) for Aqueous Matrices
- Principle: A modern alternative to Liquid-Liquid Extraction (LLE), SLE offers high selectivity and eliminates emulsion formation, making it suitable for beverages, juices, and other aqueous samples [33].
- Procedure:
- Dilute the aqueous sample, if necessary, and adjust the pH.
- Load the sample onto the SLE cartridge or plate and allow it to absorb into the diatomaceous earth for 5-10 minutes.
- Elute the target analytes with a water-immiscible organic solvent (e.g., ethyl acetate or dichloromethane) by gravity or low-pressure vacuum.
- Collect the eluent, which can often be directly injected or concentrated for analysis [33].
Protocol 3: Solid-Phase Extraction (SPE) for Selective Clean-up
- Principle: SPE provides highly customizable and selective clean-up by leveraging specific interactions between analytes, the matrix, and a functionalized sorbent [33] [37].
- General Procedure:
- Conditioning: Pass 2-3 column volumes of a strong solvent (e.g., methanol) through the SPE sorbent, followed by 2-3 volumes of a weak solvent (e.g., water or buffer) without letting the bed dry out.
- Loading: Apply the prepared sample extract to the cartridge at a controlled, slow flow rate (<5 mL/min).
- Washing: Pass 2-3 column volumes of a weak wash solvent to remove weakly retained matrix interferences.
- Elution: Elute the tightly bound analytes with a strong solvent (e.g., methanol or acetonitrile, often acidified or basified). This fraction is collected for analysis [33].
Chromatographic Analysis
The choice of chromatographic technique depends on the volatility, stability, and polarity of the target analytes.
HPLC Method for Vitamins in Fortified Foods [37]
- Column: C18 reversed-phase (e.g., Aqua column, 250 mm × 4.6 mm, 5 µm).
- Mobile Phase: Isocratic elution with 70% NaH₂PO₄ buffer (pH 4.95) and 30% methanol.
- Flow Rate: 0.9 mL/min.
- Column Temperature: 40 °C.
- Detection: Diode Array Detector (DAD) for Riboflavin (B2) and Pyridoxine (B6). For Thiamine (B1), a Fluorescence Detector (FLD) is used after a pre-column oxidation step to convert it into a fluorescent thiochrome derivative.
- Injection Volume: 10-20 µL.
GC-MS Method for Pesticides or Flavors [7] [38]
- Column: A standard (e.g., 30 m × 0.25 mm × 0.25 µm) or a fast (e.g., 10 m × 0.53 mm × 1 µm) "5% phenyl" polysiloxane column.
- Carrier Gas: Helium or Hydrogen, with constant flow or pressure.
- Injection: Pulsed Splitless or PTV injection at 250-280 °C.
- Oven Program: Temperature ramp from a low initial hold (e.g., 60 °C) to a high final temperature (e.g., 300 °C) at a defined rate.
- Mass Spectrometer: Operated in Electron Ionization (EI) mode at 70 eV.
- Acquisition Mode: Full scan (for untargeted analysis) or Selected Ion Monitoring (SIM) / Multiple Reaction Monitoring (MRM) for targeted, high-sensitivity quantification [7].
Data Analysis and Interpretation
The final stage involves translating the chromatogram into meaningful qualitative and quantitative information.
- Peak Identification: Analytes are primarily identified by comparing their retention time to that of an authentic standard analyzed under identical conditions. In GC-MS and LC-MS, the mass spectrum provides a definitive identifier by matching against a reference spectral library [7] [32].
- Peak Integration: The chromatographic software calculates the area or height of each peak.
- Quantification: The peak area of the analyte is compared to a calibration curve constructed from standard solutions of known concentration. Results are reported in appropriate units (e.g., mg/kg, µg/L, ppb).
Results and Data Presentation
Performance Metrics of Analytical Methods
The following table summarizes the typical validation parameters for robust chromatographic methods in food analysis, as demonstrated in recent applications.
Table 1: Quantitative Performance Data from Validated Food Analysis Methods
| Method Description | Analytes | Linearity (R²) | Precision (% RSD) | Accuracy (% Recovery) | LOD/LOQ | Citation |
|---|---|---|---|---|---|---|
| HPLC-DAD/FLD for vitamins in gummies & fluids | B1, B2, B6 Vitamins | > 0.999 | < 3.23% | 100 ± 3% | Not specified | [37] |
| GC-MS for cooling agents in aerosols | Menthol, WS-3, WS-23 | ≥ 0.9994 | 1.40% - 4.15% | 91.32% - 113.25% | LOD: 0.137 ng/mL - 0.114 µg/mL | [38] |
| HPLC-UV for Carvedilol & impurities | Carvedilol, Impurity C, N-formyl | > 0.999 | < 2.0% | 96.5% - 101% | Not specified | [39] |
The Scientist's Toolkit: Essential Research Reagents and Materials
A successful analysis requires careful selection of reagents and materials tailored to the sample and analytical goals.
Table 2: Key Research Reagent Solutions for Food Analysis Workflows
| Item | Function/Description | Application Example |
|---|---|---|
| QuEChERS Kits | Pre-packaged salts and dSPE sorbents for streamlined extraction and clean-up. | Multi-residue pesticide analysis in fruits and vegetables [33]. |
| SPE Sorbents (C18, PSA, GCB) | Selectively retain analytes or remove interferences based on polarity, acidity, or molecular shape. | C18 for general clean-up; PSA for removing sugars and acids; GCB for planar pigments [33]. |
| HPLC-Grade Solvents | High-purity solvents (Acetonitrile, Methanol, Water) with minimal UV absorbance and contaminants. | Mobile phase preparation for HPLC to ensure low background noise and stable baselines [39]. |
| Buffers (e.g., Phosphate) | Control pH of the mobile phase to improve peak shape and separation reproducibility. | Separation of ionizable compounds like carvedilol [39] and B-vitamins [37]. |
| Certified Reference Standards | Analytes of known purity and concentration for method development, calibration, and validation. | Essential for accurate peak identification and quantification in both HPLC and GC-MS. |
Workflow Visualization
The following diagram illustrates the complete, integrated workflow for chromatographic food analysis, highlighting critical decision points and the two primary technique paths (HPLC and GC-MS).
Food Analysis Workflow from Sample to Data
Discussion
Advancements in Method Development and Sustainability
The field of food analysis is rapidly evolving with the integration of Artificial Intelligence (AI) and Machine Learning (ML). These tools are now being applied to manage the complex, interdependent parameters of chromatographic method development, significantly accelerating the optimization process, especially for demanding techniques like two-dimensional LC (2D-LC) [34]. Furthermore, there is a strong paradigm shift towards Green Analytical Chemistry (GAC) and Circular Analytical Chemistry (CAC). This involves adapting traditional methods to reduce environmental impact by minimizing solvent and energy consumption, for example, by using automated, miniaturized, and parallel processing techniques [35]. Automation is a key enabler here, not only reducing labor and human error but also aligning with GSP principles by improving throughput and consistency while often reducing reagent consumption [36].
Troubleshooting Common Workflow Challenges
- Poor Recovery in SPE: If analytes are not adequately recovered, systematically check where the analyte is being lost. If it elutes during loading, the sorbent or sample solvent may be incorrect. If it appears in the wash fractions, the wash solvent is too strong. If it is not eluted, a stronger elution solvent is needed [33].
- Matrix Effects in LC-MS/MS: Ion suppression or enhancement is a common issue, particularly in complex food matrices. Using stable isotope-labeled internal standards is the most effective way to compensate for these effects. Efficient sample clean-up (e.g., with SPE or dSPE) and chromatographic separation also help mitigate this problem [33].
- Co-elution in GC-MS: In complex food profiles, peak overlap is frequent. Beyond optimizing the GC temperature program, leveraging the mass spectrometer's capabilities is crucial. Techniques like extracted ion chromatograms, mass spectral deconvolution, or using a high-resolution mass spectrometer can resolve co-eluting peaks based on their unique mass fragments [7].
Targeted Applications: Implementing HPLC and GC-MS Methods in Food Matrices
High-Performance Liquid Chromatography (HPLC) represents a fundamental analytical technique that has revolutionized the analysis of non-volatile compounds in complex food matrices [40]. Its versatility in separating, identifying, and quantifying analytes has made it indispensable for assessing nutritional quality and ensuring food safety [13]. Within food and feed laboratories, HPLC serves as a cornerstone technology for implementing regulatory thresholds that establish acceptable levels for individual chemical additives, residues, and contaminants [13]. The technique's principle relies on the differential partition of analytes between a stationary phase and a liquid mobile phase under high pressure, enabling the resolution of complex mixtures into their individual components [40].
This application note details specific HPLC methodologies for four critical classes of non-volatile food components: mycotoxins, vitamins, food additives, and lipids. Each analyte category presents unique analytical challenges that require specialized approaches in sample preparation, chromatographic separation, and detection. The protocols described herein are designed to provide researchers, scientists, and drug development professionals with robust analytical procedures that can be implemented for routine analysis, method development, and research applications within the broader context of food component analysis.
Analytical Targets and Challenges
Target Compounds in Food Analysis
Mycotoxins are toxic secondary metabolites produced by filamentous fungi such as Aspergillus, Fusarium, and Penicillium, including aflatoxins (AFs), ochratoxin A (OTA), fumonisins, and zearalenone (ZEA) [41]. They are considered one of the most dangerous agricultural and food contaminants due to their toxicity and stability, with regulations specifying strict limits in foodstuffs [41]. Approximately 500 mycotoxins are currently known, contaminating nearly 40% of globally produced cereals [41].
Vitamins are complex unrelated compounds present in minute amounts in natural foodstuffs, essential to normal metabolism [13]. They are classified based on solubility characteristics as either lipid-soluble (A, D, E, K) or water-soluble (B-vitamins and C) [42]. Each vitamin can have multiple biologically active forms called vitamers that differ in potency, stability, and chemical structure [42].
Food Additives include compounds such as acidulants, antioxidants, preservatives, and sweeteners that are intentionally added to foods to serve specific technological functions [13]. These compounds must be monitored to ensure compliance with regulatory limits and to verify labeling accuracy.
Lipids serve as major constituents of foods and feeds, providing essential fat-soluble nutrients and serving as a significant source of dietary energy [13]. The primary lipid classes include glycerolipids, glycerophospholipids, and sterol lipids, each comprising numerous molecular species with variations in acyl chain length, double bonds, and regiospecificity [43].
Analytical Challenges
The analysis of these diverse compound classes presents several shared and unique challenges. Mycotoxins often exist at trace levels in complex food matrices, requiring sensitive detection methods and extensive sample clean-up [41]. Vitamins encompass a wide range of chemical structures with differing stability, necessitating careful control of extraction and analysis conditions to prevent degradation [42]. Food additives must be monitored amidst potentially interfering compounds from the food matrix, requiring selective detection methods. Lipids present challenges due to the presence of numerous isomers and isobars, demanding high-resolution separations or specific detection strategies [43].
HPLC Instrumentation and Method Development
Modern HPLC Systems
Contemporary HPLC instrumentation has evolved to provide superior separation efficiency and analytical precision [40]. Key components include:
Solvent Delivery System: Binary and quaternary gradient systems enable sophisticated mobile phase compositions, essential for complex separations [40]. Modern ultra-high-pressure pumps can operate above 15,000 psi, facilitating the use of smaller particle size columns and faster separations [40].
Sample Introduction: Advanced autosamplers offer high-precision injection volumes ranging from sub-microliter to milliliter quantities, with temperature-controlled sample storage and automated sample preparation capabilities [40].
Column Technology: The introduction of sub-2-μm particles has revolutionized separation efficiency and speed [40]. Core-shell particles, combining a solid core with a porous outer layer, offer reduced diffusion paths and improved mass transfer characteristics [40]. Monolithic columns provide high permeability and efficiency, particularly suitable for biological samples [40].
Detection Systems: The coupling of HPLC with various detection systems has significantly enhanced its analytical capabilities [40]. While UV-visible spectrophotometry remains widely used, mass spectrometry has emerged as a powerful complementary technique, providing structural information and improved selectivity in complex sample analysis [40].
Table 1: HPLC Detection Systems for Non-Volatile Food Components
| Detection Type | Detection Limit | Key Features | Primary Applications |
|---|---|---|---|
| UV-DAD | ng-μg/mL | Multi-wavelength detection, Spectral analysis | General analysis, Purity assessment |
| Fluorescence | pg-ng/mL | High sensitivity, Selectivity | Trace analysis, Biological compounds |
| Mass Spectrometry | fg-pg/mL | Structural information, High selectivity | Complex mixture analysis, Unknown identification |
| CAD/ELSD | ng-μg/mL | Universal detection, Non-volatile compounds | Lipids, Polymers, Carbohydrates |
| Electrochemical | pg-ng/mL | High sensitivity for electroactive compounds | Neurotransmitters, Oxidizable compounds |
Method Development and Optimization
Method development in HPLC requires careful consideration of multiple parameters to achieve optimal separation [40]. A systematic approach should include:
Mobile Phase Selection: The choice between reversed-phase, normal-phase, or hydrophilic interaction chromatography depends on analyte properties and separation requirements [40]. Buffer selection, pH control, and organic modifier ratios play crucial roles in achieving reproducible separations.
Stationary Phase Considerations: Selection of appropriate stationary phases requires understanding molecular interactions between analytes and column chemistry [40]. Modified silica phases (C18, C8, phenyl) offer different selectivity patterns for various compound classes.
Temperature Effects: Column temperature control represents a critical parameter in method development [40]. Elevated temperatures can reduce mobile phase viscosity, allowing faster flow rates and improved mass transfer.
Gradient Optimization: Proper design of gradient elution profiles is essential for resolving complex mixtures of non-volatile compounds with varying polarities.
Diagram 1: HPLC method development workflow for non-volatile compounds
Application-Specific Protocols
Mycotoxin Analysis by HPLC-FLD and LC-MS/MS
Principle: Mycotoxins are toxic secondary metabolites produced by fungi that contaminate various agricultural products [41]. This protocol describes the determination of aflatoxins (B1, B2, G1, G2) and ochratoxin A in cereal samples using HPLC with fluorescence detection (FLD) with post-column derivatization.
Sample Preparation:
- Extraction: Weigh 25 g of homogenized sample into a blender jar. Add 5 g sodium chloride and 100 mL methanol:water (70:30, v/v). Blend at high speed for 3 minutes.
- Filtration: Filter the extract through Whatman No. 4 filter paper.
- Clean-up: Pass 10 mL filtrate through an immunoaffinity column containing antibodies specific to the target mycotoxins at a flow rate of 1-2 mL/min.
- Elution: Wash column with 10 mL water at 5 mL/min. Elute mycotoxins with 1.5 mL methanol at a flow rate of 1 mL/min. Collect eluate in a glass vial.
- Evaporation: Evaporate eluate to dryness under gentle nitrogen stream at 60°C. Reconstitute in 500 μL mobile phase for analysis.
HPLC Conditions:
- Column: C18, 150 × 4.6 mm, 5 μm
- Mobile Phase: Water:methanol:acetonitrile (57:29:14, v/v/v) with 119 mg potassium bromide and 350 μL 4M nitric acid per liter
- Flow Rate: 1.0 mL/min
- Injection Volume: 50 μL
- Temperature: 30°C
- Detection: FLD for aflatoxins B1 and G1: λex = 365 nm, λem = 435 nm; for aflatoxins B2 and G2: λex = 365 nm, λem = 435 nm; for ochratoxin A: λex = 333 nm, λem = 460 nm
- Post-column Derivatization: Electrochemically generated bromine using Kobra Cell
Table 2: HPLC-FLD Method Performance for Mycotoxin Analysis
| Mycotoxin | LOD (μg/kg) | LOQ (μg/kg) | Recovery (%) | Linearity Range (μg/kg) | RSD (%) |
|---|---|---|---|---|---|
| Aflatoxin B1 | 0.05 | 0.15 | 88-95 | 0.15-20 | 3-8 |
| Aflatoxin B2 | 0.02 | 0.06 | 85-92 | 0.06-20 | 4-9 |
| Aflatoxin G1 | 0.05 | 0.15 | 86-94 | 0.15-20 | 3-7 |
| Aflatoxin G2 | 0.02 | 0.06 | 84-91 | 0.06-20 | 4-8 |
| Ochratoxin A | 0.10 | 0.30 | 82-90 | 0.30-50 | 5-10 |
LC-MS/MS Protocol for Multi-Mycotoxin Analysis: For comprehensive analysis of multiple mycotoxin classes, LC-MS/MS provides superior sensitivity and selectivity [44].
Sample Preparation:
- Extraction: Weigh 5 g homogenized sample into a 50 mL centrifuge tube. Add 20 mL acetonitrile:water:acetic acid (79:20:1, v/v/v).
- Shaking: Shake vigorously for 60 minutes on a horizontal shaker.
- Centrifugation: Centrifuge at 4000 × g for 10 minutes.
- Dilution: Transfer 1 mL supernatant to a clean tube and dilute with 1 mL water.
- Filtration: Filter through 0.22 μm PVDF filter prior to LC-MS/MS analysis.
LC-MS/MS Conditions:
- Column: C18, 100 × 2.1 mm, 1.7 μm
- Mobile Phase A: Water with 5 mM ammonium acetate
- Mobile Phase B: Methanol with 5 mM ammonium acetate
- Gradient: 5% B to 100% B over 15 min, hold 3 min
- Flow Rate: 0.3 mL/min
- Temperature: 40°C
- Injection Volume: 5 μL
- Ionization: ESI positive/negative switching
- Detection: MRM mode
Vitamin Analysis by HPLC-UV/DAD
Principle: This method describes the simultaneous determination of fat-soluble vitamins (A, D, E, K) in fortified food products using HPLC with diode array detection (DAD). The protocol utilizes non-aqueous reversed-phase (NARP) chromatography for separating these hydrophobic compounds [42].
Sample Preparation:
- Saponification: Weigh 2 g sample into a screw-cap tube. Add 10 mL ethanol and 1 mL 50% potassium hydroxide solution. Heat at 80°C for 30 minutes with occasional shaking.
- Extraction: Cool under running water. Add 10 mL n-hexane and shake vigorously for 2 minutes. Add 10 mL water and shake for 30 seconds.
- Centrifugation: Centrifuge at 3000 × g for 5 minutes. Transfer hexane layer to a clean tube.
- Washing: Repeat extraction twice with 10 mL n-hexane. Combine hexane layers and wash with 20 mL water.
- Evaporation: Evaporate combined hexane extracts to dryness under nitrogen at 40°C.
- Reconstitution: Dissolve residue in 1 mL methanol:tetrahydrofuran (80:20, v/v). Filter through 0.45 μm PTFE filter.
HPLC Conditions:
- Column: C30, 250 × 4.6 mm, 5 μm
- Mobile Phase A: Methanol
- Mobile Phase B: Methyl tert-butyl ether (MTBE)
- Gradient: 0-20 min: 0-25% B; 20-25 min: 25-100% B; 25-30 min: 100% B
- Flow Rate: 1.0 mL/min
- Temperature: 25°C
- Injection Volume: 20 μL
- Detection: DAD with monitoring at 265 nm (vitamin D), 292 nm (vitamin E), 325 nm (vitamin A), 248 nm (vitamin K)
Table 3: Retention Times and Method Parameters for Fat-Soluble Vitamins
| Vitamin | Retention Time (min) | LOD (μg/g) | LOQ (μg/g) | Recovery (%) | Linear Range (μg/g) |
|---|---|---|---|---|---|
| Vitamin A (Retinol) | 12.5 | 0.02 | 0.05 | 92-98 | 0.05-50 |
| Vitamin D3 (Cholecalciferol) | 15.8 | 0.05 | 0.15 | 85-95 | 0.15-20 |
| Vitamin E (α-Tocopherol) | 19.2 | 0.10 | 0.30 | 90-102 | 0.30-100 |
| Vitamin K1 (Phylloquinone) | 22.4 | 0.03 | 0.10 | 88-96 | 0.10-25 |
Water-Soluble Vitamin Analysis: For B-complex vitamins and vitamin C, alternative approaches are required:
Sample Preparation for Water-Soluble Vitamins:
- Extraction: Weigh 2 g sample into a 50 mL centrifuge tube. Add 25 mL 0.1N hydrochloric acid containing 1% metaphosphoric acid.
- Homogenization: Homogenize using a probe homogenizer for 1 minute.
- Enzymatic Digestion: For bound vitamins, add 0.5 mL takadiastase solution (10% in water) and incubate at 37°C for 3 hours.
- Centrifugation: Centrifuge at 5000 × g for 10 minutes.
- Filtration: Filter supernatant through 0.45 μm nylon filter.
HPLC Conditions:
- Column: C18, 250 × 4.6 mm, 5 μm
- Mobile Phase A: 50 mM potassium phosphate buffer, pH 3.0
- Mobile Phase B: Acetonitrile
- Gradient: 0-15 min: 2-20% B; 15-20 min: 20-80% B
- Flow Rate: 1.0 mL/min
- Temperature: 30°C
- Detection: DAD with multiple wavelength monitoring
Food Additive Analysis by HPLC-UV
Principle: This protocol describes the simultaneous determination of synthetic antioxidants (BHA, BHT, TBHQ) and preservatives (benzoates, sorbates) in various food matrices using reversed-phase HPLC with UV detection.
Sample Preparation:
- Extraction: Weigh 2 g homogenized sample into a 50 mL centrifuge tube. For fatty foods, add 10 mL hexane, vortex for 2 minutes, and discard hexane layer.
- Add 10 mL acetonitrile, vortex for 2 minutes, and sonicate for 15 minutes.
- Clean-up: Add 2 g anhydrous sodium sulfate and 0.5 g C18 sorbent. Vortex for 1 minute.
- Centrifugation: Centrifuge at 5000 × g for 5 minutes.
- Filtration: Transfer supernatant and filter through 0.45 μm PTFE filter.
HPLC Conditions:
- Column: C18, 250 × 4.6 mm, 5 μm
- Mobile Phase A: Water with 0.1% acetic acid
- Mobile Phase B: Acetonitrile with 0.1% acetic acid
- Gradient: 0-10 min: 40-80% B; 10-12 min: 80-100% B; 12-15 min: 100% B
- Flow Rate: 1.2 mL/min
- Temperature: 35°C
- Injection Volume: 20 μL
- Detection: UV at 280 nm
Table 4: HPLC-UV Method Performance for Food Additives
| Additive | Retention Time (min) | LOD (mg/kg) | LOQ (mg/kg) | Recovery (%) | Regulatory Limit (mg/kg) |
|---|---|---|---|---|---|
| BHA | 6.8 | 0.1 | 0.3 | 85-95 | 200 |
| BHT | 9.2 | 0.2 | 0.5 | 82-90 | 100 |
| TBHQ | 7.5 | 0.1 | 0.3 | 88-96 | 200 |
| Potassium Sorbate | 4.3 | 0.5 | 1.5 | 90-102 | 1000-2000 |
| Sodium Benzoate | 5.1 | 0.5 | 1.5 | 92-105 | 1000-1500 |
Lipid Analysis by HPLC-ELSD/CAD
Principle: This method describes the separation and quantification of lipid classes including triacylglycerols (TAG), diacylglycerols (DAG), monoacylglycerols (MAG), and phospholipids using HPLC with evaporative light scattering detection (ELSD) or charged aerosol detection (CAD). These detection techniques provide universal response for non-volatile compounds without requiring chromophores [45].
Sample Preparation:
- Lipid Extraction: Weigh 1 g sample into a glass tube. Add 10 mL chloroform:methanol (2:1, v/v) and vortex for 2 minutes.
- Partitioning: Add 2 mL 0.9% sodium chloride solution, vortex for 1 minute, and centrifuge at 3000 × g for 10 minutes.
- Collection: Collect lower chloroform layer containing lipids.
- Re-extraction: Re-extract aqueous phase with 5 mL chloroform. Combine chloroform layers.
- Drying: Evaporate under nitrogen at 40°C. Reconstitute in 2 mL isopropanol:hexane (80:20, v/v). Filter through 0.45 μm PTFE filter.
HPLC Conditions for Neutral Lipids:
- Column: C18, 250 × 4.6 mm, 5 μm
- Mobile Phase A: Acetonitrile
- Mobile Phase B: Isopropanol:hexane (80:20, v/v)
- Gradient: 0-5 min: 100% A; 5-40 min: 0-100% B; 40-50 min: 100% B
- Flow Rate: 1.0 mL/min
- Temperature: 35°C
- Injection Volume: 10 μL
- Detection: ELSD with drift tube temperature: 50°C, nebulizer gas: 1.0 mL/min (nitrogen), gain: 3 [45]
HPLC Conditions for Phospholipids:
- Column: Silica, 250 × 4.6 mm, 5 μm
- Mobile Phase A: Chloroform:methanol:ammonium hydroxide (80:19.5:0.5, v/v/v)
- Mobile Phase B: Chloroform:methanol:water:ammonium hydroxide (60:34:5.5:0.5, v/v/v/v)
- Gradient: 0-20 min: 0-100% B; 20-25 min: 100% B
- Flow Rate: 1.0 mL/min
- Detection: ELSD with drift tube temperature: 45°C
Table 5: HPLC-ELSD Retention Times and Response Factors for Lipid Classes
| Lipid Class | Retention Time (min) | LOD (μg) | LOQ (μg) | Response Factor | Key Molecular Species |
|---|---|---|---|---|---|
| Cholesterol | 8.5 | 0.1 | 0.3 | 1.00 | - |
| DAG | 15.2 | 0.2 | 0.5 | 0.85 | 1,2-DAG; 1,3-DAG |
| MAG | 12.8 | 0.3 | 0.8 | 0.78 | 1-MAG; 2-MAG |
| TAG | 22-35 | 0.5 | 1.5 | 1.12 | Varies by acyl chains |
| PC | 18.5 | 0.2 | 0.6 | 0.95 | Phosphatidylcholine |
| PE | 20.3 | 0.3 | 0.8 | 0.88 | Phosphatidylethanolamine |
| PS | 23.7 | 0.4 | 1.0 | 0.82 | Phosphatidylserine |
Diagram 2: Sample preparation workflow for HPLC analysis of non-volatiles
The Scientist's Toolkit
Table 6: Essential Research Reagent Solutions for HPLC Analysis of Non-Volatiles
| Reagent/Material | Function | Application Examples | Notes |
|---|---|---|---|
| Immunoaffinity Columns | Selective clean-up of target analytes using antibody-antigen interactions | Mycotoxin extraction from cereals, nuts, dairy products | High specificity, single-use, various targets available |
| C18 Solid-Phase Extraction Cartridges | Reversed-phase extraction of medium to non-polar compounds | Lipid extraction, vitamin purification, additive isolation | Various sizes (1g, 500mg, 100mg), requires conditioning |
| Molecularly Imprinted Polymers (MIPs) | Synthetic polymer sorbents with specific recognition sites | Selective mycotoxin extraction, additive clean-up | Stable, high specificity, reduces matrix interference [41] |
| Derivatization Reagents | Chemical modification to enhance detection properties | FLD detection of aflatoxins, vitamin analysis | Improves sensitivity and selectivity for certain detectors |
| Matrix-Matched Standards | Calibration standards prepared in blank matrix | Quantification to compensate for matrix effects | Essential for accurate quantification in complex matrices |
| Stable Isotope-Labeled Internal Standards | Internal standards for mass spectrometry | LC-MS/MS analysis of mycotoxins, vitamins, additives | Compensates for extraction and ionization variability |
| Pressurized Liquid Extraction Cells | Automated extraction at elevated temperature and pressure | Lipid extraction from solid samples, mycotoxin extraction | Reduces solvent consumption and extraction time [46] |
HPLC remains an indispensable analytical technique for the determination of non-volatile compounds in food matrices, offering the versatility, sensitivity, and robustness required for modern food analysis. The protocols detailed in this application note provide researchers with validated methods for analyzing mycotoxins, vitamins, additives, and lipids across diverse food commodities. As analytical technology continues to evolve, trends in miniaturization, automation, and green chemistry principles are further enhancing the capabilities of HPLC in food analysis [40]. The integration of advanced detection systems, particularly mass spectrometry, continues to expand the application range of HPLC, enabling more comprehensive and accurate food safety and quality assessment.
Within the framework of advanced chromatographic methods for food analysis, Gas Chromatography-Mass Spectrometry (GC-MS) stands as a powerful technique for the separation and identification of volatile and semi-volatile organic compounds. Its high sensitivity and resolution make it particularly suited for profiling a wide range of analytes in complex food matrices, including pesticide residues, aroma compounds, and persistent environmental contaminants. This document provides detailed application notes and experimental protocols for utilizing GC-MS in these key areas, supporting rigorous food safety and quality research.
Sample Preparation Techniques
Proper sample preparation is critical for achieving accurate and reproducible results in GC-MS analysis. The following techniques are widely employed for food and environmental samples.
QuEChERS (Quick, Easy, Cheap, Effective, Rugged, and Safe)
QuEChERS is a high-throughput technique ideal for multi-residue analysis in complex matrices.
- Procedure: The method involves an acetonitrile extraction followed by a dispersive Solid-Phase Extraction (dSPE) cleanup step. During extraction, salts like magnesium sulfate (MgSO₄) are added to induce phase separation, and sodium chloride (NaCl) is used to control partitioning [47].
- Cleanup Sorbents: The choice of dSPE sorbent is matrix-dependent.
- Primary/Secondary Amine (PSA): Removes various polar interferences like organic acids and sugars [47].
- C18: Effective for removing non-polar interferences such as lipids [48] [47].
- Zirconium Dioxide (ZrO₂)-based sorbents: Demonstrate superior efficiency in removing phospholipids from fatty samples like fish, resulting in lower baselines and satisfactory recoveries (70-120%) for most analytes [48].
Solid-Phase Microextraction (SPME)
SPME is a solvent-free technique excellent for extracting volatile aroma compounds.
- Procedure: A fused silica fiber coated with a stationary phase is exposed to the sample headspace (HS-SPME) or immersed directly into the liquid sample. Analytes adsorb onto the fiber coating and are subsequently thermally desorbed in the GC injector for analysis [49].
Other Extraction Techniques
- Stir Bar Sorptive Extraction (SBSE): Utilizes a magnetic stir bar coated with a sorbent phase (e.g., polydimethylsiloxane). It offers higher sensitivity than SPME due to a larger volume of sorptive phase but requires longer extraction times [49].
- Accelerated Solvent Extraction (ASE): An automated technique that uses high temperature and pressure to rapidly extract analytes from solid and semi-solid samples with minimal solvent [49].
- Headspace Sampling: Ideal for volatile analytes in complex matrices (e.g., blood, plastics, high-water-content materials). It can be static (direct injection of vapor) or dynamic (purge and trap) [49].
Application Notes & Detailed Protocols
Analysis of Pesticides and Environmental Contaminants in Fish
This protocol outlines a multi-residue method for determining pesticides, PCBs, PBDEs, and PAHs in fish tissue [48].
Sample Preparation:
- Extraction: Homogenize the fish sample. A representative portion (e.g., 1-5 g) is weighed into a centrifuge tube. Add 15 mL of acetonitrile and shake vigorously for 1 minute [48] [47].
- Partitioning: Add 1 g of NaCl and 4 g of anhydrous MgSO₄, shake vigorously for 1 minute, and centrifuge to separate layers [47].
- Cleanup: Transfer an aliquot (e.g., 9 mL) of the acetonitrile supernatant to a dSPE tube containing a sorbent. For fatty fish, ZrO₂-based sorbents are recommended [48]. Shake and centrifuge the tube.
- Concentration: Transfer the cleaned extract to a vial. It may be evaporated under a gentle nitrogen stream and reconstituted in a solvent compatible with GC-MS analysis if necessary [47].
Instrumental Analysis - Fast GC-MS/MS:
- GC System: Use a fast GC system capable of low-pressure operation.
- Column: A suitable capillary GC column (e.g., 30 m x 0.25 mm id, 0.25 µm film thickness).
- Oven Program: A typical temperature program might start at 100°C, then ramp at 10°C/min to 250°C, with a hold time [50].
- MS Detection: Tandem Mass Spectrometry (MS-MS) in Multiple Reaction Monitoring (MRM) mode is used for high selectivity and sensitivity. The mass spectrometer should be tuned for optimal response in the target mass range [48].
Data Interpretation: Identify target analytes by comparing their retention times and MRM transitions to those of certified standards. Quantification is often performed using isotope-labeled internal standards to correct for matrix effects and losses during preparation [48].
Pesticide and PAH Screening in Honey
This method is adapted from a study screening for contaminants in European honeys [47].
Sample Preparation (Modified QuEChERS):
- Weigh 1.5 g of honey into a 50 mL centrifuge tube.
- Spike with appropriate internal standards and allow to equilibrate.
- Add 15 mL of acetonitrile and shake vigorously.
- Add 1 g NaCl and 4 g MgSO₄, shake, and centrifuge.
- Perform a dSPE cleanup using 230 mg PSA and 450 mg C18 sorbents. After shaking and centrifuging, the extract is ready for analysis [47].
Key Findings: A recent study applying this method found organophosphorus pesticides in all analyzed honey samples, with at least one compound exceeding acceptable limits in each sample. PAH4 markers were detected in several samples, and 5-Hydroxymethylfurfural (HMF) levels exceeded the 40 mg/kg limit in some honeys, indicating poor freshness or improper storage [47].
Analysis of Glycols in Toothpaste
This is a summary of an FDA protocol for screening Diethylene Glycol (DEG) and Ethylene Glycol (EG) [50].
Sample Preparation:
- Disperse approximately 1.0 g of toothpaste in 5 mL of water.
- Add 5 mL of acetonitrile in portions to suppress foam.
- Centrifuge at 5000 g for 10 minutes.
- Transfer supernatant to an autosampler vial and add internal standard (1,3-Propanediol) [50].
GC-MS Conditions:
- Column: Restek Stabilwax or equivalent (30 m x 0.25 mm id, 0.25 µm df).
- Inlet Temperature: 250°C, operated in split mode (20:1).
- Oven Program: 100°C (hold 1 min) to 250°C at 10°C/min (hold 4 min).
- MS Detection: Full scan mode (e.g., 29-400 amu) for identification. Quantification can use ions like m/z 75 for DEG and m/z 62 for EG [50].
Mass Spectrometry Imaging for Food Component Localization
Mass Spectrometry Imaging (MSI) is a two-dimensional technology that visualizes the spatial distribution of compounds in tissue sections without extraction or labeling [28].
Workflow:
- The sample (e.g., a thin section of food tissue) is mounted on a target plate.
- The surface is irradiated in a raster pattern by a laser or ion beam.
- Mass spectra are collected at each coordinate point.
- Software compiles the data to generate ion images for specific m/z values [28].
Common Ionization Techniques:
- MALDI (Matrix-Assisted Laser Desorption/Ionization): Suitable for a wide range of metabolites, lipids, and peptides. Lateral resolution: 5-200 µm [28].
- DESI (Desorption Electrospray Ionization): Performed under ambient conditions. Ideal for lipids, small metabolites. Lateral resolution: 50-200 µm [28].
- SIMS (Secondary Ion Mass Spectrometry): Offers the highest spatial resolution (>1 µm) but is typically limited to smaller molecules like elements and lipids [28].
Tabulated Data and Reagents
Table 1: Common GC-MS Sorbents and Their Applications
| Sorbent Type | Chemical Phase | Primary Function | Typical Applications |
|---|---|---|---|
| Reversed Phase | C18 | Retains non-polar to moderately polar compounds; ideal for trace organics in aqueous matrices. | Drugs in biological matrices; environmental water samples [49]. |
| Reversed Phase | C8 | Less retentive alternative to C18 for non-polar to moderately polar compounds. | Same as C18, but for less hydrophobic analytes [49]. |
| Normal Phase | Silica | Isolates polar analytes from non-polar matrices. | Pesticides, carotenoids, phospholipids, fat-soluble vitamins [49]. |
| Normal Phase | Florisil | Isolation of polar compounds from non-polar matrices. | Pesticides (AOAC/EPA methods); PCBs in transformer oil [49]. |
| Mixed-Mode | Zirconium Dioxide (ZrO₂) | Selective removal of phospholipids from complex, fatty matrices. | Pesticides and contaminants in fish tissue [48]. |
| Ion Exchange | Strong Cation Exchanger (SCX) | Isolation of charged basic compounds. | Antibiotics, organic bases, catecholamines, amino acids [49]. |
Table 2: Key Instrument Parameters for GC-MS Analyses
| Analysis Type | Sample Prep | GC Column | Oven Program (Example) | MS Detection |
|---|---|---|---|---|
| Pesticides/Contaminants in Fish [48] | QuEChERS (ZrO₂ dSPE) | Fast GC column for low-pressure operation | Not specified (Fast temperature ramp) | Tandem MS (MS-MS) in MRM mode |
| Glycols in Toothpaste [50] | Solvent (Water/ACN) extraction | 30 m Stabilwax (Crossbond Carbowax) | 100°C (1 min) to 250°C @ 10°C/min (hold 4 min) | Full Scan (29-400 amu) or SIM |
| Pesticides/PAHs in Honey [47] | Modified QuEChERS (PSA/C18) | Not specified | Not specified | Not specified |
The Scientist's Toolkit: Key Research Reagent Solutions
| Reagent / Material | Function / Explanation |
|---|---|
| Acetonitrile | A versatile polar aprotic solvent used as the primary extraction medium in QuEChERS and many other protocols [48] [47]. |
| Anhydrous Magnesium Sulfate (MgSO₄) | Added during QuEChERS to remove residual water from the organic extract, helping to drive partitioning and prevent dilution [47]. |
| Sodium Chloride (NaCl) | Used in liquid-liquid partitioning to adjust the ionic strength of the aqueous phase, improving the separation of acetonitrile from water [47]. |
| Isotope-Labeled Internal Standards | e.g., deuterated or C13-labeled analogs of target analytes. They correct for analyte loss during preparation and matrix effects during ionization, ensuring quantitative accuracy [48]. |
| Primary Secondary Amine (PSA) Sorbent | A dSPE sorbent used to remove polar interferences such as organic acids, sugars, and fatty acids from sample extracts [47]. |
| Zirconium Dioxide (ZrO₂) Sorbent | A advanced dSPE sorbent highly effective at selectively removing phospholipids, which are a major interference in GC-MS analysis of fatty foods [48]. |
| MALDI Matrix | e.g., α-cyano-4-hydroxycinnamic acid (CHCA). A low molecular weight compound that absorbs laser energy and facilitates the desorption/ionization of analytes in MALDI-MSI [28]. |
The assurance of food safety and quality is a global concern, driving the need for analytical methods that can detect a wide array of chemical substances at trace levels [51]. High-performance liquid chromatography and gas chromatography coupled with mass spectrometry have long been pillars in this field. However, the evolving landscape of food contaminants demands techniques that are both comprehensive and flexible [52]. The principles of exposomics encourage a holistic view of chemical exposure, requiring methods capable of detecting expected, suspected, and entirely unknown compounds [52]. This document details the application of Liquid Chromatography-Tandem Mass Spectrometry (LC-MS/MS) and High-Resolution Mass Spectrometry (HRMS) to meet these challenges, providing detailed protocols for their use in multi-residue and non-targeted screening within food analysis.
Core Analytical Techniques: Principles and Applications
Liquid Chromatography-Tandem Mass Spectrometry (LC-MS/MS)
LC-MS/MS is a confirmatory technique that provides highly specific qualitative and sensitive quantitative data [53]. It operates on the principle of separating compounds via liquid chromatography followed by detection and identification using a tandem mass spectrometer. This system provides several layers of information for compound confirmation: the chromatographic retention time, the mass-to-charge ratio (m/z) for precursor and product ions, and the multiple reaction monitoring (MRM) transition ratios, which together act as a unique fingerprint for a molecule [53]. Its high sensitivity and specificity make it the "gold standard" for definitively identifying and quantifying target contaminants at low concentrations once a potential hazard has been flagged [53].
High-Resolution Mass Spectrometry (HRMS)
HRMS instruments, such as Time-of-Flight (TOF) or Orbitrap mass spectrometers, provide accurate mass measurements with resolutions typically exceeding 20,000 full width at half maximum [54]. The key benefit of HRMS is its non-targeted data acquisition, allowing analysts to decide post-acquisition whether to use the data for (a) target screening (using reference standards), (b) suspect screening (using exact mass and isotopic patterns), or (c) true non-target screening (starting with the data to find differences between samples) [54]. This capability for retrospective data mining is invaluable for identifying unexpected contaminants.
Technique Comparison and Data Presentation
The following table summarizes the key characteristics, applications, and performance data of multi-residue (targeted) and non-targeted screening approaches.
Table 1: Comparison of Targeted Multi-Residue and Non-Targeted Screening Approaches
| Feature | Targeted Multi-Residue Screening (LC-MS/MS) | Non-Targeted Screening (HRMS) |
|---|---|---|
| Primary Goal | Quantification and confirmation of predefined contaminants [53] | Discovery and identification of unknown/unsuspected contaminants [54] |
| Analytical Approach | Targeted | Suspect screening or (true) non-targeted [54] |
| Typical Workflow | QuEChERS extraction, LC-MS/MS analysis with MRM [52] | Sample extraction, UHPLC-HRMS, data processing via software alignment [54] |
| Data Acquired | Retention time, MRM transitions [53] | Full-scan accurate mass data, isotope patterns, fragment spectra [54] |
| Throughput | High-throughput for known targets [52] | Lower throughput due to complex data processing |
| Practical Detection Limit | Compound-dependent; can achieve µg·kg⁻¹ levels [51] [52] | ~25 µg/kg for diverse model compounds in milk [54] |
| Key Advantage | High sensitivity and quantitative rigor for compliance testing [53] | Ability to find compounds not on predefined lists [54] |
| Reported Performance | Recovery rates of 77-119% for 211 pesticides in dates [52]; LODs of 0.8-4.5 µg·kg⁻¹ for antimicrobials in lettuce [51] | 17 out of 19 model compounds detected at 25 µg/kg in milk with only 2 irrelevant hits [54] |
Experimental Protocols
Protocol 1: Multi-Residue Pesticide Screening in Produce using LC-MS/MS and GC-MS/MS
This protocol, adapted from a study screening 211 pesticides in date fruits, uses a QuEChERS-based extraction followed by parallel analysis with UHPLC-MS/MS and GC-MS/MS for comprehensive coverage [52].
I. Sample Preparation (QuEChERS Extraction)
- Homogenization: homogenize a representative sample of the fruit or vegetable matrix.
- Aliquot: Weigh 10.0 ± 0.1 g of the homogenized sample into a 50-mL centrifuge tube.
- Extraction: Add 10 mL of acetonitrile to the tube. Vigorously shake for 1 minute.
- Salting Out: Add a salt mixture (e.g., 4 g MgSO₄, 1 g NaCl, 1 g trisodium citrate dihydrate, 0.5 g disodium hydrogencitrate sesquihydrate). Immediately shake vigorously for 1 minute to prevent salt clumping.
- Centrifugation: Centrifuge at ≥ 3000 ×g for 5 minutes.
- Clean-up (Optional): For dirty matrices, transfer an aliquot (e.g., 1 mL) of the upper acetonitrile layer to a dispersive-SPE (d-SPE) tube containing cleanup sorbents (e.g., 150 mg MgSO₄, 25 mg PSA). Shake and centrifuge.
- Filtration: The final extract is filtered through a 0.22 µm syringe filter prior to instrumental analysis.
II. Instrumental Analysis
- UHPLC-MS/MS Conditions:
- Column: C18 column (e.g., 2.1 × 100 mm, 2 µm) [53].
- Mobile Phase: (A) Water with 5 mM ammonium formate and 0.02% formic acid, (B) Methanol with 5 mM ammonium formate and 0.02% formic acid [54].
- Gradient: From 11% B to 100% B, with a flow gradient from 200 to 450 µL/min over the run [54].
- MS: Electrospray Ionization (ESI), positive/negative switching. Data acquisition in scheduled MRM mode.
- GC-MS/MS Conditions:
- Column: Standard non-polar or mid-polar capillary GC column (e.g., 30 m × 0.25 mm, 0.25 µm).
- Injection: Pulsed splittless mode.
- Carrier Gas: Helium.
- Temperature Program: Ramp from an initial low temperature (e.g., 60°C) to a high final temperature (e.g., 300°C).
- MS: Electron Impact (EI) ionization. Data acquisition in MRM mode.
III. Data Analysis
- Identify analyte peaks based on retention time alignment with matrix-matched calibration standards (± 0.1 min) and the presence of all required MRM transitions.
- Quantify using a calibration curve constructed from matrix-matched standards to correct for matrix effects.
- Confirm identity by ensuring the ion ratio between MRM transitions falls within ± 30% of the average ratio from the calibration standards.
Protocol 2: Non-Targeted Screening for Unexpected Contaminants using UHPLC-HRMS
This protocol is based on a metabolomics approach for detecting unexpected contaminants in milk, optimized for low-concentration detection [54].
I. Sample Preparation and Study Design
- Sample Set-up:
- Use a set of reference samples (e.g., different brands/fat contents of milk) and test samples.
- For method validation, prepare fortified samples by spiking a blank matrix with a mixture of model compounds at various concentrations (e.g., 5, 25, 100, 400 µg/kg) [54].
- Extraction:
- Weigh 10 g (± 0.05 g) of sample into a 50-mL test tube.
- Add 1 mL of water and 6 mL of acetonitrile with 1% (v/v) formic acid.
- Mix vigorously and centrifuge (3000 ×g, 10°C, 10 min).
- Filter the supernatant (e.g., using Mini-UniPrep vials) and store at +5°C until analysis [54].
II. Instrumental Analysis (UHPLC-TOF-MS)
- Chromatography:
- Mass Spectrometry:
III. Data Processing and Evaluation
- Feature Detection: Process raw data using specialized software (e.g., TracMass 2) for "peak picking" to detect all possible chemical features (mass, retention time pairs) [54].
- Alignment: Align features across all sample runs (blanks, references, and test samples) [54].
- Prioritization: Statistically compare the feature lists to prioritize signals that are present only in the test samples or that show a significant difference in abundance compared to the reference set. No target lists are used at this stage [54].
- Identification: For prioritized features, use the exact mass to propose molecular formulas. Further confirmation can involve consulting spectral libraries or acquiring MS/MS spectra for structural elucidation (though this was outside the scope of the original study) [54].
Workflow Visualization
The following diagram illustrates the logical workflow for the non-targeted screening approach using HRMS.
Non-Targeted Screening Workflow
The Scientist's Toolkit: Essential Research Reagent Solutions
Successful implementation of the described protocols relies on specific reagents and materials. The following table lists key solutions and their functions.
Table 2: Essential Research Reagents and Materials for Food Contaminant Analysis
| Item | Function / Application |
|---|---|
| QuEChERS Extraction Kits | Standardized kits for quick, easy, cheap, effective, rugged, and safe sample preparation for pesticide residue analysis [52]. |
| Dispersive-SPE (d-SPE) Tubes | For post-extraction clean-up to remove matrix interferents like fatty acids and pigments (e.g., using PSA, C18, graphitized carbon black sorbents) [52]. |
| UHPLC C18 Chromatography Columns | The workhorse stationary phase for reversed-phase separation of a wide range of contaminants; core-shell particle technology can enhance efficiency [53]. |
| Mobile Phase Additives | High-purity ammonium formate and formic acid for buffering the mobile phase to enhance ionization in ESI positive mode [54]. |
| Accurate Mass Calibration Solution | A standard solution (e.g., sodium formate clusters) for initial and ongoing calibration of the HRMS instrument to ensure mass accuracy [54]. |
| Internal Standard/Lock Mass | A compound (e.g., methyl stearate) introduced during analysis for real-time internal mass calibration in HRMS, correcting for instrumental drift [54]. |
| Matrix-Matched Calibration Standards | Calibration standards prepared in a blank matrix extract to compensate for matrix effects that can suppress or enhance analyte signal [53]. |
| Model Compound Contaminant Mix | A mixture of chemically diverse standard compounds (e.g., pesticides) used for spiking experiments to validate and optimize non-targeted methods [54]. |
The integration of LC-MS/MS and HRMS provides a powerful, complementary framework for modern food safety analysis. While LC-MS/MS offers unparalleled sensitivity and quantitative precision for targeted multi-residue screening, HRMS enables a proactive, discovery-oriented approach through non-targeted screening, which is essential for identifying unexpected food contaminants in the exposomic era [54] [52]. The protocols and data presented herein provide researchers with a detailed roadmap for implementing these advanced techniques, contributing to the broader goal of ensuring a safer global food supply. Future directions will involve greater harmonization of non-targeted workflows, expansion of compound databases, and the integration of predictive models to further enhance food authenticity and safety assessment [51] [52].
In the analysis of food components using High-Performance Liquid Chromatography (HPLC) and Gas Chromatography-Mass Spectrometry (GC-MS), sample preparation is a critical prerequisite that significantly influences the accuracy, sensitivity, and reproducibility of results. Effective sample preparation serves to isolate target analytes from complex food matrices, reduce matrix interferences, and concentrate analytes to detectable levels, thereby protecting and enhancing instrumental performance. This article provides a detailed examination of three cornerstone techniques—QuEChERS, Solid-Phase Extraction (SPE), and Solid-Phase Microextraction (SPME)—within the context of a broader thesis on food analysis research. Aimed at researchers and drug development professionals, this guide presents structured application notes, detailed protocols, and curated reagent solutions to empower method development and mastery in this foundational area of analytical chemistry.
The selection of an appropriate sample preparation method is contingent upon the physicochemical properties of the target analytes, the complexity of the food matrix, and the requirements of the subsequent chromatographic analysis. The following table provides a high-level comparison of the three primary techniques discussed in this article.
Table 1: Comparison of Key Sample Preparation Techniques
| Technique | Principle | Best For | Throughput | Solvent Consumption | Relative Cost |
|---|---|---|---|---|---|
| QuEChERS | Dispersive SPE partitioning using salting-out and d-SPE cleanup [55] | Multiresidue pesticide analysis, polar to semi-polar compounds [56] [55] | High | Low | Low |
| SPE | Selective partitioning between liquid sample and solid sorbent [57] [58] | Purification and concentration of specific analyte classes from complex samples [57] [59] | Medium | Medium | Medium |
| SPME | Equilibrium partitioning of analytes onto a coated fiber [60] [61] | Volatile and semi-volatile compounds, headspace analysis, minimal solvent methods [60] [61] | Low | Very Low | High (fiber) |
QuEChERS: Quick, Easy, Cheap, Effective, Rugged, and Safe
Principles and Applications
The QuEChERS method was introduced in 2003 as a streamlined approach for the extraction of pesticide residues in produce [56]. Its core principle involves partitioning an aqueous sample with an organic solvent (typically acetonitrile) in the presence of salts, followed by a cleanup step using dispersive Solid-Phase Extraction (d-SPE) [55]. The technique has since evolved beyond its original scope and is now widely used for the analysis of pharmaceuticals, mycotoxins, and other contaminants in various food matrices, including fruits, vegetables, grains, meat, and dairy products [56] [55]. Its popularity stems from its simplicity, minimal solvent usage, and compliance with green chemistry principles.
Detailed Protocol for Pesticide Residue Analysis in Produce
The following workflow diagram outlines the key stages of the QuEChERS method for the analysis of a fruit or vegetable sample.
Figure 1: QuEChERS Workflow for Pesticide Analysis
Step 1: Sample Extraction
- Weigh 10.0 ± 0.1 g of homogenized sample into a 50 mL centrifuge tube.
- Add 10 mL of acetonitrile (ACN) and shake vigorously for 1 minute [55].
- Add a pre-packaged salt mixture typically containing 4 g of magnesium sulfate (MgSO₄), 1 g of sodium chloride (NaCl), and a buffering agent (e.g., citrate salts) to induce phase separation and stabilize pH-sensitive pesticides.
- Shake immediately and vigorously for another minute to prevent salt clumping and ensure proper partitioning.
- Centrifuge at >3000 RCF for 5 minutes to achieve clear phase separation. The target analytes are now in the upper organic (ACN) layer [55].
Step 2: Partitioning and Cleanup (d-SPE)
- Transfer an aliquot (e.g., 1 mL) of the upper ACN extract into a 2 mL d-SPE tube containing a cleanup sorbent mixture.
- A typical d-SPE tube contains 150 mg MgSO₄ (for water removal) and 25 mg of Primary Secondary Amine (PSA) sorbent (to remove fatty acids, sugars, and other organic acids) [55].
- For pigmented samples or those high in lipids, additional sorbents like C18 (50 mg) or Graphitized Carbon Black (GCB, ~7.5 mg) may be added to remove pigments and sterols, respectively. Use GCB cautiously as it can also retain planar pesticides.
- Shake the mixture for 30 seconds and centrifuge at >3000 RCF for 2 minutes.
Step 3: Analysis Preparation
- Carefully collect the purified supernatant.
- The extract may be diluted with solvent or concentrated under a gentle stream of nitrogen if needed to match the calibration range of the instrument.
- Transfer the final extract to an autosampler vial for analysis by LC-MS/MS or GC-MS [55].
Research Reagent Solutions for QuEChERS
Table 2: Essential Reagents for QuEChERS Protocols
| Reagent / Material | Function | Application Note |
|---|---|---|
| Acetonitrile (ACN) | Extraction solvent | Efficiently extracts a wide range of polar to mid-polar pesticides; induces phase separation with salts. |
| MgSO₄ (Anhydrous) | Salting-out agent | Highly hygroscopic; removes water from the organic phase, improving partitioning and recovery [55]. |
| NaCl | Salting-out agent | Aids in phase separation by reducing the solubility of ACN in the aqueous layer [55]. |
| PSA Sorbent | d-SPE clean-up | Chelates and removes fatty acids, sugars, and certain pigments from the extract [55]. |
| C18 Sorbent | d-SPE clean-up | Removes non-polar interferences like lipids and sterols from the sample matrix [55]. |
| Citrate or Acetate Buffers | pH Control | Prevents degradation of pH-sensitive pesticides (e.g., organophosphates) during extraction, ensuring high recovery [55]. |
Solid-Phase Extraction (SPE)
Principles and Applications
SPE is a more selective technique used to purify and concentrate analytes from a liquid sample by exploiting their affinity for a solid sorbent. The basic protocol involves passing the sample through a cartridge or well-plate containing the sorbent, where target analytes are retained. Interfering matrix components are washed away, and the analytes are then eluted with a strong solvent [57] [58]. SPE is exceptionally versatile and is widely applied in food analysis for cleaning up samples for mycotoxin testing, extracting vitamins, isolating drug residues, and preparing samples for PFAS analysis under methods like EPA 537 [57] [62] [59].
Detailed Protocol for Cleanup of Complex Samples
The following diagram illustrates the standard load-wash-elute sequence for a reversed-phase SPE protocol.
Figure 2: Standard SPE Load-Wash-Elute Protocol
Step 1: Conditioning
- Pass 1-2 column volumes of a strong organic solvent (e.g., methanol) through the SPE sorbent bed. This solvates the functional groups and prepares the surface for interaction.
- Follow immediately with 1-2 column volumes of water or a buffer that matches the pH and ionic strength of the sample. Do not let the sorbent bed run dry between conditioning and sample loading [58].
Step 2: Equilibration (Optional but Recommended)
- Pass 1-2 column volumes of a weak solvent (e.g., water or a weak buffer) that matches the sample matrix. This ensures the sorbent environment is optimal for retaining the target analytes when the sample is loaded, especially critical for ion-exchange mechanisms [58].
Step 3: Sample Loading
- Load the prepared sample onto the conditioned cartridge at a controlled, moderate flow rate (0.5–1 mL/min is typical). This allows sufficient time for the analytes to interact with and be retained by the sorbent.
- Ensure the sample volume does not exceed the binding capacity of the sorbent to prevent breakthrough and low recovery [58].
Step 4: Washing
- After the sample has passed through, wash the sorbent bed with 1-3 mL of a solvent with intermediate strength. This solvent should be strong enough to remove weakly bound matrix interferences but not so strong as to elute the analytes of interest.
- A common wash for reversed-phase SPE is 5-20% methanol in water. Optimization is required to balance cleanliness and recovery [58].
Step 5: Elution
- Elute the purified analytes by applying 1-2 mL of a strong solvent that disrupts the analyte-sorbent interactions. For reversed-phase SPE, this is typically a pure organic solvent like methanol, acetonitrile, or an acidified/organic mixture.
- Using the minimal effective volume will yield a more concentrated final extract. Collect the eluate in a clean tube [58].
Step 6: Post-Elution Processing
- The eluate often needs to be prepared for instrumental analysis. This typically involves evaporating the solvent to dryness under a gentle stream of nitrogen and reconstituting the residue in a solvent compatible with the HPLC or GC-MS mobile phase [58].
Research Reagent Solutions for SPE
Table 3: Common SPE Sorbents and Their Applications in Food Analysis
| Sorbent Type | Retention Mechanism | Typical Food Analysis Applications |
|---|---|---|
| C18 / C8 | Reversed-Phase (Hydrophobic) | Extraction of non-polar to moderately polar compounds (e.g., vitamins, mycotoxins, some pesticides) from aqueous samples [58]. |
| HLB (Hydrophilic-Lipophilic Balanced) | Reversed-Phase (Dual-Mode) | Broad-spectrum extraction of acidic, basic, and neutral compounds; ideal for multi-class residue analysis without pH adjustment [57]. |
| Silica / NH₂ / CN | Normal-Phase (Polar) | Extraction of polar analytes (e.g., carbohydrates, pigments) from non-polar sample matrices [58]. |
| SCX (Strong Cation Exchange) | Ion-Exchange | Selective retention of basic compounds (e.g., certain veterinary drugs, alkaloids) at low pH [57]. |
| MAX (Mixed-Mode Anion Exchange) | Ion-Exchange & Reversed-Phase | Selective retention of acidic compounds (e.g., PFAS, certain herbicides, organic acids) at high pH [57] [62]. |
| Florisil | Adsorption | Cleanup for pesticide residues (e.g., in EPA Method 8081), particularly for removing lipids and other polar interferences [62]. |
Solid-Phase Microextraction (SPME)
Principles and Applications
SPME is a non-exhaustive, solvent-free technique that integrates sampling, extraction, and concentration into a single step. It involves exposing a fused silica fiber coated with a stationary phase to the sample (either by direct immersion or via the headspace). Analytes partition from the sample matrix into the coating until equilibrium is reached. The fiber is then retracted and introduced directly into the GC or HPLC inlet for thermal or solvent desorption [60] [61]. Owing to its minimal solvent use and ability to analyze volatile compounds, SPME is perfectly suited for the analysis of flavors, aromas, off-odors, and volatile contaminants in food products.
Detailed Protocol for Headspace Analysis of Volatiles
Step 1: Fiber Selection
- Select a fiber coating based on the polarity and molecular weight of the target analytes. Common coatings for food volatiles include:
Step 2: Sample Preparation and Incubation
- Place the solid or liquid food sample in a headspace vial. For complex matrices, dilution with water or salt addition may be necessary to adjust the ionic strength and improve volatile release.
- Seal the vial with a PTFE/silicone septum cap.
- Incubate the vial in a heated agitator to drive volatile compounds into the headspace. Temperature and time must be optimized for each application [60].
Step 3: Extraction
- Pierce the septum with the SPME needle and expose the fiber to the sample headspace.
- Extract for a predetermined time with continuous agitation of the sample (if liquid) to reduce equilibrium time.
- The extraction can be performed at equilibrium (for maximum sensitivity and precision) or in pre-equilibrium mode (for faster analysis), but timing must be strictly consistent [60] [61].
Step 4: Desorption and Analysis
- Retract the fiber into the needle and withdraw it from the vial.
- Immediately insert the needle into the hot GC injection port (or HPLC desorption chamber) and expose the fiber for the time required for complete desorption of analytes.
- The fiber can be re-used after a conditioning step in a dedicated port or injector to prevent carryover [60].
Research Reagent Solutions for SPME
Table 4: SPME Fiber Coatings and Their Food Science Applications
| Fiber Coating | Analyte Polarity | Typical Food Analysis Applications |
|---|---|---|
| PDMS | Non-polar | Analysis of hydrocarbons, terpenes, and general flavor volatiles in beverages, oils, and spices [60]. |
| PDMS/DVB | Bipolar | Extraction of polar alcohols, esters, and ketones; widely used for flavor profiling of fruits, dairy, and fermented products [60]. |
| PA (Polyacrylate) | Polar | Suitable for more polar compounds, such as phenols and free fatty acids [60]. |
| CAR/PDMS | Bipolar (Microporous) | Trapping of very small, volatile molecules (e.g., sulfur compounds in beer/onions, ethylene in fruit) [60]. |
| CW/DVB (Carbowax/DVB) | Polar | Extraction of polar analytes like alcohols and organic acids [60]. |
Derivatization in Food Analysis
Role and Workflow Integration
Derivatization is a chemical technique used to modify an analyte to make it more amenable to chromatographic analysis or detection. In the context of food analysis using HPLC and GC-MS, its primary purposes are:
- To Enable GC Analysis: To increase the volatility and thermal stability of non-volatile or thermally labile compounds (e.g., amino acids, organic acids, sugars) by masking polar functional groups (e.g., -OH, -COOH, -NH₂) [63].
- To Enhance Detection: To attach a chromophore or fluorophore to an analyte for sensitive UV/FL detection in HPLC, or to improve fragmentation and sensitivity in MS detection.
Derivatization can be performed pre-column (before injection) or post-column (after separation but before detection). Pre-column derivatization is more common but can create additional byproducts, while post-column derivatization requires specialized instrumentation but is typically more robust.
Application Note: GC-MS Analysis of Polar Compounds
A classic application is the analysis of glyphosate and its metabolites, which are highly polar and ionic, making them unsuitable for direct GC-MS analysis. As highlighted in a 2025 method for sediments, a derivatization-free approach using HILIC-MS/MS is increasingly favored [63]. However, for GC-MS, these compounds must be derivatized. A common procedure involves using a silylating agent like N,O-Bis(trimethylsilyl)trifluoroacetamide (BSTFA) with 1% trimethylchlorosilane (TMCS):
- The purified extract is transferred to a derivatization vial and dried completely.
- A pyridine/BSTFA mixture is added, and the vial is heated (e.g., 70-80°C for 20-30 minutes).
- The reaction converts the polar -OH and -COOH groups into less polar trimethylsilyl (TMS) ethers and esters, making the derivatives volatile enough for GC-MS analysis.
- The derivatized sample is cooled and directly injected into the GC-MS.
This process, while powerful, adds complexity and is being superseded for some applications by modern LC-MS/MS techniques that require no derivatization [63].
Curcuminoid Analysis in Turmeric and Food Supplements
Curcuminoids, the principal bioactive compounds in turmeric (Curcuma longa L.), consist of three main analogs: curcumin (C), demethoxycurcumin (DMC), and bisdemethoxycurcumin (BDMC). These compounds are responsible for turmeric's vibrant yellow color and its documented functional and nutraceutical properties, including antioxidant, anti-inflammatory, and anticarcinogenic activities [64]. The quantification of these individual curcuminoids is essential for quality control in food and pharmaceutical formulations, as their biological activities vary and may exhibit synergistic effects [64] [65].
Analytical Findings and Method Comparison
The selection of an analytical method depends on the sample matrix, required sensitivity, and whether individual curcuminoid quantification is necessary. Table 1 summarizes the key analytical techniques and their performance characteristics.
Table 1: Comparison of Analytical Methods for Curcuminoid Determination
| Analytical Method | Key Findings/Performance | Limitations |
|---|---|---|
| UV-Vis Spectrophotometry [64] | Simple; suitable for total curcuminoid content; uses methanol solvent; extinction coefficient (E1cm1%) of 1607 at 425 nm. | Cannot quantify individual curcuminoids; low precision due to interference from other pigments. |
| IR Spectroscopy [64] | Rapid, non-destructive; combined with chemometrics (e.g., PLS) for quantification; characteristic absorptions at ~1700 nm and 2300–2320 nm. | Requires a large set of samples from different sources to build a robust calibration model. |
| TLC/HPTLC [64] | Low cost, selective; mobile phase, e.g., chloroform:acetic acid (80:20 v/v). | Broad spots, plate-to-plate variations. |
| UHPLC-DAD [65] | Rapid analysis (<7 min); excellent resolution (Rs > 4.0 between critical pairs); high precision (RSD < 1.2%); good recovery (94.6–105.2%). | Requires specialized UHPLC equipment. |
| HPLC-MS [64] [65] | Considered the "gold standard"; high sensitivity and specificity; allows for identification and quantification. | Higher instrument cost and operational complexity. |
Detailed Protocol: UHPLC-DAD for Curcuminoids and Piperine in Supplements
This protocol describes a rapid, validated method for the simultaneous determination of curcuminoids and piperine in food supplements [65].
- Instrumentation: Ultra-High-Performance Liquid Chromatography system with a Diode Array Detector (UHPLC-DAD).
- Column: C-18 reversed-phase column (e.g., 100 mm x 2.1 mm, 1.8 µm particle size).
- Mobile Phase: Binary gradient of (A) 0.1% (v/v) formic acid in water and (B) 0.1% (v/v) formic acid in acetonitrile.
- Gradient Program: 0-1 min (50% B), 1-5 min (50% → 80% B), 5-6 min (80% B), 6-6.1 min (80% → 50% B), 6.1-7 min (50% B).
- Flow Rate: 0.4 mL/min.
- Detection: DAD, 425 nm for curcuminoids and 340 nm for piperine.
- Column Temperature: 40 °C.
Injection Volume: 2 µL.
Sample Preparation:
- Homogenize the content of food supplement capsules.
- Accurately weigh about 50 mg of powder into a 25 mL volumetric flask.
- Add 20 mL of a mixture of acetonitrile and glacial acetic acid (98:2, v/v).
- Sonicate the mixture for 15 minutes in an ultrasonic bath.
- Cool to room temperature, dilute to the mark with the same extraction solvent, and mix well.
- Centrifuge an aliquot at 10,000 rpm for 5 minutes.
- Filter the supernatant through a 0.22 µm membrane filter into a UHPLC vial for analysis.
The following workflow diagram illustrates the complete analytical procedure for curcuminoid analysis:
The Scientist's Toolkit: Key Reagents and Materials
Table 2: Essential Research Reagents for Curcuminoid Analysis
| Reagent/Material | Function/Application |
|---|---|
| Acetonitrile (HPLC grade) | Mobile phase component and extraction solvent for efficient compound separation and recovery. |
| Formic Acid (LC-MS grade) | Mobile phase additive to improve chromatographic peak shape and suppress analyte ionization. |
| Methanol (HPLC grade) | Common extraction solvent for curcuminoids from turmeric powder. |
| Glacial Acetic Acid | Used in the extraction solvent mixture to enhance the recovery of curcuminoids. |
| C-18 Reversed-Phase UHPLC Column | Stationary phase for the separation of curcuminoids and piperine based on hydrophobicity. |
| Curcumin, DMC, BDMC, Piperine Standards | Reference standards for method calibration, qualification, and quantification. |
Cholesterol and Oxysterol Analysis in Meat and Animal Products
Cholesterol is a major sterol in animal-derived foods. While its dietary impact is now viewed with more nuance, it is susceptible to oxidation during processing and storage, forming cholesterol oxidation products (COPs) such as 7-ketocholesterol (7K) and 5,6α-epoxycholesterol (5,6αE) [66]. COPs are considered emerging contaminants due to their association with increased oxidative stress, inflammatory processes, and chronic diseases [66]. Accurate analytical methods are therefore critical for food quality assessment and nutritional labeling.
Analytical Findings
Simplified methods that eliminate the lipid extraction step have been developed to reduce analysis time and solvent use. A modified method based on AOAC 994.10 uses direct saponification of meat samples, followed by GC analysis without derivatization, achieving a limit of detection (LOD) of 1.07 mg/100 g of fresh muscle [67]. For the simultaneous determination of COPs and squalene (which can inhibit cholesterol oxidation), a sensitive GC-TOF/MS method has been established. This method is characterized by low LODs (0.01–0.08 ng/µL for COPs), high recovery (>85%), and good repeatability (RSD 2.3–6.2%) [66]. In most animal products, the total COP content is about 1% of the total cholesterol, with 7-ketocholesterol being the dominant oxysterol [66].
Detailed Protocol: GC-TOF/MS for Squalene, Cholesterol, and COPs
This protocol outlines a comprehensive procedure for the simultaneous analysis of squalene, cholesterol, and seven COPs in animal-origin products [66].
- Instrumentation: Gas Chromatography coupled to Time-of-Flight Mass Spectrometry (GC-TOF/MS).
- Column: High-temperature stable capillary GC column.
- Sample Preparation:
- Saponification: Homogenize the food sample. Weigh a representative portion (e.g., 0.1–0.5 g) into a tube. Add an internal standard and a methanolic potassium hydroxide (KOH) solution. Heat the mixture to saponify the esters.
- Extraction: After saponification, cool the mixture and extract the unsaponifiable matter (including sterols and squalene) with an organic solvent such as ethyl acetate or hexane.
- Derivatization: Evaporate the extract under a stream of nitrogen gas. To enhance volatility for GC analysis, derivatize the hydroxylated compounds (COPs and cholesterol) by reacting with BSTFA (N,O-Bis(trimethylsilyl)trifluoroacetamide) to form trimethylsilyl (TMS) ethers.
- GC-TOF/MS Conditions:
- Injector Temperature: 280–300 °C.
- Carrier Gas: Helium, at a constant flow rate.
- Oven Temperature Program: A graded temperature ramp is used to achieve separation (e.g., from 150 °C to 300 °C or higher).
- MS Detection: Electron Impact (EI) ionization mode. Acquisition in full-scan mode for accurate identification and quantification using characteristic ions.
The logical relationship and analytical pathway for cholesterol and COP analysis is summarized below:
The Scientist's Toolkit: Key Reagents and Materials
Table 3: Essential Research Reagents for Cholesterol and COP Analysis
| Reagent/Material | Function/Application |
|---|---|
| Methanolic Potassium Hydroxide (KOH) | Saponification reagent to hydrolyze esterified sterols and lipids. |
| Ethyl Acetate / Hexane | Solvents for liquid-liquid extraction of unsaponifiable matter after saponification. |
| BSTFA with 1% TMCS | Derivatization agent to convert hydroxyl groups on cholesterol and COPs into volatile TMS ethers. |
| Squalene, Cholesterol, COP Standards | Certified reference materials for accurate calibration and quantification. |
| High-Temperature GC Capillary Column | Essential for separating underivatized free cholesterol and derivatized COPs. |
PFAS Analysis in Food Packaging Materials
Per- and polyfluoroalkyl substances (PFAS) are synthetic chemicals widely used in food packaging for their oil- and water-resistant properties [68]. Their strong carbon-fluorine bonds make them highly persistent in the environment, leading to their designation as "forever chemicals" [69] [68]. PFAS can migrate from packaging into food, especially under high temperatures, posing significant health risks including cancer, liver damage, and immunological disorders [69] [68]. Regulatory agencies worldwide are implementing stricter controls, driving the need for robust analytical methods [69].
Analytical Findings and Method Comparison
Liquid chromatography coupled with mass spectrometry is the cornerstone of PFAS analysis. The complexity of food matrices and the need to detect ultralow concentrations (parts-per-trillion) present significant analytical challenges [69] [30]. Table 4 summarizes key methodologies for PFAS analysis.
Table 4: Comparison of Analytical Techniques for PFAS Determination
| Analytical Technique | Key Findings/Performance | Limitations |
|---|---|---|
| UAE with UHPLC-MS [68] | Cost-effective, reduced solvent use; common extraction solvent: methanol; LODs in ng/g range. | Less effective for short-chain PFAS; potential ultrasonic probe degradation. |
| Focused Ultrasonic Solid-Liquid Extraction (FUSLE) [68] | Uses an ultrasonic probe for potentially more efficient extraction. | Method less established; requires further validation. |
| HPLC-HRMS/MS [69] [31] | High sensitivity and specificity; allows for non-targeted screening; essential for regulatory compliance. | High instrument cost; complex operation and data interpretation. |
| Online SPE-UHPLC-MS/MS [69] | Automated sample preparation; high throughput; reduces potential for contamination and human error. | Requires specialized and expensive instrumentation. |
Detailed Protocol: Ultrasonic-Assisted Extraction (UAE) and UHPLC-MS for PFAS in Food Packaging
This is a common and effective method for determining PFAS in solid packaging matrices [68].
- Instrumentation: Ultra-High-Performance Liquid Chromatography coupled with tandem Mass Spectrometry (UHPLC-MS/MS).
- Column: Core-shell C-18 reversed-phase column for high efficiency.
- Sample Preparation - UAE:
- Cut the food packaging material into small, uniform pieces.
- Accurately weigh 0.5–1.0 g of the sample into a polypropylene centrifuge tube (note: avoid glass as PFAS can adsorb to it).
- Add 10 mL of methanol and an appropriate mixture of isotopically labeled internal standards.
- Vortex the mixture for 2 minutes.
- Sonicate the tube in an ultrasonic water bath at 40–60 °C for 60 minutes.
- Centrifuge the sample (e.g., 10 min at 3,000 rpm).
- Transfer an aliquot (e.g., 5 mL) of the supernatant to a new tube.
- Concentrate the extract under a gentle stream of nitrogen gas at room temperature.
- Reconstitute the dried extract in 1 mL of methanol.
- Filter the reconstituted extract through a polypropylene or nylon syringe filter (e.g., 0.22 µm) into a UHPLC vial for analysis.
- UHPLC-MS/MS Conditions:
- Mobile Phase: (A) Ammonium acetate in water and (B) methanol or acetonitrile.
- Gradient Program: Optimized to separate a wide range of PFAS compounds.
- Ionization: Electrospray Ionization (ESI) in negative mode.
- Detection: Multiple Reaction Monitoring (MRM) for high sensitivity and selectivity.
The experimental workflow for PFAS analysis from food packaging is detailed below:
The Scientist's Toolkit: Key Reagents and Materials
Table 5: Essential Research Reagents for PFAS Analysis
| Reagent/Material | Function/Application |
|---|---|
| Methanol (LC-MS grade) | Primary solvent for the extraction of PFAS from solid matrices. |
| Ammonium Acetate (MS grade) | Mobile phase additive for improved ionization efficiency in LC-MS. |
| Isotopically Labeled PFAS Standards | Internal standards crucial for compensating for matrix effects and ensuring quantitative accuracy. |
| Polypropylene (PP) Labware | Used throughout sample prep to prevent adsorption of PFAS to glass surfaces and background contamination. |
| Solid-Phase Extraction (SPE) Cartridges | Used for sample clean-up and preconcentration (e.g., ENVI-Carb for removing interfering organic matter). |
Maximizing Performance: Troubleshooting and Strategic Optimization of Methods
Chromatography is a cornerstone analytical technique for separating, identifying, and quantifying components in complex food matrices. The selection of an appropriate chromatographic column—the heart of the separation system—is paramount to the success of any analysis. This guide details the selection criteria and application protocols for three principal chromatography modes used in food component analysis: Reversed-Phase High-Performance Liquid Chromatography (RP-HPLC or RPC), Normal-Phase HPLC (NP-HPLC or NPC), and Gas Chromatography (GC). The fundamental principle governing all these techniques is the differential partitioning of analytes between a stationary phase (contained within the column) and a mobile phase (a fluid that moves through the column) [70] [71]. The specific chemical and physical interactions between the analyte, stationary phase, and mobile phase determine the degree of retention and separation. In the context of food research, these techniques are indispensable for answering critical questions regarding the natural composition of food, the presence of additives and contaminants, and the formation of transformation products during processing or storage [72].
Reversed-Phase HPLC Column Chemistry
Core Principles and Stationary Phases
Reversed-Phase HPLC is the most prevalent separation mode, characterized by a non-polar stationary phase and a polar mobile phase, typically a mixture of water and organic solvents like methanol or acetonitrile [70] [73]. Separation occurs primarily based on the hydrophobicity of the analytes; more hydrophobic compounds have stronger interactions with the non-polar stationary phase and are thus retained longer [73]. The mobile phase composition can be adjusted isocratically or via a gradient to modulate the eluting strength and achieve separation.
The most common stationary phases are hydrophobic ligands chemically bonded to a silica base material. The selection of the ligand and the base material's properties critically impact the separation profile [73] [74].
Table 1: Common Reversed-Phase HPLC Stationary Phases and Their Food Applications
| Stationary Phase | Chemical Structure | Key Characteristics | Typical Food Analysis Applications |
|---|---|---|---|
| C18 (Octadecyl) | 18-carbon alkyl chain [74] | High hydrophobicity and retentivity; most widely used phase [73] | Vitamins, fatsoluble vitamins, phenolic compounds, mycotoxins, synthetic antioxidants |
| C8 (Octyl) | 8-carbon alkyl chain [74] | Moderate hydrophobicity; less retention than C18 [73] | Larger macromolecules, triglycerides, less hydrophobic analytes |
| C4 (Butyl) | 4-carbon alkyl chain | Low hydrophobicity; weak retention [75] | Peptides, proteins, large molecules with hydrophobic regions [73] |
| Phenyl | Phenyl ring(s) [74] | Moderately non-polar; provides π-π interactions with aromatic compounds [75] | Aromatic compounds, flavonoids, ring-containing contaminants |
| Pentafluorophenyl (PFP) | Phenyl ring with five fluorine atoms [74] | Moderately non-polar; multiple interaction mechanisms (dipole-dipole, π-π, etc.) [76] | Separation of isomers, complex mixtures of polar compounds |
The Hydrophobic Subtraction Model for Selectivity
While hydrophobicity is the dominant retention mechanism, selectivity is strongly influenced by other secondary interactions. The Hydrophobic Subtraction Model is a powerful tool for characterizing these interactions, classifying columns based on six parameters [77] [76]:
- Hydrophobicity (H): Dominant for neutral compounds; always present.
- Steric Resistance (S*): Governs shape selectivity; ability to discriminate between planar and non-planar molecules.
- Hydrogen-Bond Acidity (A): Ability of the stationary phase to donate a hydrogen bond (e.g., from residual silanols).
- Hydrogen-Bond Basicity (B): Ability of the stationary phase to accept a hydrogen bond.
- Cation Exchange Capacity at pH 2.7 (C2.7) & 7.6 (C7.6): Reflects the activity of ionized silanols, critical for the retention and peak shape of basic compounds.
Matching the column's selectivity profile to the analyte's chemical properties is the most effective way to improve resolution [76]. The following workflow diagram outlines a systematic approach to column selection in Reversed-Phase HPLC.
Particle and Pore Selection
The physical characteristics of the base material are as critical as the bonded chemistry:
- Particle Morphology: Core-shell particles (a solid core surrounded by a porous shell) provide faster chromatography and higher efficiency, ideal for performance gains. Fully porous particles offer excellent mechanical strength and are ideal for scaling up from analytical to preparative applications [76] [73].
- Pore Size: Must be matched to the analyte's molecular weight. Low molecular weight compounds (e.g., sugars, organic acids) are best suited to small pore sizes (60-100 Å). Peptides and proteins require wider pores (150-300 Å) to allow access to the stationary phase surface [75].
Table 2: Guide to Pore and Particle Size Selection for RP-HPLC
| Analyte Type (Molecular Weight) | Ideal Pore Size (Å) | Typical Particle Sizes (µm) | Common Food Analytes |
|---|---|---|---|
| Organic Molecules (< 1000 Da) | 60 - 100 Å [75] | 1.5 - 5 µm | Pesticides, vitamins, organic acids, synthetic dyes |
| Peptides & Small Proteins (1,000 - 10,000 Da) | 100 - 300 Å [75] | 1.7 - 5 µm | Bioactive peptides, enzymatic digests, small whey proteins |
| Proteins & Biopolymers (> 10,000 Da) | 300 - 1000+ Å [75] | 3 - 5 µm | Milk caseins, egg albumin, food allergen proteins |
Application Note: Protocol for Peptide Mapping of a Food Protein (e.g., Whey or Soy)
Objective: To achieve high-resolution separation of tryptic digest peptides from a food protein for identification and quantification using LC-MS.
Background: Peptide mapping is a fundamental tool for protein characterization, requiring high peak capacity separations to resolve potentially hundreds of peptides [78].
Materials & Reagents:
- Column: ACQUITY UPLC Peptide CSH C18, 130Å, 1.7 µm, 2.1 x 150 mm (or equivalent charged surface hybrid C18 column) [78].
- Mobile Phase A: 0.1% Formic Acid (v/v) in water.
- Mobile Phase B: 0.1% Formic Acid (v/v) in acetonitrile.
- LC System: UHPLC system capable of handling high backpressures and generating precise gradients.
- Detection: Mass Spectrometer (e.g., Q-TOF or Orbitrap).
- Sample: Tryptic digest of the target food protein (e.g., beta-lactoglobulin), ~0.1 mg/mL in 0.1% formic acid.
Experimental Protocol:
- Column Conditioning: Flush the column at 0.2 mL/min with 5% Mobile Phase B for 15 minutes, then equilibrate with 97.5% Mobile Phase A / 2.5% Mobile Phase B for at least 10 column volumes.
- LC Conditions:
- Column Temperature: 60 °C [78]
- Flow Rate: 0.2 mL/min
- Injection Volume: 5-10 µL
- Gradient Program:
- 0 - 2 min: Hold at 97.5% A / 2.5% B
- 2 - 62 min: Ramp to 50% A / 50% B
- 62 - 65 min: Ramp to 5% A / 95% B
- 65 - 66 min: Hold at 5% A / 95% B
- 66 - 68 min: Return to 97.5% A / 2.5% B
- 68 - 80 min: Re-equilibrate at 97.5% A / 2.5% B [78]
- Data Analysis: Process the MS data using appropriate software for peptide identification based on mass accuracy and, if available, fragmentation spectra (MS/MS).
Key Consideration: The use of a CSH (Charged Surface Hybrid) column and formic acid mobile phase is optimized for LC-MS compatibility, providing high peak capacities and good sensitivity without the ion-suppression effects associated with TFA [78].
Normal-Phase and HILIC Column Chemistry
Core Principles and Stationary Phases
Normal-Phase HPLC utilizes a polar stationary phase (e.g., bare silica) and a non-polar mobile phase (e.g., hexane or chloroform mixed with a polar modifier like isopropanol). Analytes elute in order of increasing polarity—less polar compounds elute first as they have weaker interactions with the stationary phase [70] [75]. This mode is suitable for compounds soluble in organic solvents and for separating structural isomers.
Hydrophilic Interaction Liquid Chromatography is a variant that uses a polar stationary phase with a mobile phase typically consisting of a high proportion of acetonitrile (>70%) mixed with an aqueous buffer. Retention increases with analyte polarity, making it ideal for analyzing highly polar, water-soluble compounds that are poorly retained in RP-HPLC [70] [75].
Table 3: Normal-Phase and HILIC Stationary Phases for Food Analysis
| Stationary Phase | Mode | Key Characteristics | Typical Food Analysis Applications |
|---|---|---|---|
| Silica (Si) | NP | Very polar; interacts with analytes via hydrogen bonding and dipole-dipole interactions [75] | Separation of non-ionic polar lipids (e.g., phospholipids), fat-soluble vitamins (A, D, E, K), carotenoids |
| Diol | NP / HILIC | Less polar than silica; provides hydrogen bonding capacity [75] | Carbohydrates, oligosaccharides, glycosides |
| Amino (NH2) | NP / HILIC | Weak anion exchanger; can act as a HILIC phase or for specific interactions in NP [75] | Sugar analysis (fructose, glucose, sucrose), amino acids, vitamins |
| Cyano (CN) | NP / RP | Versatile, weakly polar phase; can be used in both NP and RP modes [75] | Intermediate polarity compounds, pharmaceutical impurities |
Gas Chromatography Column Chemistry
Core Principles and Stationary Phases
Gas Chromatography separates volatile and semi-volatile compounds based on their differential partitioning between a gaseous mobile phase (inert carrier gas like helium or hydrogen) and a liquid stationary phase coated on the inner wall of a capillary column [71]. The separation factor (α), which has the greatest impact on resolution, is strongly affected by the polarity and selectivity of the stationary phase [79]. The choice of stationary phase is therefore the most critical decision in GC method development.
Stationary Phase Polarity and Selectivity
Stationary phase selectivity is determined by its chemical composition and how it interacts with target compounds through intermolecular forces (dispersion, dipole-dipole, and hydrogen bonding) [79]. The following diagram provides a logical flowchart for selecting a GC column based on the analyte and application.
Table 4: Common GC Stationary Phases for Food Analysis
| Stationary Phase Composition (USP Code) | Polarity | Common Equivalent Phases | Max Temp (°C) | Typical Food Analysis Applications |
|---|---|---|---|---|
| 100% Dimethyl Polysiloxane (G1) | Non-polar | Rxi-1ms, Rtx-1, DB-1, HP-1 [79] | 350-400 | Solvents, essential oils, hydrocarbons; elutes in boiling point order [79] |
| 5% Diphenyl / 95% Dimethyl Polysiloxane (G27) | Low-intermediate polarity | Rtx-5ms, Rxi-5ms, DB-5, HP-5 [79] | 350-400 | General purpose: Pesticides, PCBs, FAMEs, fragrances; most widely used phase |
| 35% Diphenyl / 65% Dimethyl Polysiloxane (G42) | Intermediate polarity | Rtx-35, DB-35, HP-35 [79] | 320-360 | Pesticides, drugs; good for "dirty" samples |
| 50% Phenyl Polysiloxane (G3) | Intermediate polarity | Rtx-50 [79] | 320 | Pharmaceuticals, agrochemicals |
| Polyethylene Glycol (WAX) (G16) | Polar | Stabilwax, DB-WAX [79] | 250 | Free Fatty Acids, alcohols, solvents, flavor and fragrance compounds |
Application Note: Protocol for Analysis of Fatty Acid Methyl Esters (FAMEs)
Objective: To separate and quantify a mixture of fatty acid methyl esters derived from a food lipid (e.g., fish oil, vegetable oil) to determine its fatty acid profile.
Background: GC is the primary technique for FAME analysis. A highly polar stationary phase is required to separate FAMEs based on both chain length and degree of unsaturation.
Materials & Reagents:
- Column: Highly polar cyanopropyl polysiloxane column (e.g., Rtx-2560, 100 m x 0.25 mm ID, 0.20 µm film thickness) [79].
- Carrier Gas: Hydrogen, 1.0 mL/min constant flow (for optimal efficiency) or Helium.
- Injector: Split/Splitless, operated in split mode (split ratio 50:1) at 250 °C.
- Detector: Flame Ionization Detector (FID) at 260 °C.
- Sample: FAME mix derived from the food sample, diluted in hexane (~1 mg/mL).
Experimental Protocol:
- GC Conditions:
- Oven Program:
- Initial Temp: 140 °C
- Hold Time: 5 min
- Ramp 1: 4 °C/min to 200 °C
- Hold Time: 5 min
- Ramp 2: 1 °C/min to 220 °C
- Hold Time: 10 min
- Ramp 3: 4 °C/min to 240 °C
- Hold Time: 15 min [79]
- Oven Program:
- Injection: Inject 1 µL of the sample.
- Data Analysis: Identify FAMEs by comparing retention times to a certified reference standard. Quantify based on peak area.
Key Consideration: The long, polar column and slow, multi-ramp temperature program are necessary to resolve critical pairs of FAMEs, such as cis/trans isomers and FAMEs with similar equivalent chain lengths.
The Scientist's Toolkit: Essential Research Reagents and Materials
Table 5: Key Reagents and Materials for Chromatographic Food Analysis
| Item | Function/Description | Application Examples |
|---|---|---|
| C18 Solid Phase Extraction (SPE) Cartridges | Pre-concentration and clean-up of samples; removes highly polar interferences. | Purification of pesticide residues, mycotoxins, and phenolic compounds from food extracts. |
| Formic Acid (LC-MS Grade) | Mobile phase additive; provides a proton source for positive ion mode MS and adjusts pH. | Peptide mapping, metabolomics, and general LC-MS analysis for improved ionization. |
| Trifluoroacetic Acid (TFA) | Ion-pairing reagent for peptides and proteins; provides excellent UV baseline and peak shape. | Preparative peptide separation with UV detection (note: can suppress MS ionization). |
| BSTFA + 1% TMCS | Derivatization reagent; silylates polar functional groups (-OH, -COOH, -NH2) to increase volatility and thermal stability. | Analysis of sugars, organic acids, and amino acids by GC-MS. |
| MSTFA | Derivatization reagent; used for trimethylsilylation of polar compounds for GC analysis. | Rapid derivatization for metabolomics studies targeting a wide range of metabolites. |
| Fatty Acid Methyl Ester (FAME) Mix | Certified reference material containing a range of FAMEs for qualitative and quantitative calibration. | Identification and quantification of fatty acids in oils and fats based on retention time matching. |
Within the framework of advanced research on HPLC and GC-MS methods for food component analysis, the critical role of the mobile phase cannot be overstated. In High-Performance Liquid Chromatography (HPLC), the mobile phase serves not only to transport the sample through the chromatographic system but also actively participates in the separation mechanism [80]. This application note provides a detailed protocol for optimizing mobile phase composition, pH, and gradient elution parameters specifically contextualized within food analysis, where complex matrices demand robust and reliable separation methods. The precise optimization of these parameters directly influences key chromatographic outcomes including resolution, sensitivity, and analysis time, thereby affecting the accuracy of results for diverse analytes from mycotoxins and pesticides to vitamins and amino acids [13] [81].
Mobile Phase Composition and Selection
Fundamental Principles and Solvent Characteristics
The mobile phase in HPLC is a solvent or mixture of solvents that carries the sample through the system. Its composition critically influences analyte separation by modulating interactions between the sample components and the stationary phase [82]. Selecting the appropriate mobile phase requires consideration of several factors: polarity, which determines the strength of the mobile phase and should match the analyte and stationary phase properties; pH, which controls the ionization state of ionizable analytes; and viscosity, which affects backpressure and column efficiency [80] [83]. For food analysis, where compounds range from polar carbohydrates and organic acids to non-polar lipids and fat-soluble vitamins, selecting the optimal mobile phase is paramount for successful separation [13].
Table 1: Common HPLC Mobile Phase Solvents and Their Properties
| Solvent | Polarity Index | UV Cutoff (nm) | Viscosity (cP) | Common Applications in Food Analysis |
|---|---|---|---|---|
| Water | 10.2 | <190 | 1.00 | Base solvent for reversed-phase chromatography; often modified with buffers or organic solvents [80] |
| Acetonitrile | 5.8 | 190 | 0.34 | Preferred organic modifier for RP-HPLC; provides sharp peaks and low background in UV/MS detection [84] [80] |
| Methanol | 5.1 | 205 | 0.55 | Alternative to acetonitrile; stronger elution strength for polar compounds; higher viscosity [80] |
| Tetrahydrofuran | 4.0 | 212 | 0.46 | Strong elution strength; useful for complex separations of polymers or antioxidants [83] |
| Hexane | 0.1 | 200 | 0.30 | Primary solvent for normal-phase chromatography of non-polar food components (e.g., lipids) [80] |
| Ethyl Acetate | 4.4 | 256 | 0.43 | Modifier in normal-phase HPLC; used for medium-polarity compounds [80] |
Mobile Phase Selection by Chromatographic Mode
The selection of mobile phase components must align with the chromatographic mode being employed. The following strategies are recommended based on separation mechanism:
Reversed-Phase Chromatography (RPC): This most common mode utilizes a non-polar stationary phase (e.g., C18) and a polar mobile phase. The standard combination is water with an organic modifier such as acetonitrile or methanol [82] [80]. Acetonitrile generally offers superior efficiency with lower viscosity and backpressure, while methanol can provide different selectivity for certain compounds [80]. For ionizable analytes, buffers (e.g., phosphate, acetate) or acidic additives (e.g., formic acid, trifluoroacetic acid) are incorporated to control pH and suppress ionization, thereby improving peak shape [84] [83].
Normal-Phase Chromatography (NPC): Employed for polar compounds, NPC uses a polar stationary phase (e.g., silica) with non-polar mobile phases such as hexane or chloroform, often modified with more polar solvents like ethyl acetate or isopropanol to adjust elution strength [82] [80]. This mode is particularly suitable for separating liposoluble vitamins, carotenoids, and lipids in food matrices [13].
Ion-Exchange Chromatography (IEC): For charged molecules like organic acids or amino acids, IEC employs aqueous buffer solutions (e.g., phosphate, acetate) as the mobile phase, with increasing ionic strength (salt gradient) to elute analytes [82] [80]. pH control is critical as it affects the charge state of both the analytes and the stationary phase [85].
Hydrophilic Interaction Liquid Chromatography (HILIC): Used for highly polar compounds, HILIC employs a gradient starting with a high proportion of organic solvent (acetonitrile) and increasing the aqueous component over time [85]. The pH of the buffers used can significantly impact selectivity by influencing analyte polarity [85].
Table 2: Mobile Phase Pairing Strategies for Different Food Analytes
| Analyte Category | Recommended Chromatographic Mode | Mobile Phase System | Common Additives |
|---|---|---|---|
| Mycotoxins, Pesticides | Reversed-Phase | Water + Acetonitrile/Methanol [81] | Formic acid, Ammonium acetate [81] |
| Vitamins (Water-soluble) | Reversed-Phase or HILIC | Water + Acetonitrile (RP) or High ACN % (HILIC) [13] [85] | Phosphate buffers, Ion-pairing reagents [13] |
| Vitamins (Fat-soluble) | Normal-Phase or Reversed-Phase | Hexane + Ethyl Acetate (NP) or Methanol/ACN (RP) [13] | Isopropanol, Acetic acid [80] |
| Antioxidants (Phenolics) | Reversed-Phase | Water + Acetonitrile + Acid [13] [81] | Formic acid, Phosphoric acid [81] |
| Organic Acids | Reversed-Phase or Ion-Exclusion | Dilute acidic solution (e.g., H₂SO₄) or Buffered aqueous [13] | Sulfuric acid, Phosphate buffers [13] |
| Amino Acids, Biogenic Amines | Reversed-Phase (after derivatization) or Ion-Exchange | Water + Acetonitrile/Methanol (RP) or Buffer gradient (IEC) [13] [81] | Ion-pairing agents (e.g., TFA), OPA reagent for PCD [83] [81] |
| Carbohydrates, Sugars | HILIC or Ion-Exchange | Acetonitrile + Water (HILIC) or NaOH/NaOAc gradient (IEC) [13] | None or Sodium hydroxide [13] |
The Critical Role of pH and Additives
pH Optimization for Analyte Retention and Selectivity
The pH of the mobile phase is a powerful tool for controlling retention and selectivity, particularly for ionizable compounds such as organic acids, amines, and many pharmaceuticals. The fundamental principle is to adjust the pH to suppress the ionization of acidic analytes (by using a pH at least 2 units below their pKa) or basic analytes (by using a pH at least 2 units above their pKa) to increase their retention on reversed-phase columns [84] [83]. For example, acidic compounds like benzoic acid (preservative) are best separated at low pH (2-3), while basic compounds like certain antibiotics require a neutral to high pH (7-10) for optimal retention and peak shape [84].
Strategic Use of Additives
Additives are incorporated into the mobile phase to achieve specific objectives:
Buffers: Maintain a stable pH throughout the analysis. Common choices include phosphate (pH 2-8), acetate (pH 3.8-5.8), and ammonium formate/carbonate (for MS compatibility) [80] [83]. The buffer concentration (typically 10-50 mM) must be sufficient to maintain capacity, and the buffer pH should be measured before adding the organic modifier [83].
Ion-Pairing Reagents: Amphiphilic ions such as trifluoroacetic acid (TFA) for bases or tetraalkylammonium salts for acids are used to form neutral pairs with ionic analytes, increasing their retention in reversed-phase systems [84] [83]. TFA is particularly common for peptide and protein separations [80].
Other Modifiers: Salts can influence ionization efficiency, while metal chelators like EDTA can prevent analyte binding to metal surfaces in the HPLC system, improving peak shapes [83].
Gradient Elution Optimization
Fundamentals and Application Scope
Gradient elution involves a programmed change in the mobile phase composition during the analytical run, typically by increasing the percentage of the strong solvent (e.g., acetonitrile in RPC) over time [84] [1]. This technique is indispensable for food analysis where samples contain components with a wide range of polarities and retention properties [13] [84]. It compresses later-eluting peaks, leading to narrower peak widths, higher signal-to-noise ratios, and shorter run times compared to isocratic methods for complex mixtures [84] [85].
Method Development Protocol
A systematic approach to developing a gradient method is outlined below.
Protocol 1: Scouting Gradient for Initial Method Development
- Column Selection: Begin with a common C18 column (e.g., 150 mm x 4.6 mm, 5 µm) suitable for a wide range of food analytes.
- Mobile Phase Preparation:
- Initial Scouting Run:
- Set a broad, linear gradient (e.g., 5% B to 95% B over 20-30 minutes).
- Use a moderate flow rate (e.g., 1.0 mL/min for a 4.6 mm ID column) and column temperature of 30-40°C.
- Inject the standard and sample solutions.
- Data Analysis: Examine the chromatogram to determine the "elution window" – the range of organic solvent % within which all analytes elute. Note any co-elutions.
Protocol 2: Fine-Tuning Gradient Slope and Profile
- Narrowing the Gradient Range: Adjust the initial and final %B to closely bracket the elution window identified in the scouting run. For instance, if analytes elute between 20% and 80% B, set the gradient from 15% B to 85% B.
- Optimizing Gradient Slope (Steepness):
- Incorporating Gradient Holds: Introduce isocratic holds at specific %B values to resolve co-eluting peaks. A multi-step gradient can be designed for highly complex samples [84].
- Re-equilibration: Ensure sufficient time (typically 5-10 column volumes) at the initial gradient conditions between runs for column re-equilibration and reproducible retention times [84].
The following workflow diagram illustrates the systematic process for optimizing the mobile phase and gradient elution method:
Figure 1: Mobile Phase and Gradient Optimization Workflow
Advanced Considerations for Food Analysis
Compatibility with Detection Methods
Mobile phase selection must consider the detection technique. For UV-Vis detection, solvents with low UV cutoffs (like acetonitrile) are preferred for low-wavelength work [80]. For mass spectrometry (LC-MS), volatile additives are essential; formic acid, acetic acid, and ammonium acetate or formate are standard, while non-volatile buffers (e.g., phosphate) must be avoided [83]. Charged Aerosol Detection (CAD) may require inverse gradient compensation to maintain a consistent solvent background [1].
Addressing Complex Food Matrices
Food samples often contain fats, proteins, carbohydrates, and pigments that can interfere with analysis. Sample preparation is crucial, but the mobile phase can also help manage matrix effects [13]. Using guard columns is highly recommended to protect the analytical column. For certain applications, such as the analysis of amino acids, amines, or vitamins, post-column derivatization (PCD) can enhance sensitivity and selectivity [81]. PCD involves reacting the eluted analytes with a reagent to form detectable derivatives (e.g., fluorescent or UV-absorbing compounds), which is particularly useful for compounds lacking strong chromophores [81].
The Scientist's Toolkit: Essential Reagents and Materials
Table 3: Key Research Reagent Solutions for HPLC Mobile Phase Preparation
| Reagent/Material | Function/Application | Notes for Use in Food Analysis |
|---|---|---|
| HPLC-Grade Water | Base solvent for aqueous mobile phases. | Must be ultra-pure (18.2 MΩ·cm); free from organics and particles to avoid baseline noise and column contamination [80]. |
| HPLC-Grade Acetonitrile | Primary organic modifier for RP-HPLC. | Preferred for UV (low cutoff) and MS (volatility) detection. Provides sharp peaks for pesticides, mycotoxins [80] [81]. |
| HPLC-Grade Methanol | Alternative organic modifier. | Different selectivity than ACN; useful for more polar compounds. Higher viscosity requires consideration of backpressure [80]. |
| Ammonium Formate | Volatile buffer salt for LC-MS. | Typical concentration 2-20 mM; pH adjust with formic acid. Ideal for sensitive MS analysis of antibiotics or veterinary drugs [83] [81]. |
| Trifluoroacetic Acid (TFA) | Ion-pairing reagent and pH modifier. | Excellent for peptide/protein separation (0.05-0.1%). Can cause ion suppression in MS and system corrosion [80] [83]. |
| Formic Acid | Volatile pH modifier for LC-MS. | Common concentration 0.1%. Used to suppress ionization of acids and protonate bases, improving retention and peak shape [80] [83]. |
| Phosphate Buffer Salts | Non-volatile buffer for UV detection. | Effective pH control in the 2-8 range. Must be avoided in LC-MS. Used in official methods for vitamins, additives [80] [81]. |
| Syringe Filters (0.45 µm/0.22 µm, Nylon or PVDF) | Filtration of mobile phases and samples. | Critical for removing particulate matter that can clog frits and damage columns, especially with complex food extracts [80] [83]. |
| In-line Degasser | Removal of dissolved gases from solvents. | Prevents baseline drift and air bubbles in the pump or detector, which is crucial for stable gradients and reproducible results [83] [1]. |
The optimization of the mobile phase—through deliberate selection of composition, precise control of pH, and strategic implementation of gradient elution—forms the cornerstone of robust and reliable HPLC method development for food analysis. The protocols and guidelines provided herein offer a systematic framework for researchers to tackle the challenges posed by complex food matrices and diverse analyte properties. By adhering to these principles and leveraging the detailed strategies for different chromatographic modes and detection systems, scientists can achieve separations with the resolution, sensitivity, and speed required for modern food safety, quality control, and research applications. The continued integration of these fundamentals with advanced techniques like UHPLC, 2D-LC, and post-column derivatization will further enhance the capabilities of HPLC in the comprehensive analysis of food components.
Within the broader context of developing robust HPLC and GC-MS methods for food component analysis, the precise control of Gas Chromatography (GC) parameters is fundamental for achieving accurate and reliable results. The analysis of complex food matrices, such as the sugar profiles in fermented beverages like Kombucha, demands meticulous method development [86]. Two of the most critical aspects influencing separation efficiency, sensitivity, and analysis time are temperature programming and carrier gas selection. This application note provides detailed protocols and structured data to guide researchers and scientists in optimizing these parameters for advanced food analysis research and drug development.
Temperature Programming for Enhanced Separations
Temperature programming is a mode of operation where the column oven temperature is increased during the analysis. This is crucial for separating complex mixtures containing analytes with a wide range of boiling points, as is common in food and pharmaceutical samples [87]. It offers significant advantages over isothermal analysis, including improved resolution of later-eluting peaks, reduced analysis time, and enhanced peak shape for higher-boiling compounds [88] [87].
Key Parameters and Optimization Strategy
Developing a robust temperature program involves systematic optimization of several interdependent parameters.
Table 1: Key Parameters for GC Temperature Program Optimization
| Parameter | Description | Optimization Guidance |
|---|---|---|
| Initial Temperature | The starting oven temperature [88]. | For split injection: Set 45°C below the elution temperature of the first peak [89] [90]. For splitless injection: Set 15-20°C below the solvent boiling point for effective solvent trapping [89] [88]. |
| Initial Hold Time | An optional isothermal period at the start [88]. | For split injection: Often avoided unless separating very volatile analytes; start with 30s if needed [89]. For splitless injection: Match to the splitless (purge) time of the injection, typically 30-90 seconds [88] [90]. |
| Ramp Rate | The rate of temperature increase (°C/min) [88]. | A excellent approximation is 10°C per column hold-up time (t₀) [89] [90]. Further optimize in ±5°C/min steps to resolve mid-chromatogram critical pairs [88]. |
| Mid-Ramp Hold | An isothermal hold inserted in the middle of a ramp. | Used to resolve poorly separated peak pairs. Set the hold temperature 45°C below the pair's elution temperature; start with a 1-5 minute hold [89] [90]. |
| Final Temperature | The maximum temperature of the program. | Set 20-30°C above the elution temperature of the last analyte of interest [89] [88]. A higher "burn" period may be needed to elute high-boiling matrix components. |
| Final Hold Time | The duration at the final temperature. | Typically 3-5 times the column dead time (t₀) to ensure elution of all components [90]. |
The following workflow outlines a systematic approach to developing and optimizing a temperature program:
Experimental Protocol: Developing a Temperature Program for Complex Mixtures
Application Context: This protocol is adapted from procedures used to screen and separate complex samples, such as pesticide residues in river water or compositional analysis of unknown mixtures [89] [90].
Materials and Reagents:
- GC System: Equipped with a programmable temperature oven and a suitable detector (e.g., FID, MS).
- Column: A standard non-polar or mid-polar capillary column (e.g., 5% Phenyl Methyl Silox, 30 m × 0.25 mm × 0.25 µm) [90].
- Carrier Gas: Helium or Hydrogen, set to a constant linear velocity.
- Samples: Standard solutions of target analytes in appropriate solvent.
Procedure:
- Scouting Run:
Isothermal or Programmed Analysis Decision:
- Measure the time window between the first and last analyte peaks.
- If the window is less than one-quarter of the total gradient time, isothermal analysis may be feasible. Calculate the approximate isothermal temperature (Tiso) as Tiso = Tfinal - 45°C, where Tfinal is the elution temperature of the last peak [89] [90].
- If the window is wider, proceed with temperature programming.
Optimize Initial Conditions:
- For a split injection, calculate the initial temperature: Tinitial = Tfirst_peak - 45°C. Avoid an initial hold unless necessary for very volatile analytes [89] [90].
- For a splitless injection, set T_initial to 15-20°C below the solvent boiling point (e.g., 44°C for methanol) and set an initial hold time equal to the splitless purge time (e.g., 30-90 s) [89] [88].
Optimize Ramp Rate and Mid-Ramp Holds:
Set Final Conditions:
Carrier Gas Selection for GC and GC-MS
The choice of carrier gas affects the efficiency, speed, and safety of a GC analysis. While helium has been the traditional choice, supply and cost issues have increased interest in hydrogen and nitrogen [91].
Table 2: Comparison of Common GC Carrier Gases
| Property | Hydrogen | Helium | Nitrogen |
|---|---|---|---|
| Optimum Linear Velocity | ~60 cm/s (Fastest) [91] | ~20-25 cm/s [91] | Slower than Helium [91] |
| Van Deemter Curve Profile | Shallow and wide - efficient over a broad velocity range [91] | Steeper than Hydrogen [91] | Very steep - efficiency drops sharply above optimum velocity [91] |
| Viscosity | Low (allows lower inlet pressures) [91] | Moderate | Similar to Helium [91] |
| Safety Considerations | Flammable (4-74% in air); requires sensors and safety measures [91] | Inert and safe | Inert and safe |
| Typical Purity Requirement | 99.9999% for carrier gas [91] | 99.999% | 99.999% |
| Key Advantage | Fastest analysis with maintained efficiency [91] | Inert, well-established | Low cost, reduced solvent tailing [92] |
| Key Disadvantage | Flammability, can reduce column lifetime [91] | Cost, supply instability | Low efficiency at higher velocities [91] |
Decision Framework and Safety Protocol for Hydrogen
The following diagram outlines the decision-making process for selecting a carrier gas, with particular emphasis on the safety protocols required for hydrogen use.
Experimental Consideration for Food/Pharma Analysis: When analyzing trace-level contaminants or components in complex matrices like food, the reduced solvent tailing associated with nitrogen carrier gas can be beneficial. It may enable the detection of highly volatile compounds that elute immediately after the solvent peak, a region often obscured by tailing [92].
Integrated Application in Food Analysis
The interplay of temperature programming and carrier gas selection is exemplified in a GC-MS method for analyzing sugars and sweeteners in Brazilian Kombucha, a complex fermented beverage [86].
Research Reagent Solutions for GC-MS Analysis of Sugars:
Table 3: Essential Reagents and Materials for Carbohydrate Derivatization in GC-MS
| Item | Function in Analysis |
|---|---|
| Rtx-5MS GC Column (5% Phenyl Methyl Silox) | Stationary phase for separating volatile derivatives of sugars and sweeteners [86]. |
| BSTFA with TMCS | Silylation reagent; replaces active hydrogens in sugars with trimethylsilyl groups, increasing volatility and thermal stability [86]. |
| Methoxyamine Hydrochloride | Used for the oximation step; reacts with reducing sugars (glucose, fructose) to prevent formation of multiple isomers, simplifying the chromatogram [86]. |
| Pyridine (Anhydrous) | Common solvent for derivatization reactions; must be anhydrous to prevent hydrolysis of silylation reagents [86]. |
| High-Purity Helium Carrier Gas | Mobile phase for GC-MS separation; purity is critical to protect the column stationary phase and ensure detector stability [86] [91]. |
Experimental Workflow:
- Sample Preparation: Kombucha samples are diluted and filtered.
- Derivatization: An oximation step is performed with methoxyamine in pyridine, followed by silylation with BSTFA(+TMCS) to make the sugars and sweeteners volatile for GC analysis [86].
- GC-MS Analysis:
- Carrier Gas: Helium at a constant flow rate of 1.0 mL/min [86].
- Temperature Program: An optimized program is used. For instance, an initial temperature suitable for the injection technique, followed by a controlled ramp to separate compounds like glucose, fructose, sucrose, and potential sweeteners like xylitol and sucralose within a defined runtime [86].
- Detection: Mass Spectrometry operated in Selected Ion Monitoring (SIM) mode provides high sensitivity and selectivity in complex food matrices [86].
Mastering temperature programming and making an informed carrier gas selection are indispensable skills for developing robust, efficient, and reliable GC methods. The systematic optimization strategies and comparative data provided in this note offer a clear pathway for researchers to enhance their analytical workflows. As the field advances, the integration of these foundational techniques with emerging technologies like AI-driven optimization and multidimensional separations will further push the boundaries of sensitivity and speed in food and pharmaceutical analysis [30].
Quality by Design (QbD) is a systematic, risk-based approach to development that begins with predefined objectives and emphasizes product and process understanding and process control [93]. In the context of analytical method development for food analysis, QbD moves the quality assurance paradigm from a reactive "Quality by Test" model to a proactive one where quality is built into the method from the outset [94]. This approach is based on sound science and quality risk management, ensuring that methods remain reliable throughout their lifecycle in regulated environments such as food safety and pharmaceutical development.
For researchers analyzing food components using HPLC and GC-MS, implementing QbD principles provides a structured framework for developing robust, reproducible methods that can withstand normal operational variations. The International Conference on Harmonization (ICH) guidelines Q8, Q9, Q10, and Q11 provide the foundation for QbD implementation, focusing on critical quality attributes, risk assessment, and design space establishment [94]. This systematic approach is equally valuable for food processing and biotherapeutics, where predicting quality and safety is paramount [95].
The Role of Robustness in Quality by Design
Defining Robustness and Ruggedness
In analytical QbD, robustness is defined as the measure of a method's capacity to remain unaffected by small, deliberate variations in method parameters listed in the documentation, providing an indication of its suitability and reliability during normal use [96]. For chromatographic methods, this includes variations in parameters such as mobile phase composition, pH, temperature, and flow rate. In contrast, ruggedness refers to the degree of reproducibility of test results obtained by analyzing the same samples under a variety of normal conditions, such as different laboratories, analysts, instruments, and reagent lots [96]. The key distinction is that robustness addresses internal method parameters specified in the procedure, while ruggedness deals with external factors related to the method's execution environment.
Robustness as a QbD Component
Robustness testing represents a critical element in the overall QbD framework for analytical methods. It provides assurance that methods will perform consistently when transferred between laboratories, equipment, or analysts [97]. Within QbD, robustness studies help define the method operational design space—the multidimensional combination and interaction of input variables demonstrated to provide assurance of quality [95]. Investing in robustness testing during method development saves significant time, energy, and expense later by identifying potential failure modes before method validation and transfer [96].
Systematic Protocol for QbD Implementation
Defining Analytical Target Profile and Critical Quality Attributes
The first step in implementing QbD for analytical methods is defining the Analytical Target Profile (ATP), which describes the intended purpose of the method and the performance criteria it must meet throughout its lifecycle. For food component analysis using HPLC or GC-MS, this includes defining the required specificity, accuracy, precision, range, and detection limits appropriate for the analytes and matrices involved [97]. From the ATP, researchers identify Critical Quality Attributes (CQAs)—the measurable characteristics that must be controlled within appropriate limits to ensure the method meets its ATP [95]. In chromatographic methods, CQAs typically include retention time, resolution, peak asymmetry, and signal-to-noise ratio.
Table 1: Key Elements of Analytical QbD Implementation
| QbD Element | Description | Application in HPLC/GC-MS Food Analysis |
|---|---|---|
| Analytical Target Profile (ATP) | Prospective summary of the analytical method's required performance characteristics | Defines required precision, accuracy, and sensitivity for detecting food components or contaminants |
| Critical Quality Attributes (CQAs) | Physical, chemical, or biological properties or characteristics that should be within appropriate limits | Chromatographic parameters: retention time, resolution, peak area precision, tailing factor |
| Critical Method Parameters (CMPs) | Input variables that significantly impact method CQAs | Mobile phase composition/pH, column temperature, flow rate, gradient profile, injection volume |
| Method Design Space | Multidimensional combination and interaction of CMPs demonstrated to provide assurance of quality | Established ranges for CMPs where method CQAs are consistently met |
| Control Strategy | Planned set of controls derived from method understanding that assures performance | System suitability tests, reference standards, calibration protocols, preventive maintenance |
Risk Assessment and Factor Selection
A thorough risk assessment is fundamental to QbD implementation. The Failure Mode and Effects Analysis (FMEA) tool systematically identifies potential failure modes, their causes, and effects on method performance [97]. The process begins with a method walk-through where developers and end-users collaboratively map each step of the analytical procedure. For HPLC methods analyzing food components, this includes sample preparation, extraction, chromatographic separation, detection, and data analysis.
A cause-and-effect diagram (fishbone or Ishikawa diagram) facilitates brainstorming of all potential factors that may influence method CQAs [97]. Factors are then categorized using the CNX classification: Controlled (fixed in the method), Noise (uncontrolled environmental variables), and eXperimental (factors to be studied for robustness) [97]. This classification prioritizes factors for subsequent experimental evaluation.
Experimental Designs for Robustness Evaluation
Full Factorial Designs
The full factorial design is the most comprehensive approach for robustness evaluation, measuring all possible combinations of factors at their specified levels. For k factors each at two levels (high and low), a full factorial design requires 2^k experiments [98]. This design provides complete information on all main effects and interaction effects between factors, which is particularly valuable in chromatography where parameter interactions are common rather than exceptional [98]. For example, in reversed-phase HPLC, the interaction between mobile phase pH and organic modifier concentration significantly impacts retention behavior for ionizable compounds.
The mathematical model for a two-level full factorial design with k factors is: [ Y = β0 + ΣβiXi + ΣΣβ{ij}XiXj + ... + ε ] Where Y is the response variable (e.g., retention time, resolution), β0 is the overall mean, βi are the main effect coefficients, β_{ij} are the two-factor interaction coefficients, and ε is the random error [98].
Table 2: Comparison of Experimental Designs for Robustness Testing
| Design Type | Number of Experiments | Factors Evaluated | Interactions Detectable | Best Use Cases |
|---|---|---|---|---|
| Full Factorial | 2^k | All main effects | All two-factor and higher | When number of factors is small (≤5) and interactions are expected |
| Fractional Factorial | 2^(k-p) | All main effects, but aliased with interactions | Partial, with confounding | Screening when factor number is medium (5-10) |
| Plackett-Burman | Multiples of 4 | Main effects only | None | Screening large number of factors (≥10) when only main effects are of interest |
| One-Factor-at-a-Time (OFAT) | k+1 | All main effects | None | Not recommended for robustness; fails to detect interactions |
Fractional Factorial and Plackett-Burman Designs
When evaluating more than five factors, fractional factorial designs provide an efficient alternative by carefully selecting a subset (fraction) of the full factorial combinations [96]. The degree of fractionation (2^-p) determines the number of runs and the resolution of the design, which indicates the degree of confounding between effects. Resolution V designs are preferred for robustness studies as they ensure that main effects are not confounded with two-factor interactions [96].
Plackett-Burman designs are highly economical screening designs useful when investigating large numbers of factors (≥10) where only main effects are of interest [99]. These designs require experiments in multiples of four rather than powers of two and are ideal for initial screening to identify the most influential factors from a large set of potential variables [96].
Case Study: Robustness Evaluation of an HPLC Method for Food Components
Experimental Setup
This case study demonstrates a robustness evaluation for an HPLC method determining valsartan in food-based nanoparticles using a full factorial design [100]. The factors investigated were flow rate, detection wavelength, and mobile phase pH, each evaluated at two levels with a center point for curvature detection.
Table 3: Factor Levels for HPLC Robustness Study
| Factor | Low Level (-1) | High Level (+1) | Center Point (0) | Units |
|---|---|---|---|---|
| Flow Rate | 0.9 | 1.1 | 1.0 | mL/min |
| Wavelength | 248 | 252 | 250 | nm |
| pH | 2.8 | 3.2 | 3.0 | - |
The experimental design matrix with measured responses (peak area, tailing factor, theoretical plates) is shown below. Experiments were performed in randomized order to minimize confounding with environmental factors [98].
Data Analysis and Interpretation
The effects of each factor and their interactions were calculated by comparing the average response at high levels with the average response at low levels [98]. For the retention time (Y), the effect of factor A is calculated as: [ EffectA = (Ȳ{A+} - Ȳ{A-}) ] Where Ȳ{A+} is the average of all responses when factor A is at its high level, and Ȳ_{A-} is the average when factor A is at its low level [98].
The results demonstrated that the quadratic effect of flow rate and wavelength individually and in interaction were most significant (p < 0.0001 and p < 0.0086, respectively) on peak area, while pH had the most significant effect (p < 0.0001) on tailing factor [100]. This analysis identified the optimal conditions as flow rate 1.0 mL/min, wavelength 250 nm, and pH 3.0, with method robustness validated within the studied ranges.
Advanced Applications and Current Technologies
QbD in Food Analysis
The implementation of QbD in food processing addresses the challenge of defining and predicting food quality, safety, and nutritional impact [95]. For complex food matrices, QbD provides a structured approach to method development that accounts for sample variability and matrix effects. Advanced technologies such as multidimensional chromatography (2D-LC, 2D-GC) have improved detection capabilities for contaminants down to 1 part per billion (ppb) in complex food samples [30]. These techniques benefit significantly from QbD principles during method development to manage the additional parameters and interactions introduced by the second dimension of separation.
Emerging Technologies and PAT
Process Analytical Technology (PAT) is an essential enabler of QbD in analytical methods, providing tools for real-time monitoring and control [94]. Recent advancements include wide line surface-enhanced Raman scattering (WL-SERS) with dramatically increased sensitivity for detecting contaminants like melamine in raw milk, and mass spectrometry imaging (MSI) with improved spatial resolution for mapping nutrients and contaminants within food products [30]. Miniaturized LC instruments reduce environmental impact while maintaining analytical performance, supporting more sustainable analytical practices [30].
Artificial intelligence and machine learning, particularly convolutional neural networks (CNNs), are increasingly applied to automate image and spectral data analysis in food adulteration detection, reducing human interpretation and increasing throughput [30]. These technologies integrate with QbD by providing sophisticated modeling capabilities for establishing design spaces and control strategies.
The Scientist's Toolkit: Essential Research Reagent Solutions
Table 4: Essential Materials and Reagents for QbD-Based Method Development
| Item | Function | Application Notes |
|---|---|---|
| pH-Buffered Mobile Phases | Control ionization state of analytes; ensure retention time reproducibility | Critical for analyzing ionizable compounds; pH ±0.1 units typically required |
| High-Purity Organic Modifiers | Mobile phase component; affects retention and selectivity | Acetonitrile, methanol of HPLC grade; lot-to-light variability should be assessed |
| Certified Reference Standards | System suitability testing; method qualification and validation | Establish performance baselines; monitor method control over time |
| Characterized Column Lots | Stationary phase; primary driver of separation | Test multiple lots during robustness studies; document column characteristics |
| Matrix-Matched Calibrators | Account for matrix effects in quantitative analysis | Essential for complex food matrices; improves accuracy and precision |
Workflow and Signaling Pathways
The following diagram illustrates the complete QbD workflow for analytical method development, incorporating robustness testing as an integral component:
QbD Methodology Workflow
The integration of Quality by Design principles with structured experimental designs for robustness testing represents a paradigm shift in analytical method development for food component analysis. This systematic approach moves beyond the traditional one-factor-at-a-time methodology to provide comprehensive method understanding, enabling robust performance throughout the method lifecycle. For researchers working with HPLC and GC-MS methods, implementing QbD with factorial designs not only ensures regulatory compliance but also enhances method reliability, transferability, and overall efficiency in food analysis laboratories.
Addressing Matrix Effects and Improving Recovery in Complex Food Samples
In the analysis of food components using High-Performance Liquid Chromatography (HPLC) and Gas Chromatography-Mass Spectrometry (GC-MS), the sample matrix—defined as all components of the sample other than the analyte—presents a significant analytical challenge [101] [102]. Matrix effects occur when co-extracted compounds alter the detector response for the target analyte, leading to either signal suppression or enhancement and compromising the accuracy and reliability of quantitative results [101] [102]. In food analysis, where matrices range from high-sugar fruits to high-fat animal products, these effects are particularly pronounced due to the vast diversity of co-extracted compounds [52] [102].
The fundamental problem stems from the matrix influencing the detection process. In mass spectrometry, matrix components can compete for available charge during ionization, leading to ionization suppression or enhancement [101]. Similarly, in UV/Vis detection, solvatochromic effects can alter analyte absorptivity, while in fluorescence detection, quenching phenomena may occur [101]. Overcoming these challenges requires a systematic approach to assess, quantify, and mitigate matrix effects while ensuring efficient recovery of target analytes from complex food matrices.
Understanding and Quantifying Matrix Effects
Matrix effects manifest differently across detection techniques and food commodity types. The chemical composition of the food matrix directly influences the nature and magnitude of these effects [52] [102].
Table 1: Common Matrix Effects by Detection Technique
| Detection Technique | Type of Matrix Effect | Mechanism | Common in Food Matrices |
|---|---|---|---|
| ESI-MS (Electrospray Ionization Mass Spectrometry) | Ionization Suppression/Enhancement | Competition for available charge in the ESI droplet [101] | Universal, but particularly severe in high-fat and high-protein samples [52] |
| GC-MS (Gas Chromatography-Mass Spectrometry) | Matrix-Induced Signal Enhancement | Active sites in the inlet/column are deactivated by matrix components, reducing analyte adsorption [102] | High-fat foods, complex plant materials [52] [102] |
| UV/Vis Absorbance Detection | Solvatochromism | Changes in the solvent environment affect the absorptivity of the analyte [101] | Pigmented samples (e.g., carotenoid-rich foods, chlorophyll-containing plants) [33] |
| Fluorescence Detection | Fluorescence Quenching | Matrix components reduce the quantum yield of fluorescence [101] | Samples with inherent fluorophores or quenchers |
Table 2: Matrix Effect Variation Across Food Types
| Food Matrix Type | Example Commodities | Predominant Matrix Effect | Key Challenging Components |
|---|---|---|---|
| High Water Content | Apples, grapes, lettuce [51] [52] | Often signal enhancement in GC-MS [51] | Sugars, organic acids, water-soluble pigments |
| High Fat Content | Edible oils, animal fats, fatty fish [52] | Signal suppression in LC-MS; enhancement in GC-MS [52] [102] | Triglycerides, phospholipids, fatty acids |
| High Protein Content | Meat, dairy products, offal [52] | Ion suppression in LC-MS/MS [52] | Proteins, peptides, amino acids |
| High Starch/Low Water | Spelt kernels, grains [51] | Signal suppression in GC-MS/MS [51] | Polysaccharides, fibers |
| Pigmented Samples | Tomatoes, leafy greens, strawberries [33] | Varied (depends on detection method) | Chlorophyll, anthocyanins, carotenoids |
Experimental Protocol for Determining Matrix Effects
Objective: To quantitatively determine the magnitude of matrix effects (signal suppression or enhancement) for target analytes in a specific food matrix.
Principle: This protocol uses the post-extraction addition method to compare the detector response for analytes in a pure solvent versus the response for the same analytes spiked into a extracted sample matrix [102]. This isolates the effect of the matrix on the detection step, independent of extraction efficiency.
Materials and Reagents:
- Representative blank food matrix (confirmed to be free of target analytes)
- Target analyte stock standard solution
- Appropriate HPLC- or GC-grade solvents for standards and mobile phase
- Sample preparation equipment (homogenizer, centrifuge, vortex mixer)
- All reagents for your standard sample extraction (e.g., QuEChERS salts, extraction solvents, SPE cartridges)
- HPLC or GC-MS system
Procedure:
- Sample Extraction: Prepare at least five (n=5) replicate samples of the homogenized blank food matrix using your validated extraction and clean-up method (e.g., QuEChERS, SPE) [102]. The final extract should be in a solvent compatible with your chromatographic system.
- Standard Preparation:
- Solvent Standards: Prepare a set of calibration standards in pure solvent at concentrations covering your working range. For a single-point estimate, one mid-level concentration standard is sufficient [102].
- Matrix-Matched Standards: Spike the same known amount of analyte (the same concentration as used in the solvent standards) into the final extracted blank matrix extracts from Step 1 [102].
- Instrumental Analysis: Analyze the solvent standards and the matrix-matched standards in a single, randomized sequence under identical chromatographic and detection conditions.
- Data Analysis: Calculate the Matrix Effect (ME) for each analyte.
Interpretation: An ME value of 0% indicates no matrix effect. Negative values indicate signal suppression, and positive values indicate signal enhancement. Best practice guidelines, such as the SANTE guidelines, recommend implementing compensation strategies if matrix effects exceed ±20% [102].
Figure 1: Experimental workflow for determining matrix effects using the post-extraction addition method.
Strategies for Mitigation and Improved Recovery
Sample Preparation Techniques for Complex Matrices
The first line of defense against matrix effects is a selective and efficient sample preparation protocol. The choice of method depends on the physicochemical properties of the analyte and the complexity of the food matrix [103] [33].
QuEChERS (Quick, Easy, Cheap, Effective, Rugged, and Safe): This two-step method (extraction and dispersive-SPE clean-up) is highly effective for multi-residue analysis in a variety of food matrices [33] [52]. It can be customized by selecting different dSPE sorbents to remove specific matrix interferences. For pigmented samples, graphitized carbon black (GCB) is added to remove chlorophyll and carotenoids [33]. For acidic matrices, primary secondary amine (PSA) is used to remove fatty acids and sugars [33].
Solid-Phase Extraction (SPE): SPE offers high selectivity and is highly customizable based on the retention mechanism (e.g., reversed-phase, ion-exchange) [103] [33]. It is ideal for isolating analytes from complex matrices like fats and oils. Method development is crucial and involves selecting the correct sorbent, conditioning solvent, sample loading solvent, wash solvent, and elution solvent [33]. A systematic approach to SPE method development is outlined in Figure 2.
Supported Liquid Extraction (SLE): SLE provides the selectivity of liquid-liquid extraction (LLE) but eliminates emulsion formation and is amenable to automation [33]. It is particularly suitable for aqueous samples (e.g., fruit juices, coffee, tea). The ease of extraction solvent screening allows for rapid method development to minimize matrix effects [33].
Dilution: A simple but effective strategy, particularly for samples with high analyte concentration. Dilution reduces the concentration of both the analyte and the interfering matrix components in the final extract, thereby diminishing their impact on ionization [102].
The Internal Standard Method
The use of a suitable internal standard (IS) is one of the most potent ways to compensate for matrix effects, as well as for losses during sample preparation and instrument variability [101].
Protocol for Internal Standard Quantitation:
- Selection: Choose an internal standard that is structurally similar to the target analyte but chromatographically resolvable. The ideal IS is a stable isotope-labeled version of the analyte (e.g., ¹³C- or ²H-labeled), as it will have nearly identical chemical properties and co-elute with the analyte, experiencing the same matrix effects [101].
- Addition: Add a known, consistent amount of the internal standard to every sample, calibration standard, and quality control sample before the sample preparation begins [101].
- Calibration and Quantitation: Construct the calibration curve using the peak area ratio (analyte area / IS area) plotted against the concentration ratio (analyte concentration / IS concentration) [101]. The response of the IS automatically corrects for fluctuations in signal caused by the matrix.
Chromatographic and Instrumental Solutions
Improving the chromatographic separation to resolve the analyte from co-eluting matrix interferences is a fundamental solution. This can be achieved by optimizing the mobile phase gradient, using a longer or more selective analytical column, or employing UPLC systems for higher peak capacity [52].
For mass spectrometric detection, switching the ionization mode (e.g., from ESI to APCI) can sometimes reduce matrix effects, as APCI is generally less susceptible to ionization suppression [101]. Furthermore, the use of high-resolution mass spectrometry (HRMS) coupled with techniques like ion mobility spectrometry (IMS) provides an additional dimension of separation, helping to resolve isobaric and isomeric interferences that contribute to matrix effects [52].
Figure 2: Decision pathway for selecting matrix effect mitigation strategies.
The Scientist's Toolkit: Essential Reagents and Materials
Table 3: Key Research Reagent Solutions for Addressing Matrix Effects
| Item | Function/Purpose | Application Example |
|---|---|---|
| Stable Isotope-Labeled Internal Standards (e.g., ¹³C, ²H) | Compensates for matrix effects and analyte losses during preparation; provides highest accuracy for LC-MS/MS and GC-MS [101]. | Quantification of pesticides, mycotoxins, or veterinary drug residues in complex food matrices. |
| QuEChERS Kits (EN, AOAC, or custom formats) | Provides a standardized, efficient method for extraction and clean-up of diverse food samples [33] [52]. | Multi-residue pesticide analysis in fruits, vegetables, and grains. |
| dSPE Sorbents (PSA, C18, GCB, MgSO₄) | Used in QuEChERS clean-up to remove specific matrix interferences: PSA for sugars and fatty acids, C18 for lipids, GCB for pigments [33]. | Using GCB to remove chlorophyll from leafy green vegetable extracts. |
| Solid-Phase Extraction (SPE) Cartridges (C18, Silica, Ion-Exchange, Polymer) | Selective extraction and clean-up; highly customizable for specific analyte-matrix combinations [103] [33]. | Purification of analytes from high-fat matrices like edible oils or animal tissues. |
| Supported Liquid Extraction (SLE) Plates/Tubes | Provides the selectivity of LLE without emulsions; ideal for automated, high-throughput processing of aqueous samples [33]. | Extraction of antibiotics from honey or fruit juices. |
| HPLC-Grade Solvents & High-Purity Reagents | Minimizes background noise and contamination, which can exacerbate detection issues and cause ghost peaks [104]. | Essential for all mobile phase and sample preparation steps. |
| Syringe Filters (0.2 µm or 0.45 µm, Nylon, PES) | Removes particulate matter from final extracts to prevent HPLC system clogging and column damage [103] [104]. | Final filtration of any sample extract prior to HPLC/GC-MS injection. |
Matrix effects are an inescapable challenge in the HPLC and GC-MS analysis of complex food samples, but they can be systematically managed. The path to reliable quantitation begins with acknowledging the problem and rigorously assessing the magnitude of matrix effects using standardized protocols. A combination of strategic sample preparation (e.g., selective SPE, modified QuEChERS), the judicious use of stable isotope-labeled internal standards, and chromatographic optimization forms a robust defense. As the field moves towards exposomics and non-targeted analysis, the principles outlined in these application notes will remain foundational for ensuring data accuracy, supporting robust dietary risk assessments, and advancing public health science.
Ensuring Data Integrity: Method Validation and HPLC vs. GC-MS Comparative Analysis
In the analytical sciences, particularly in the analysis of food components using High-Performance Liquid Chromatography (HPLC) and Gas Chromatography-Mass Spectrometry (GC-MS), the reliability of data is paramount. Method validation provides documented evidence that an analytical procedure is suitable for its intended purpose, ensuring that measurements are trustworthy, reproducible, and defensible [105]. For researchers and scientists in drug and food development, adherence to validated methods is not merely good scientific practice but is often a regulatory requirement [106]. This article details the core validation parameters—Accuracy, Precision, Limit of Detection (LOD), Limit of Quantitation (LOQ), Linearity, and Range—within the context of HPLC and GC-MS methods for food analysis. These parameters form the foundation for demonstrating that an analytical method consistently produces results that accurately represent the composition of the sample under study.
Core Validation Parameters: Definitions and Protocols
Accuracy
Definition: Accuracy expresses the closeness of agreement between the measured value obtained from a series of test results and the true value (or an accepted reference value) [106]. It is sometimes referred to as "trueness" and is typically reported as a percentage recovery of the known, added amount [105].
Experimental Protocol for HPLC/GC-MS Food Analysis: The accuracy of a method for quantifying a food component (e.g., an additive or contaminant) is determined through recovery studies. A known quantity of the pure analyte standard is added to a blank or placebo sample matrix (e.g., a powdered drink mix without the target analytes) [107] [108].
- Preparation: Prepare a minimum of nine samples over at least three concentration levels (e.g., 80%, 100%, and 120% of the target concentration) with three replicates at each level [105] [108].
- Analysis: Analyze the spiked samples using the developed HPLC or GC-MS method.
- Calculation: Calculate the percentage recovery for each sample using the formula:
Precision
Definition: Precision is the degree of agreement among individual test results when the procedure is applied repeatedly to multiple samplings of a homogeneous sample. It is usually expressed as the relative standard deviation (RSD) or coefficient of variation (CV) and is investigated at three levels: repeatability, intermediate precision, and reproducibility [105].
Experimental Protocol for HPLC/GC-MS Food Analysis:
- Repeatability (Intra-assay Precision):
- Under the same operating conditions (same analyst, same instrument, same day), analyze a minimum of six determinations at 100% of the test concentration or nine determinations covering the specified range (e.g., three concentrations with three replicates each) [105].
- Calculate the RSD (%) of the measured concentrations. For a method to be considered precise, the RSD for repeatability is typically expected to be below 2% [109].
- Intermediate Precision:
- This assesses the impact of random variations within a laboratory, such as different days, different analysts, or different instruments. An experimental design is used where, for example, a second analyst prepares and analyzes replicate sample preparations on a different HPLC or GC-MS system [105].
- The results from the two analysts are compared, and the %-difference in the mean values is calculated. Statistical tests (e.g., Student's t-test) can be used to examine any significant difference. The RSD for intermediate precision is typically expected to be below 3% [109].
Limit of Detection (LOD) and Limit of Quantitation (LOQ)
Definition: The LOD is the lowest concentration of an analyte in a sample that can be detected, but not necessarily quantified, under the stated experimental conditions. The LOQ is the lowest concentration that can be quantified with acceptable precision and accuracy [105].
Experimental Protocol for HPLC/GC-MS Food Analysis: The most common approach for chromatographic methods is based on the signal-to-noise ratio (S/N).
- Signal-to-Noise Method:
- Prepare and analyze samples with known, low concentrations of the analyte.
- The LOD is generally determined as the concentration that yields a S/N ratio of 3:1.
- The LOQ is the concentration that yields a S/N ratio of 10:1 and can also be validated by demonstrating a precision of <10% RSD and acceptable accuracy at that level through triplicate analysis [110] [108].
- Standard Deviation Method:
- LOD and LOQ can also be calculated based on the standard deviation of the response (SD) and the slope of the calibration curve (S) using the formulae:
- LOD = 3.3 × (SD / S)
- LOQ = 10 × (SD / S) [105]
- It is critical to note that LOD/LOQ values are subject to significant experimental uncertainty (up to 33-50% at the LOD) and should be reported to only one significant digit [110].
- LOD and LOQ can also be calculated based on the standard deviation of the response (SD) and the slope of the calibration curve (S) using the formulae:
Linearity and Range
Definition: Linearity is the ability of a method to elicit test results that are directly proportional to the concentration of the analyte. The range is the interval between the upper and lower concentrations of analyte for which it has been demonstrated that the method has suitable levels of linearity, accuracy, and precision [105] [106].
Experimental Protocol for HPLC/GC-MS Food Analysis:
- Linearity:
- Prepare a minimum of five standard solutions at different concentration levels across the anticipated range [105]. For example, in a study analyzing food additives, concentrations of 0.5 to 50 mg L⁻¹ were used [107].
- Analyze each concentration level, plot the analyte response (e.g., peak area) against the concentration, and perform linear regression analysis.
- Report the coefficient of determination (r²), the equation of the calibration line, and the residuals. A correlation coefficient (r) of ≥ 0.999 is often the acceptance criterion for linearity [109].
- Range:
- The range is established by demonstrating that the method provides acceptable linearity, accuracy, and precision at the extremes of the specified interval. The minimum specified range depends on the type of method; for an assay of a drug product, a typical range is 80-120% of the target concentration [105].
Table 1: Summary of Validation Parameters, Protocols, and Acceptance Criteria
| Parameter | Experimental Protocol Summary | Typical Acceptance Criteria |
|---|---|---|
| Accuracy | Recovery studies using spiked placebo at 3 levels (3 reps each) [105] [108]. | Recovery of 95-101% [107] [109]. |
| Precision | Repeatability: 6+ replicates at 100% [105].Intermediate Precision: 2 analysts/systems/days [105]. | Repeatability RSD < 2% [109].Intermediate Precision RSD < 3% [109]. |
| LOD | Signal-to-noise ratio of 3:1 or based on calibration curve standard deviation [105] [110]. | S/N ≥ 3 [108]. |
| LOQ | Signal-to-noise ratio of 10:1 with precision and accuracy confirmation [105] [108]. | S/N ≥ 10; RSD < 10% [108]. |
| Linearity | Minimum of 5 concentration levels analyzed [105]. | Correlation coefficient (r) ≥ 0.999 [109]. |
| Range | Demonstrated from the LOQ to the upper limit where linearity, accuracy, and precision hold [105]. | Established based on the intended application of the method (e.g., 80-120% for assay) [105]. |
Application in Food Analysis: Workflow & Reagents
The following workflow diagrams the typical process of developing and validating an HPLC or GC-MS method for food component analysis, incorporating the core validation parameters.
Figure 1: Analytical Method Validation Workflow
Table 2: Essential Research Reagent Solutions for HPLC/GC-MS Food Analysis
| Reagent / Material | Function in Analysis | Example from Literature |
|---|---|---|
| HPLC-Grade Methanol/Acetonitrile | Organic mobile phase components in reverse-phase HPLC for eluting analytes from the column. | Used in mobile phase for analyzing food additives in powdered drinks [107] and pediatric oral powder [108]. |
| Buffer Salts (e.g., Phosphate, Acetate) | Adjusts and stabilizes the pH of the aqueous mobile phase, critical for reproducible retention times and peak shape. | Phosphate buffer used in the analysis of seven food additives and caffeine [107]. |
| Ion-Pairing Reagents (e.g., Tetrabutylammonium sulfate) | Enhances the separation of ionic compounds in reverse-phase HPLC by pairing with the analyte ions. | Used for the separation of potassium guaiacolsulfonate and sodium benzoate [108]. |
| High-Purity Analytical Standards | Used to prepare calibration standards and spiked samples for validation of accuracy, linearity, LOD, and LOQ. | Certified reference standards of acesulfame potassium, benzoic acid, etc., used for method validation [107] [111]. |
| Internal Standards (e.g., Deuterated Compounds) | Added in equal amount to all standards and samples to correct for variability in injection volume and instrument response. | 1,4-dichlorobenzene-d4, naphthalene-d8 used in GC-MS pesticide analysis [112]. |
The rigorous validation of analytical methods is a non-negotiable pillar of scientific integrity in food and pharmaceutical research. A thorough understanding and systematic application of the parameters—Accuracy, Precision, LOD, LOQ, Linearity, and Range—ensures that HPLC and GC-MS methods generate data that are reliable, reproducible, and fit for their intended purpose. As demonstrated through various applications, from quantifying sweeteners in powdered drinks to detecting adulterants in dietary supplements, a well-validated method is the key to ensuring product safety, quality, and regulatory compliance. By following the structured protocols and workflows outlined in this article, researchers and scientists can confidently develop and implement robust analytical methods that stand up to scientific and regulatory scrutiny.
In the field of food component analysis, the reliability of data generated by High-Performance Liquid Chromatography (HPLC) and Gas Chromatography-Mass Spectrometry (GC-MS) is paramount. International standards provide the foundational framework that ensures analytical methods are accurate, precise, and reproducible. The International Organization for Standardization (ISO), AOAC INTERNATIONAL, and the International Council for Harmonisation (ICH) have established comprehensive guidelines that govern the development, validation, and application of chromatographic methods in research and quality control settings. Adherence to these standards is not merely a regulatory formality; it is a critical component of scientific rigor that bolsters the credibility of research findings and facilitates the global acceptance of data [113] [114].
The interplay between these organizations creates a robust system for quality assurance. ISO standards, such as ISO/IEC 17025 for laboratory competence, set the general requirements for quality management and technical competence [114]. AOAC INTERNATIONAL provides standard method performance requirements and validated methods for food safety and composition analysis, often serving as the benchmark for official methods [114]. The ICH, though primarily focused on pharmaceuticals, provides deeply influential guidelines like ICH Q2(R1) for analytical method validation, whose principles are extensively applied in food analytical method development [105] [114]. For scientists working at the intersection of food and pharmaceutical analysis, such as in the development of nutraceuticals, understanding the harmonization and specific applications of these guidelines is essential for ensuring data integrity across disciplines.
Core Principles of Method Validation
Method validation is the process of demonstrating that an analytical procedure is suitable for its intended purpose. It provides documented evidence that the method consistently meets predefined acceptance criteria for key performance characteristics. The ICH Q2(R1) guideline, "Validation of Analytical Procedures: Text and Methodology," categorizes these characteristics based on the type of analytical procedure (identification, assay, impurity testing) [105].
Key Validation Characteristics
Accuracy: This measures the closeness of agreement between a conventionally accepted true value and the value found. According to ICH guidelines, accuracy should be established across the specified range of the method, typically using a minimum of nine determinations over a minimum of three concentration levels. For drug substances, accuracy is often assessed by comparison to a standard reference material, while for drug products, it is evaluated by analyzing synthetic mixtures spiked with known quantities of components [105].
Precision: Precision expresses the closeness of agreement between a series of measurements obtained from multiple sampling of the same homogeneous sample under prescribed conditions. It is considered at three levels:
- Repeatability (intra-assay precision): Assesses precision under the same operating conditions over a short time interval. It requires a minimum of nine determinations or six determinations at 100% of the test concentration [105].
- Intermediate Precision: Evaluates the effects of random events within the same laboratory, such as different days, analysts, or equipment. The results are typically subjected to statistical tests (e.g., Student's t-test) to examine differences in mean values [105].
- Reproducibility: Represents the precision between different laboratories, as assessed in collaborative studies [105].
Specificity: Specificity is the ability to assess unequivocally the analyte in the presence of other components, such as impurities, degradants, or matrix components. In chromatographic methods, specificity is demonstrated by the resolution of the two most closely eluted compounds, often supported by peak purity tests using photodiode-array (PDA) or mass spectrometry (MS) detection [105].
Linearity and Range: Linearity is the ability of the method to obtain test results that are directly proportional to analyte concentration. The range is the interval between the upper and lower concentrations for which linearity, accuracy, and precision have been demonstrated. ICH guidelines specify that a minimum of five concentration levels is required to establish linearity [105].
Limit of Detection (LOD) and Limit of Quantitation (LOQ): The LOD is the lowest concentration of an analyte that can be detected, while the LOQ is the lowest concentration that can be quantified with acceptable precision and accuracy. These are commonly determined via signal-to-noise ratios (typically 3:1 for LOD and 10:1 for LOQ) or based on the standard deviation of the response and the slope of the calibration curve [105].
Robustness: The robustness of an analytical procedure is a measure of its capacity to remain unaffected by small, deliberate variations in method parameters (e.g., mobile phase pH, temperature, flow rate) and provides an indication of its reliability during normal usage [105].
Table 1: Summary of ICH Q2(R1) Analytical Performance Characteristics [105]
| Characteristic | Definition | Typical Validation Protocol |
|---|---|---|
| Accuracy | Closeness of agreement between accepted true value and value found. | Minimum 9 determinations over 3 concentration levels. |
| Precision | Closeness of agreement between a series of measurements. | Repeatability: 6-9 determinations; Intermediate precision: varied conditions. |
| Specificity | Ability to measure analyte unequivocally in the presence of potential interferents. | Resolution of closely eluting peaks; peak purity via PDA or MS. |
| Linearity | Ability to obtain results directly proportional to analyte concentration. | Minimum of 5 concentration levels. |
| Range | Interval between upper and lower concentrations with demonstrated linearity, accuracy, and precision. | Defined by the linearity and precision studies. |
| LOD/LOQ | Lowest concentration that can be detected/quantified. | Signal-to-noise (3:1 & 10:1) or based on SD of response and slope. |
| Robustness | Capacity to remain unaffected by small, deliberate parameter variations. | Experimental variation of parameters (e.g., pH, temperature). |
Detailed Experimental Protocols
Protocol 1: HPLC-DAD Method Development and Validation for Organic Acids
This protocol outlines the development and validation of an HPLC method with Diode-Array Detection (DAD) for the simultaneous determination of seven organic acids (tartaric, malic, lactic, acetic, citric, succinic, and fumaric acids) in processed food products, in accordance with ICH and AOAC guidelines [114].
1. Reagents and Materials
- Organic Acid Standards: High-purity (≥95-99.7%) reference standards for all seven target organic acids.
- Mobile Phase: A mixture of 20 mM ammonium formate (pH 2.5, adjusted with formic acid) and methanol in a ratio of 98:2 (v/v).
- Solvents: HPLC-grade water and methanol.
- Equipment: HPLC system equipped with a quaternary pump, autosampler, column oven, and DAD. A reversed-phase C18 column (e.g., 250 mm x 4.6 mm, 5 µm) is used for separation [114].
2. Sample Preparation
- Weigh 2.0 g of a homogenized food sample into a 50 mL centrifuge tube.
- Add 20 mL of a 50% methanol solution.
- Vortex the mixture for 1 minute and then sonicate for 15 minutes.
- Centrifuge at 4,000 rpm for 10 minutes.
- Filter the supernatant through a 0.45 µm membrane filter into an HPLC vial [114].
3. Chromatographic Conditions
- Column Temperature: 35°C
- Flow Rate: 0.8 mL/min
- Injection Volume: 10 µL
- Detection Wavelength: 210 nm
- Run Time: 15 minutes [114]
4. Method Validation Steps
- Selectivity: Inject a blank, a standard solution, and a sample. Confirm that there is no interference at the retention times of the target organic acids.
- Linearity: Prepare standard solutions at a minimum of five concentration levels across the expected range. Inject each in triplicate. The coefficient of determination (R²) should be ≥ 0.99.
- Accuracy (Recovery): Spike blank samples with known concentrations of organic acids at three levels (low, medium, high). Analyze six replicates at each level. Calculate the mean recovery percentage, which should typically be between 90-110%.
- Precision: Assess repeatability (intra-day) by analyzing six spiked samples on the same day. Assess intermediate precision (inter-day) by having a second analyst repeat the analysis on a different day. The relative standard deviation (RSD) should be ≤ 5% for repeatability.
- LOD and LOQ: Based on a signal-to-noise ratio of 3:1 for LOD and 10:1 for LOQ [114].
Protocol 2: GC-MS Analysis for Pesticide Residues in Food
This protocol describes a fast GC-MS method for the targeted analysis of pesticide residues in complex food matrices like vegetables, utilizing a triple quadrupole mass spectrometer for high selectivity and sensitivity [7].
1. Reagents and Materials
- Pesticide Standards: Certified reference materials for all target pesticides.
- Sample Preparation: QuEChERS (Quick, Easy, Cheap, Effective, Rugged, and Safe) extraction kits.
- GC Column: A 5% phenyl mega-bore capillary column (10 m x 0.53 mm i.d., 1 µm film thickness).
- Equipment: GC system coupled to a triple quadrupole mass spectrometer (GC-MS/MS) [7].
2. Sample Preparation (QuEChERS)
- Weigh 10 g of homogenized sample into a 50 mL centrifuge tube.
- Add 10 mL of acetonitrile and shake vigorously for 1 minute.
- Add a salt mixture (e.g., containing MgSO4, NaCl) and shake immediately.
- Centrifuge for 5 minutes.
- Transfer an aliquot of the supernatant to a dispersive-SPE tube for clean-up.
- Vortex and centrifuge, then transfer the final extract to a GC vial [7].
3. GC-MS/MS Conditions
- Injection: PTV injector in solvent vent mode.
- Carrier Gas: Helium at a constant flow.
- Oven Program: Fast temperature ramp to achieve a total run time of under 11 minutes.
- Ionization Mode: Electron Ionization (EI).
- Analysis Mode: Multiple Reaction Monitoring (MRM). Two specific ion transitions are monitored for each pesticide—the most intense for quantification and a second for confirmation [7].
4. Method Validation
- Selectivity: Achieved by monitoring specific MRM transitions unique to each pesticide.
- Linearity: Calibration curves are constructed using matrix-matched standards to compensate for matrix effects.
- Accuracy and Precision: Determined by spiking blank samples with pesticides at known concentrations and analyzing replicates. Acceptance criteria follow relevant AOAC guidelines for pesticide analysis.
- Sensitivity: The Limit of Quantification (LOQ) is validated at levels sufficient to meet regulatory requirements, often as low as 0.01 mg/kg [7].
Research Reagent Solutions and Materials
The reliability of analytical data is contingent upon the quality and appropriateness of the reagents and materials used. The following table details essential items for HPLC and GC-MS workflows in food analysis.
Table 2: Essential Research Reagents and Materials for Food Component Analysis [115] [114] [7]
| Item | Function/Application | Key Considerations |
|---|---|---|
| HPLC-grade Solvents (e.g., Methanol, Acetonitrile) | Mobile phase components for HPLC. | Low UV absorbance; minimal particle content to prevent column damage and baseline noise. |
| Certified Reference Standards | Used for calibration, identification, and quantification of target analytes. | Traceable purity and certification are critical for accurate and defensible results. |
| Buffering Salts (e.g., Ammonium Formate) | Modifies mobile phase pH to control analyte ionization and retention. | High purity; volatile salts are preferred for LC-MS compatibility. |
| QuEChERS Kits | Sample preparation for pesticide and contaminant analysis in food. | Standardized kits ensure consistent extraction efficiency and clean-up. |
| GC Capillary Columns | Separation of volatile compounds. | Select phase (e.g., 5% phenyl) based on analyte polarity and required selectivity. |
| Derivatization Reagents | Chemically modifies non-volatile analytes to make them amenable to GC analysis. | Reagent purity and reaction yield directly impact method sensitivity. |
Green Analytical Chemistry and Sustainability
The principles of Green Analytical Chemistry (GAC) are increasingly integrated into modern laboratories, aiming to reduce the environmental impact of analytical methods without compromising performance. The twelve principles of GAC provide a framework for developing more sustainable methods, advocating for the reduction or replacement of hazardous substances, minimization of energy consumption, and reduction of waste [116].
In the context of HPLC, this involves several strategic approaches:
- Alternative Solvent Systems: Replacing toxic solvents like acetonitrile with safer alternatives, such as ethanol or water-based mobile phases, where feasible [116].
- Miniaturization: The use of micro-HPLC or columns with smaller internal diameters reduces mobile phase consumption and waste generation significantly [116].
- Energy-Efficient Instrumentation: Utilizing instrumentation designed for lower energy consumption and optimizing methods to shorten run times [116].
Tools like the Analytical Eco-Scale, Green Analytical Procedure Index (GAPI), and the AGREE metric have been developed to quantitatively or semi-quantitatively evaluate the environmental friendliness of analytical methods, allowing scientists to benchmark and improve their practices [116]. For instance, a simple greening step in HPLC involves using a methanol-water mobile phase instead of acetonitrile-water, as methanol has a better environmental, health, and safety profile and is often more cost-effective.
Workflow and Signaling Pathways
The following diagram illustrates the integrated workflow for developing and validating an analytical method according to international standards, incorporating green chemistry principles.
Diagram 1: Method Development and Validation Workflow
Adherence to the guidelines and protocols established by ISO, AOAC, and ICH is non-negotiable for generating scientifically sound and internationally accepted data in food component analysis using HPLC and GC-MS. The structured approach to method development and validation detailed in this application note—encompassing accuracy, precision, specificity, and other key characteristics—provides a clear roadmap for researchers and laboratory professionals. Furthermore, the integration of Green Analytical Chemistry principles represents the evolving nature of the field, balancing analytical excellence with environmental responsibility. By rigorously applying these standards and continuously verifying method performance, scientists in both academia and industry can ensure the integrity of their data, support product safety and quality, and contribute to the advancement of analytical science.
High-Performance Liquid Chromatography (HPLC) and Gas Chromatography-Mass Spectrometry (GC-MS) are cornerstone analytical techniques in modern food analysis research. The core distinction lies in their mobile phases and the resultant applicability to different compound classes. HPLC utilizes a liquid mobile phase to separate compounds based on their interaction with a solid stationary phase, making it ideal for non-volatile, polar, and thermally labile substances prevalent in food matrices [10] [117]. In contrast, GC-MS employs a gaseous mobile phase, requiring analytes to be volatile and thermally stable, making it a powerful tool for separating and identifying volatile organic compounds, aromas, and many pesticides [10] [118].
The choice between these techniques is fundamental to the success of food component analysis, impacting method development, sample preparation complexity, and the reliability of results. This application note provides a structured comparison to guide researchers in selecting the optimal technique for specific analytical scenarios within food science and drug development.
Technical Comparison: HPLC versus GC-MS
The operational differences between HPLC and GC-MS stem from their fundamental principles, which directly dictate their application scope, performance, and operational costs.
Table 1: Core Technical and Operational Comparison of HPLC and GC-MS
| Aspect | HPLC | GC-MS |
|---|---|---|
| Mobile Phase | Liquid (solvents) | Gas (inert carrier gas like Helium) |
| Separation Principle | Polarity, size, affinity | Volatility and interaction with stationary phase |
| Ideal Analyte Types | Non-volatile, polar, thermally unstable, high molecular weight [10] [117] | Volatile, thermally stable [10] [118] |
| Common Food Analysis Targets | Additives (e.g., preservatives, sweeteners), vitamins, mycotoxins, proteins, amino acids [13] [10] | Pesticides, aroma compounds, fatty acids, environmental pollutants (VOCs, PAHs) [10] [117] [7] |
| Typical Detectors | UV-Vis, Diode Array (DAD), Fluorescence, Mass Spectrometry (MS) [10] | Mass Spectrometry (MS), Flame Ionization (FID) [10] |
| Sample Preparation | Can be complex; often involves extraction and filtration [10] | May require derivatization for polar compounds [10] [119] |
| Operational Cost & Solvent Use | High solvent consumption [10] [117] | Minimal solvent use; lower cost per analysis [10] [117] |
Scenarios for Technique Selection in Food Research
- Use HPLC for: Analyzing polar food additives (e.g., artificial sweeteners, preservatives), water-soluble vitamins, mycotoxins, and protein/amino acid content [10] [118]. It is indispensable for thermally unstable compounds that would degrade in a GC inlet [10].
- Use GC-MS for: Profiling volatile flavor and aroma compounds, determining fatty acid methyl esters (FAMEs), screening for pesticide residues, and detecting volatile organic contaminants in food products [117] [7]. Its superior coupling with mass spectrometry provides excellent sensitivity and confident identification for volatile analytes [119].
Experimental Protocols for Food Component Analysis
Protocol 1: HPLC-UV Analysis of Free Amino Acids in Turkey Meat
Application Context: This targeted method is used to detect adulteration of meat with low-cost protein hydrolysates, which elevate free amino acid levels [120].
1. Sample Preparation:
- Homogenization: Weigh 1.0 g of finely comminuted turkey breast muscle.
- Deproteinization: Add 5 mL of a 5% (w/v) aqueous solution of 5-sulfosalicylic acid to precipitate proteins.
- Centrifugation: Centrifuge the mixture at 10,000 × g for 15 minutes at 4°C.
- Filtration: Carefully collect the supernatant and filter it through a 0.22 µm syringe filter into an HPLC vial [120].
2. Instrumental Analysis - HPLC-UV:
- Column: Use a dedicated amino acid analysis column (e.g., cation-exchange resin).
- Mobile Phase: Employ a gradient of lithium citrate buffers with increasing pH and ionic strength.
- Post-Column Derivatization: After separation, mix the eluent with ninhydrin reagent.
- Detection: Measure absorbance at 570 nm (and 440 nm for proline). Identify and quantify amino acids by comparing retention times and peak areas to those of authentic standards [120].
Protocol 2: GC-MS Screening for Contaminants in Toothpaste
Application Context: This semi-quantitative screening method is designed to detect toxic glycols like diethylene glycol (DEG) in toothpaste, a critical public health safety application [50].
1. Sample Preparation:
- Weighing: Accurately weigh approximately 1.0 g of toothpaste into a 15 mL polypropylene centrifuge tube.
- Liquid Extraction: Add 5 mL of water, vortex mix thoroughly until dispersed. Then add 5 mL of acetonitrile in two portions, mixing well after each addition to suppress foam.
- Centrifugation: Centrifuge for 10 minutes at 5000 × g or greater to separate solids.
- Supernatant Preparation: Transfer 0.50 mL of the clear supernatant to an autosampler vial. Add 0.050 mL of an internal standard solution (e.g., 1,3-Propanediol at 5.0 mg/mL) [50].
2. Instrumental Analysis - GC-MS:
- Column: Stabilwax or equivalent (30 m × 0.25 mm id × 0.25 µm df), a polar polyethylene glycol stationary phase.
- Injection: 1 µL in split mode (20:1 ratio). Inlet temperature: 250°C.
- Oven Program: 100°C (hold 1 min), ramp to 250°C at 10°C/min (hold 4 min).
- Carrier Gas: Helium, constant flow mode.
- MS Detection: Operate in full scan mode (e.g., m/z 29-400). Solvent delay: 4 minutes [50].
- Identification: Identify DEG by comparing its retention time (approx. 10.4 min) and mass spectrum with a reference standard.
Diagram 1: GC-MS Sample Preparation Workflow.
Essential Research Reagent Solutions
The following reagents are critical for the successful execution of the protocols described herein.
Table 2: Key Research Reagents and Materials for HPLC and GC-MS Protocols
| Reagent/Material | Function | Application Example |
|---|---|---|
| 5-Sulfosalicylic Acid | Deproteinization agent; precipitates proteins while leaving amino acids in solution. | Sample preparation for amino acid analysis in meat by HPLC [120]. |
| Lithium Citrate Buffers | Mobile phase for HPLC; provides the ionic strength and pH gradient needed to separate individual amino acids on cation-exchange columns. | Elution of amino acids in dedicated amino acid analyzers [120]. |
| Ninhydrin Reagent | Post-column derivatization agent; reacts with primary amines from amino acids to produce a purple chromophore (Ruhemann's purple) for UV-Vis detection. | Detection of amino acids after HPLC separation [120]. |
| Internal Standard (e.g., 1,3-Propanediol) | Quantification control; added in a known amount to correct for variability in sample preparation and injection volume. | GC-MS analysis of diethylene glycol in toothpaste [50]. |
| QuEChERS Kits | Quick, Easy, Cheap, Effective, Rugged, Safe; a multi-residue sample preparation method for extracting pesticides and other contaminants from food matrices. | Extraction of pesticides from fruits and vegetables prior to GC-MS/MS analysis [119]. |
| Derivatization Reagents (e.g., MSTFA) | Silanizing agents; increase volatility and thermal stability of polar compounds (e.g., sugars, organic acids) by replacing active hydrogens with trimethylsilyl groups. | Metabolomics studies of food samples using GC-MS [120]. |
HPLC and GC-MS are powerful yet complementary techniques in food analysis. The decision flowchart below provides a strategic path for technique selection based on the physicochemical properties of the target analyte. HPLC is the unequivocal choice for non-volatile, polar, and thermally unstable food components like proteins, many additives, and vitamins. Conversely, GC-MS excels in the analysis of volatile and thermally stable compounds, including flavors, aromas, and a wide range of pesticide residues. Making an informed choice at the method development stage is critical for achieving accurate, reliable, and efficient results in food research and quality control.
Diagram 2: Decision Workflow for HPLC and GC-MS Technique Selection.
Within the broader scope of analytical methodologies for food component analysis, the accurate quantification of cholesterol in meat products remains a critical task for nutritional labeling and food safety. This case study directly compares two robust chromatographic techniques—High-Performance Liquid Chromatography with Photodiode Array Detection (HPLC-PAD) and Gas Chromatography-Mass Spectrometry (GC-MS)—for this application. The selection of an appropriate analytical method significantly impacts the reliability, efficiency, and cost-effectiveness of nutritional data generated for regulatory compliance and consumer information [121] [67]. This evaluation is particularly relevant for research and development laboratories seeking to optimize their analytical workflows for lipid analysis in complex meat matrices.
Methodologies and Experimental Protocols
Sample Preparation: Direct Saponification and Extraction
Both analytical methods validated in this study utilize a common sample preparation foundation based on direct saponification, which eliminates the need for prior lipid extraction, thereby reducing processing time and solvent consumption [121] [67].
- Reagents: Potassium hydroxide (KOH) in methanol, n-hexane, chloroform, anhydrous sodium sulfate, and ethanol (96% v/v).
- Procedure:
- Saponification: Approximately 0.5 g of homogenized meat sample is refluxed with 15 mL of methanolic KOH solution (1 mol/L) for 15 minutes [122]. This process hydrolyzes cholesterol esters into free cholesterol.
- Extraction: After saponification, 10 mL of deionized water is added to increase polarity. To prevent emulsion formation, 1 mL of ethanol (96%) is introduced [122]. The unsaponifiable matter, containing cholesterol, is then extracted twice with 15 mL of an n-hexane-chloroform binary mixture (1:1, v/v) [121] [122].
- Clean-up: The combined organic extracts are dried by passing through anhydrous sodium sulfate, then concentrated to dryness using a rotary evaporator.
- Reconstitution: The residue is reconstituted in a suitable solvent—methanol for HPLC-PAD or a solvent compatible with GC-MS derivatization—filtered through a 0.2 μm PTFE membrane, and transferred to a vial for chromatographic analysis [122].
HPLC-PAD Analysis Protocol
The HPLC-PAD method offers a robust solution for cholesterol quantification without the need for derivatization.
- Instrumentation: HPLC system equipped with a quaternary pump, autosampler, and a photodiode array detector [122].
- Chromatographic Conditions:
- Column: Zorbax Eclipse Plus C18 column (2.1 × 100 mm, 3.5 μm particle size) or equivalent reverse-phase column [122].
- Mobile Phase: Isocratic elution with acetonitrile/methanol (60:40, v/v) [122].
- Flow Rate: 0.5 mL/min [122].
- Detection: Wavelength set at 205 nm for cholesterol detection [122].
- Injection Volume: 10 μL [122].
- Column Temperature: 30°C [122].
- Run Time: Approximately 7 minutes, with cholesterol eluting at around 5.6 minutes [122].
GC-MS Analysis Protocol
The GC-MS method provides superior sensitivity and selectivity, often requiring a derivatization step to enhance the volatility and thermal stability of cholesterol.
- Instrumentation: GC system coupled with a mass spectrometer detector [121] [66].
- Derivatization: The extracted cholesterol sample is derivatized using BSTFA (N,O-Bis(trimethylsilyl)trifluoroacetamide) to form trimethylsilyl (TMS) derivatives, which are more volatile for GC analysis [66].
- Chromatographic Conditions:
- Column: Capillary GC column suitable for high-temperature operation (up to 280–300°C) [67].
- Carrier Gas: Helium or hydrogen.
- Temperature Program: Oven temperature is programmed to ramp for optimal separation. A specific method reported cholesterol elution at 22.24 minutes as a TMS derivative [66].
- Detection: Mass spectrometer operated in selected ion monitoring (SIM) mode for high sensitivity. Key diagnostic ions for cholesterol-TMS include m/z 386.4 and 458.4 [66].
Results and Comparative Data
A direct comparison of the validated performance parameters for both techniques reveals distinct advantages and limitations.
Table 1: Comparative Method Performance for Cholesterol Quantification in Meat
| Performance Parameter | HPLC-PAD Method | GC-MS Method |
|---|---|---|
| Linearity (R²) | > 0.998 [121] | > 0.998 [121] |
| Recovery | > 99% [121] | > 99% [121] |
| Limit of Detection (LOD) | 1.49 μg/mL [121] | 0.19 μg/mL [121] |
| Limit of Quantification (LOQ) | 2.72 μg/mL [121] | 0.56 μg/mL [121] |
| Precision | Good (Repeatability & Reproducibility) [121] | Good (Repeatability & Reproducibility) [121] |
| Organic Solvent Consumption | Higher | Lower in chromatographic analysis [121] |
| Analysis Time | Faster (no derivatization) | Slower (requires derivatization) |
| Selectivity & Specificity | High | Very High (mass confirmation) [121] [66] |
Discussion
Analytical Workflow and Technical Considerations
The choice between HPLC-PAD and GC-MS involves trade-offs between sensitivity, operational complexity, and analytical requirements.
Diagram 1: Analytical Workflow for Cholesterol Quantification
The Researcher's Toolkit: Essential Reagents and Materials
Table 2: Key Research Reagent Solutions for Cholesterol Quantification
| Reagent/Material | Function | Application Notes |
|---|---|---|
| Methanolic KOH | Saponification agent to hydrolyze cholesterol esters and release free cholesterol. | Concentration typically 1 mol/L; critical for complete hydrolysis without degradation [122]. |
| n-Hexane & Chloroform | Extraction solvents for the unsaponifiable fraction containing cholesterol. | A binary mixture (1:1, v/v) is effective for extracting cholesterol from the aqueous matrix post-saponification [121] [122]. |
| BSTFA | Derivatizing agent for GC-MS. | Converts cholesterol to its volatile trimethylsilyl (TMS) derivative, essential for GC analysis [66]. |
| Cholesterol Standard | Analytical standard for calibration and quantification. | Purity ≥99%; used to prepare calibration curves for accurate quantification in both methods [122]. |
| Anhydrous Sodium Sulfate | Drying agent for organic extracts. | Removes trace water from the organic extract after the liquid-liquid extraction step [122]. |
Both HPLC-PAD and GC-MS are suitable and validated techniques for the accurate determination of cholesterol in meat, each with distinct profiles. The GC-MS method demonstrates superior sensitivity with lower LOD and LOQ values (0.19 μg/mL and 0.56 μg/mL, respectively) and provides high selectivity through mass spectrometric confirmation [121] [66]. This makes it ideal for applications requiring trace-level detection or confirmation of identity in complex matrices. However, the HPLC-PAD method offers a faster and simpler analytical workflow by eliminating the derivatization step, while still providing excellent linearity, recovery (>99%), and precision [121] [123]. Its higher LOD and LOQ (1.49 μg/mL and 2.72 μg/mL, respectively) are often sufficient for routine quantification of cholesterol in meat products [121]. The decision for method selection should be guided by the specific laboratory requirements, balancing the need for high sensitivity and confirmatory analysis (favoring GC-MS) against operational simplicity and throughput (favoring HPLC-PAD).
The Synergistic Role of HPLC and GC-MS in a Comprehensive Analytical Laboratory
In the field of food component analysis, the combination of High-Performance Liquid Chromatography (HPLC) and Gas Chromatography-Mass Spectrometry (GC-MS) provides a powerful, complementary toolkit for addressing diverse analytical challenges. HPLC excels in separating non-volatile, thermally labile, and polar compounds, while GC-MS offers superior resolution and definitive identification for volatile and semi-volatile substances. This synergy is critical in modern food analysis, where researchers must accurately identify and quantify a wide range of components—from nutrients and aroma compounds to contaminants at trace levels—within complex matrices [51] [30]. The integration of these techniques provides a comprehensive analytical approach, enabling laboratories to characterize food quality, authenticity, and safety with high precision.
Fundamental Principles and Complementary Nature
High-Performance Liquid Chromatography (HPLC) separates compounds dissolved in a liquid solvent using a pressurized mobile phase passed through a column packed with a stationary phase. Separation is based on differential partitioning between the mobile and stationary phases. Modern systems operate at high pressures (e.g., 600-1300 bar for UHPLC) and can be coupled with various detectors, most notably mass spectrometry (MS) for compound identification [31]. HPLC is particularly well-suited for analyzing non-volatile, thermally unstable, and polar molecules, making it indispensable for assessing amino acids, phenolic compounds, vitamins, and many other food bioactives [51].
Gas Chromatography-Mass Spectrometry (GC-MS) separates volatile compounds by vaporizing the sample and carrying it through a column via an inert gas mobile phase. The separated components are then introduced into a mass spectrometer, which fragments the molecules and detects the ions based on their mass-to-charge ratio, providing a unique spectral fingerprint for each compound [124]. GC-MS is the gold standard for analyzing volatile and semi-volatile compounds, such as aroma profiles, fatty acids, pesticides, and other contaminants [51] [125]. A key limitation of GC is that analytes must be volatile and thermally stable, or require chemical derivatization to become so [125] [126].
Comparative Technical Capabilities
The table below summarizes the core strengths and typical applications of each technique in food analysis.
Table 1: Comparison of HPLC and GC-MS Characteristics in Food Analysis
| Feature | HPLC (-MS) | GC-MS |
|---|---|---|
| Analyte Type | Non-volatile, thermally labile, polar, ionic | Volatile, semi-volatile, thermally stable |
| Molecular Weight | Small to very large (e.g., proteins, peptides) | Small to medium |
| Sample Preparation | Often requires extraction, filtration, sometimes cleanup | Often requires extraction, derivatization for non-volatiles |
| Common Food Applications | Amino acids, organic acids, pigments (chlorophyll, anthocyanins), vitamins, mycotoxins, antibiotics [51] | Fatty acids, sterols, aroma compounds (esters, alcohols), pesticides, fragrance components [51] [125] |
| Key Strengths | Broad applicability without derivatization; ideal for bio-molecules; high-pressure capabilities for fast separations [31] | Superior separation efficiency; definitive identification via mass spectral libraries; high sensitivity for target volatiles [124] |
Application Notes in Food Analysis
The complementary nature of HPLC and GC-MS is evident in their application to critical areas of food science, including food quality assessment, authenticity, and safety monitoring.
Food Quality and Nutrient Profiling
Comprehensive nutrient profiling often requires both techniques. For instance, in analyzing beef from cattle with different diets, GC-MS is employed to determine the fatty acid profile, revealing that grass-finished beef has a more favorable ω-6:ω-3 polyunsaturated fatty acid (PUFA) ratio [51]. Concurrently, UPLC-MS/MS (a form of HPLC-MS) can be used to quantify micronutrients and phytochemicals, providing a holistic view of the meat's nutritional quality [51]. Similarly, the analysis of Chlorella vulgaris strains for lipid content utilizes GC-FID (similar to GC) for fatty acid profiling and LC-MS/MS for comprehensive lipid speciation, identifying differences in triacylglycerols and phospholipids content between strains [51].
Food Authenticity and Traceability
Chromatographic techniques are vital for combating food fraud. A study on Calabrian unifloral honeys used a multi-platform approach: HS-SPME-GC-MS was used to characterize the volatile aroma profile, while UHPLC-ESI-MS/MS was applied to determine the amino acid composition [51]. By building a predictive model that correlates these two datasets, researchers created a powerful tool for authenticating honey origin and variety based on its chemical signature. In another example, GC-MS and UHPLC-MS/MS were successfully used to distinguish geographical indication (GI) certified strawberries from non-GI ones by comparing their specific ester/ketone profiles and phenolic acid markers, such as cinnamic acid [51].
Contaminant and Residue Analysis
Ensuring food safety involves detecting trace-level contaminants, a task for which both techniques are extensively validated. A robust GC-MS/MS method was established for detecting penicillin G residues in poultry eggs, achieving impressive limits of quantification (LOQ) as low as 6.1–8.5 μg/kg [125]. For pesticide screening in complex matrices like apples, grapes, and seeds, GC-MS/MS is preferred due to its high sensitivity and ability to identify compounds using spectral libraries, though analysts must carefully account for matrix effects that can suppress or enhance signals [51]. Conversely, HPLC-MS/MS is the technique of choice for monitoring drug residues like oxytetracycline and enrofloxacin in lettuce, with methods validated to meet regulatory standards [51].
Experimental Protocols
Detailed Protocol: Analysis of Fatty Acids and Phytochemicals in Beef by GC-MS and HPLC-MS
This protocol is adapted from research comparing the nutritional profiles of beef from different feeding regimens [51].
1. Goal: To determine the impact of cattle diet (grass vs. grain) on the fatty acid profile (via GC-MS) and the micronutrient/phytochemical composition (via HPLC-MS) of beef.
2. Materials and Reagents: Table 2: Research Reagent Solutions and Essential Materials
| Item | Function / Explanation |
|---|---|
| Beef Samples | Tissue from cattle fed grass, grain, or grain+grape seed extract diets. |
| Methanol, Acetonitrile (HPLC-grade) | Extraction solvents for lipids and phytochemicals; mobile phase components for HPLC. |
| Derivatization Reagent | (e.g., N-Methyl-N-(trimethylsilyl)trifluoroacetamide, MSTFA). Makes fatty acids volatile for GC-MS analysis. |
| Fatty Acid Methyl Ester (FAME) Standards | Standard mixtures for calibrating the GC-MS and identifying fatty acid peaks. |
| Solid-Phase Extraction (SPE) Cartridges | e.g., C18 or HLB cartridges for purifying and concentrating extracts before instrumental analysis. |
| Potassium Hydroxide (KOH) Solution | Used in the saponification step to hydrolyze triglycerides into free fatty acids. |
| Internal Standards | e.g., deuterated analogs of target analytes for HPLC-MS; non-native fatty acids for GC-MS. Corrects for losses during sample preparation. |
3. Sample Preparation:
- Homogenization: Finely grind the beef sample to ensure a uniform and representative sub-sample.
- Lipid Extraction (for GC-MS): Weigh ~1 g of homogenized tissue. Extract total lipids using a suitable method (e.g., pressurized liquid extraction or accelerated solvent extraction). Evaporate the solvent under a gentle stream of nitrogen.
- Derivatization: Re-dissolve the lipid extract and subject it to saponification with KOH in methanol to release free fatty acids. Subsequently, derivatize the fatty acids to their methyl esters (FAMEs) using a reagent like MSTFA.
- Phytochemical Extraction (for HPLC-MS): Weigh another ~1 g of homogenized tissue. Extract with a mixture of methanol and water, often acidified, using shaking or sonication. Centrifuge and collect the supernatant. Clean up the extract using an SPE cartridge.
4. Instrumental Analysis:
- GC-MS Conditions:
- Column: Non-polar capillary column (e.g., 5% phenyl polysiloxane, 30 m x 0.25 mm i.d., 0.25 μm film).
- Oven Program: Ramp from 100°C to 300°C to separate the range of FAMEs.
- Ionization: Electron Impact (EI) at 70 eV.
- Detection: Operate in Selected Ion Monitoring (SIM) mode for high sensitivity quantification of target FAMEs.
- HPLC-MS/MS Conditions:
- System: UPLC-MS/MS with a triple quadrupole mass spectrometer.
- Column: Reversed-phase C18 column (e.g., 100 mm x 2.1 mm, 1.7 μm).
- Mobile Phase: (A) Water with 0.1% formic acid and (B) Acetonitrile with 0.1% formic acid, using a gradient elution.
- Ionization: Electrospray Ionization (ESI), positive/negative switching.
- Detection: Multiple Reaction Monitoring (MRM) for specific quantification of micronutrients and phytochemicals.
5. Data Analysis:
- Quantify fatty acids and phytochemicals using the external or internal standard method with calibration curves.
- Statistically compare the concentrations of ω-3 and ω-6 PUFAs, minerals, and secondary metabolites between the different dietary groups.
Detailed Protocol: Profiling Aroma and Amino Acids in Honey for Authentication
This protocol summarizes the approach used to build a predictive model for honey authentication [51].
1. Goal: To correlate the volatile aroma profile (GC-MS) with the amino acid profile (UHPLC-MS/MS) of unifloral honeys to develop an authentication model.
2. Materials and Reagents:
- Unifloral honey samples (authenticated).
- Amino acid standards.
- Headspace Solid-Phase Microextraction (HS-SPME) fiber (e.g., DVB/CAR/PDMS).
- Derivatization reagent for amino acids (e.g., AccQ-Tag).
- Internal standards.
3. Sample Preparation and Analysis:
- Volatile Aroma Analysis by HS-SPME-GC-MS:
- Place a diluted honey sample in a headspace vial.
- Incubate the vial at a controlled temperature with agitation.
- Expose the SPME fiber to the vial headspace to adsorb volatile compounds.
- Inject the fiber into the GC inlet for thermal desorption and analysis.
- Amino Acid Analysis by UHPLC-MS/MS:
- Dissolve honey in water and filter.
- Derivatize the amino acids to enhance their chromatographic behavior and detectability.
- Inject the derivatized sample into the UHPLC-MS/MS system.
4. Data Analysis and Model Building:
- Process the GC-MS and UHPLC-MS/MS data to identify and quantify all volatiles and amino acids.
- Use chemometric techniques (e.g., Principal Component Analysis - PCA, Orthogonal Projections to Latent Structures - Discriminant Analysis OPLS-DA) to find correlations between the two datasets.
- Build a predictive model that can authenticate honey variety based on its chemical signature.
Workflow Visualization
The following diagram illustrates the complementary and synergistic workflow of HPLC and GC-MS in a comprehensive food analysis laboratory.
The integrated use of HPLC and GC-MS provides an unparalleled analytical strategy for the modern food laboratory. While HPLC-MS tackles the vast landscape of polar and non-volatile bioactives and contaminants, GC-MS delivers definitive analysis for volatile compounds critical for flavor, aroma, and certain residue tests. This synergy, as demonstrated across various applications from nutrient profiling to authenticity and safety monitoring, allows scientists to build a more complete and accurate chemical picture of food. As both technologies continue to advance—with trends pointing toward higher pressure and speed in HPLC, greater sensitivity and resolution in GC-MS, and the integration of miniaturized systems and artificial intelligence [31] [30]—their combined role in ensuring food quality, safety, and authenticity will only become more profound and indispensable.
Conclusion
HPLC and GC-MS are powerful, complementary techniques that form the backbone of modern food component analysis. HPLC excels for polar, non-volatile, and thermally labile compounds, while GC-MS is unparalleled for volatile and thermally stable analytes. The future of food analysis lies in the development of greener, multi-residue methods, the integration of artificial intelligence for data processing and non-targeted screening, and the adoption of high-resolution mass spectrometry for comprehensive contaminant identification. For biomedical and clinical research, these advancements promise a deeper understanding of how food components and contaminants influence human health, driving innovations in nutritional science, toxicology, and the development of functional foods.
References
- 1. HPLC Basics | Thermo Fisher Scientific - US [https://www.thermofisher.com/us/en/home/industrial/chromatography/chromatography-learning-center/liquid-chromatography-information/hplc-basics.html]
- 2. Gas Chromatography/ Mass Spectrometry Fundamentals [https://www.agilent.com/en/product/gas-chromatography-mass-spectrometry-gc-ms/gcms-fundamentals?srsltid=AfmBOoqcOY3TU0N-ubJNkZawHfIGspXBp-RLvRyAUVx4dB2Ha5W0dg42]
- 3. HPLC Basics – Essential Guide to Chromatography ... [https://www.knauer.net/blog/blog-9/hplc-basics-97]
- 4. Gas Chromatography Mass Spectrometry (GC-MS) ... [https://www.thermofisher.com/us/en/home/industrial/mass-spectrometry/mass-spectrometry-learning-center/gas-chromatography-mass-spectrometry-gc-ms-information.html]
- 5. Application of Liquid Chromatography in Food Analysis [https://pmc.ncbi.nlm.nih.gov/articles/PMC7555050/]
- 6. Innovations in Liquid Chromatography: 2025 HPLC ... [https://www.chromatographyonline.com/view/innovations-in-liquid-chromatography-2025-hplc-column-and-accessories-review]
- 7. Advances in GC–MS for Food Analysis [https://www.chromatographyonline.com/view/advances-gc-ms-food-analysis]
- 8. Modern HPLC Applications in PFAS Food Analysis [https://www.sepscience.com/modern-hplc-applications-in-pfas-food-analysis-technological-progress-and-regulatory-implications-12168]
- 9. Machine Learning-Driven Integration of GC–MS and ... [https://www.sciencedirect.com/science/article/abs/pii/S0889157525014103]
- 10. HPLC vs GC: Choosing the Right Chromatography ... [https://www.labmanager.com/hplc-vs-gc-choosing-the-right-chromatography-technique-33689]
- 11. LCMS vs. GCMS: When to Choose Each for Optimal ... [https://emerypharma.com/blog/lcms-vs-gcms-when-to-choose-each-for-optimal-results-in-your-analytical-chemistry/]
- 12. Advantages, Limitations, And Future Trends Of High- ... [https://www.alwsci.com/news/advantages-limitations-and-future-trends-of-85237687.html]
- 13. Liquid Chromatography Analysis of Common Nutritional ... [https://pmc.ncbi.nlm.nih.gov/articles/PMC6352167/]
- 14. Gas Chromatography/ Mass Spectrometry Fundamentals [https://www.agilent.com/en/product/gas-chromatography-mass-spectrometry-gc-ms/gcms-fundamentals?srsltid=AfmBOooJHzRpP0OKxyT-JRRjExxA51Mu2wpHpxh2WZHZ4MsZlAl-cW1I]
- 15. Recent advances in chromatography-mass spectrometry ... [https://www.sciencedirect.com/science/article/abs/pii/S0308814622027765]
- 16. Sample Preparation – HPLC [https://pccl.chem.ufl.edu/sample-preparation-hplc/]
- 17. HPLC Method Development Steps [https://www.thermofisher.com/us/en/home/industrial/chromatography/chromatography-learning-center/liquid-chromatography-information/hplc-method-development-steps.html]
- 18. What Factors Influence HPLC Retention Time Precision? [https://altabrisagroup.com/hplc-retention-time-precision/]
- 19. Matrix Effect Evaluation in GC/MS-MS Analysis of Multiple ... [https://pmc.ncbi.nlm.nih.gov/articles/PMC10650748/]
- 20. News Details - Investors - Thermo Fisher Scientific [https://ir.thermofisher.com/investors/news-events/news/news-details/2025/Thermo-Fisher-Scientific-Unveils-Next-generation-Mass-Spectrometers-at-ASMS-2025-to-Revolutionize-Biopharma-Applications-and-Omics-Research/default.aspx]
- 21. Bruker Launches Novel timsMetabo™ Mass Spectrometer ... [https://www.bruker.com/ko/news-and-events/news/2025/bruker-launches-novel-timsmetabo-mass-spectrometer.html]
- 22. Development of gas chromatography-mass spectrometry ... [https://www.sciopen.com/article/10.26599/FSAP.2025.9240120]
- 23. Research and application of multi-component sterol ... [https://pubmed.ncbi.nlm.nih.gov/41195066/]
- 24. How It Works: UV Detection for HPLC [https://www.chromatographyonline.com/view/how-it-works-uv-detection-hplc-0]
- 25. High-Performance Liquid Chromatography–Fluorescence ... [https://pmc.ncbi.nlm.nih.gov/articles/PMC11125890/]
- 26. HPLC with Fluorescence Detection for Determination of ... [https://www.mdpi.com/2079-6412/10/7/624]
- 27. GC with Flame Ionization Detector (FID) [https://www.phenomenex.com/knowledge-center/gc-knowledge-center/gc-with-flame-ionization-detector?srsltid=AfmBOor5vJS0WV8hxIkQQBu6dBzsX2shb1GRk0Js3DNIg7Mj9q0o6qWg]
- 28. Application of Mass Spectrometry Imaging for Visualizing ... [https://pmc.ncbi.nlm.nih.gov/articles/PMC7278736/]
- 29. Using HPLC–MS and GC–MS for Improving Speed and ... [https://www.chromatographyonline.com/view/using-hplc-ms-and-gc-ms-for-improving-speed-and-accuracy-of-organosulfur-compound-detection]
- 30. Advanced Food Analysis Technologies Set New ... [https://www.spectroscopyonline.com/view/advanced-food-analysis-technologies-set-new-benchmarks-in-safety-and-sustainability]
- 31. New HPLC, MS, and CDS Products from 2024–2025 [https://www.chromatographyonline.com/view/new-hplc-ms-and-cds-products-from-2024-2025-a-brief-review]
- 32. Mastering Chromatogram Analysis: A Comprehensive Guide [https://chromtech.com/blog/mastering-chromatogram-analysis-a-comprehensive-guide/]
- 33. Modern Sample Preparation Methods for Food and ... [https://www.chromatographyonline.com/view/modern-sample-preparation-methods-food-and-environmental-laboratories]
- 34. HPLC Update Day 2: Modern Method Development [https://www.chromatographyonline.com/view/hplc-update-day-2-modern-method-development]
- 35. HPLC 2025 Preview: The Road To Sustainable Analytical ... [https://www.chromatographyonline.com/view/hplc-2025-preview-the-road-to-sustainable-analytical-chemistry]
- 36. Automating Sample Preparation for Food Analysis [https://www.thermofisher.com/blog/analyteguru/automating-sample-preparation-for-food-analysis-the-holy-grail/]
- 37. Development and Validation of HPLC-DAD/FLD Methods for ... [https://pmc.ncbi.nlm.nih.gov/articles/PMC12525618/]
- 38. Method for simultaneous determination of three cooling ... [https://pubmed.ncbi.nlm.nih.gov/41245247/]
- 39. Optimization and Validation of an HPLC Method ... [https://pmc.ncbi.nlm.nih.gov/articles/PMC12409534/]
- 40. A Review onRecent Advances in HPLC (High Performance ... [http://www.orientjchem.org/vol41no5/a-review-onrecent-advances-in-hplc-high-performance-liquid-chromatographyunder-green-chromatographymethods/]
- 41. Pre-Concentration and Analysis of Mycotoxins in Food Samples by... [https://pmc.ncbi.nlm.nih.gov/articles/PMC7436008/]
- 42. Analysis of Vitamins by Liquid Chromatography [https://www.sciencedirect.com/science/article/abs/pii/B9780124158061000188]
- 43. A Critical Overview of HPLC-MS-Based Lipidomics ... [https://pmc.ncbi.nlm.nih.gov/articles/PMC10486615/]
- 44. Decoding Mycotoxin Testing: Ensuring Food with Advanced... Safety [https://www.linkedin.com/pulse/decoding-mycotoxin-testing-ensuring-food-safety-methods-odhiambo-ucs1f]
- 45. 蒸发光散射检测法同时测定固态食品中6种稀有糖 [https://pmc.ncbi.nlm.nih.gov/articles/PMC10507526/]
- 46. Innovative sample preparation techniques in food analysis [https://www.sciencedirect.com/science/article/pii/S2772582025000440]
- 47. Levels of Contamination by Pesticide Residues, Polycyclic ... [https://pmc.ncbi.nlm.nih.gov/articles/PMC9968705/]
- 48. Rapid Sample Preparation and Fast GC–MS-MS for the ... [https://www.spectroscopyonline.com/view/rapid-sample-preparation-and-fast-gc-ms-ms-analysis-pesticides-and-environmental-contaminants-fish-1]
- 49. GC-MS Sample Preparation [https://www.thermofisher.com/us/en/home/industrial/mass-spectrometry/mass-spectrometry-learning-center/gas-chromatography-mass-spectrometry-gc-ms-information/gc-ms-sample-preparation.html]
- 50. Mass Spectrometry (GC-MS) Screening Procedure for the ... [https://www.fda.gov/food/laboratory-methods-food/lab-method-gas-chromatography-mass-spectrometry-gc-ms-screening-procedure-presence-diethylene-glycol]
- 51. Evolving Techniques for Food Analysis - PMC [https://pmc.ncbi.nlm.nih.gov/articles/PMC12345980/]
- 52. Pesticide Residue Analysis in Food: Advances, Challenges ... [https://www.chromatographyonline.com/view/pesticide-residue-analysis-in-food-advances-challenges-and-case-studies]
- 53. LC Method Development Considerations for Food ... [https://www.americanlaboratory.com/913-Technical-Articles/158756-LC-Method-Development-Considerations-for-Food-Contaminants-Analysis/]
- 54. Non-targeted analysis of unexpected food contaminants ... [https://pmc.ncbi.nlm.nih.gov/articles/PMC6096699/]
- 55. QuEChERS Method Simplified: Key Steps and Applications [https://www.sepscience.com/quechers-method-simplified-key-steps-and-applications-11014]
- 56. Overview of the Evolution and Trends of the QuEChERS ... [https://link.springer.com/article/10.1007/s44169-024-00073-1]
- 57. Solid-Phase Extraction: From Sample Prep Fundamentals ... [https://www.waters.com/blog/solid-phase-extraction-from-sample-prep-fundamentals-to-best-practices/?srsltid=AfmBOopPsMbsXMXvkhbHL5wNr5IeY2xMw3R2i9OZhdXGFOsvZxfpeEb4]
- 58. Guide To Solid Phase Extraction (SPE): Step-by- ... [https://www.alwsci.com/news/guide-to-solid-phase-extraction-spe-step-by-85168348.html]
- 59. Automated Solid Phase Extraction (SPE) [https://www.thermofisher.com/us/en/home/industrial/chromatography/chromatography-sample-preparation/automated-sample-preparation/automated-solid-phase-extraction-spe.html]
- 60. Solid-Phase Microextraction (SPME): A Discussion [https://www.chromatographyonline.com/view/solid-phase-microextraction-spme]
- 61. Recent advances in solid phase microextraction with ... [https://pmc.ncbi.nlm.nih.gov/articles/PMC11363066/]
- 62. New Sample Preparation Products and Accessories for ... [https://www.chromatographyonline.com/view/new-sample-preparation-products-and-accessories-for-2024-2025]
- 63. 超高效液相色谱-串联质谱法测定沉积物中草铵膦 [https://pmc.ncbi.nlm.nih.gov/articles/PMC11758234/]
- 64. A critical review of analytical methods for determination ... [https://pmc.ncbi.nlm.nih.gov/articles/PMC6838282/]
- 65. A UHPLC-DAD method for quantification of curcuminoids ... [https://www.sciencedirect.com/science/article/abs/pii/S0889157525006489]
- 66. A Novel Method for the Determination of Squalene ... [https://pmc.ncbi.nlm.nih.gov/articles/PMC10931826/]
- 67. A simplified method for cholesterol determination in meat ... [https://www.sciencedirect.com/science/article/abs/pii/S0889157508000112]
- 68. Polyfluoroalkyl-Substances Detection in Junk Food ... [https://pmc.ncbi.nlm.nih.gov/articles/PMC11513209/]
- 69. PFAS in Food Analysis [https://www.chromatographyonline.com/view/pfas-in-food-analysis]
- 70. HPLC Column Selection Guide [https://scioninstruments.com/us/blog/hplc-column-selection-guide/]
- 71. What is Gas Chromatography? [https://www.teledynelabs.com/products/chromatography/gc-prep/gas-chromatography]
- 72. Application of gas chromatography in food analysis [https://www.sciencedirect.com/science/article/abs/pii/S0165993602008051]
- 73. Reversed Phase HPLC Columns [https://www.phenomenex.com/techniques/hplc-reversed-phase?srsltid=AfmBOop4N9JNuBlCH1ThSTWNG--EToVRSyG-87WI_MZQaU2Tp3-rvWn1]
- 74. HPLC Columns & LC Columns | Types, How to ... - GL Sciences [https://www.glsciencesinc.com/hplc-columns?srsltid=AfmBOorQMx16VcJhP5cCYDh3nD8j-_X5B4F1s1cB_2N81QtwtP90oIoC]
- 75. How to Choose the Right Chromatographic Phase? [https://www.silicycle.com/articles/how-to-choose-the-right-chromatographic-phase]
- 76. Selecting the Right Column for Your Reversed Phase Method [https://phenomenex.blog/2017/06/22/right-reversed-phase-column/]
- 77. Column Selection for Reversed-Phase HPLC [https://www.chromatographyonline.com/view/column-selection-reversed-phase-hplc-0]
- 78. Selecting a Reversed-Phase Column for the Peptide ... [https://www.waters.com/nextgen/us/en/library/application-notes/2017/reversed-phase-column-for-peptide-mapping-biotherapeutic-protein.html?srsltid=AfmBOopHvLGbJXEUc-dGqngk87FKPnDdMM8aaqrPoRC5sgxn8ndvtNjW]
- 79. Guide to GC Column Selection and Optimizing Separations [https://www.restek.com/articles/guide-to-gc-column-selection-and-optimizing-separations?srsltid=AfmBOooZbexcQ8h8HFL9191EFGNGzMKHQ5SCC8N85RkV6RySFwyar-Jp]
- 80. Mobile Phase Selection Guide: Optimal Solvent Pairing ... [https://www.alwsci.com/news/mobile-phase-selection-guide-optimal-solvent-77320943.html]
- 81. High performance liquid chromatography coupled with post ... [https://www.sciencedirect.com/science/article/pii/S0308814624002255]
- 82. A Complete Guide to Mobile Phase and Stationary ... [https://uhplcs.com/a-complete-guide-to-mobile-phase-and-stationary-phase-in-hplc/]
- 83. : A Critical Factor in Mobile | Phenomenex Phase Optimization HPLC [https://www.phenomenex.com/knowledge-center/hplc-knowledge-center/mobile-phase-in-chromatography]
- 84. How to Optimize HPLC Gradient Elution for Complex Samples - [https://www.mastelf.com/how-to-optimize-hplc-gradient-elution-for-complex-samples/]
- 85. Gradient Elution - an overview [https://www.sciencedirect.com/topics/chemistry/gradient-elution]
- 86. Development and application of a GC-MS method for ... [https://www.sciencedirect.com/science/article/abs/pii/S0889157525008300]
- 87. Temperature Programming for Better GC Results [https://www.phenomenex.com/knowledge-center/gc-knowledge-center/maintenance-and-troubleshooting-of-gc-columns?srsltid=AfmBOorZwll-IFmnlWTNSvF4jiGGVDnIxit8cwa3DTXc8Jvk6e3AO4mx]
- 88. The Secrets of Successful Temperature Programming [https://www.chromatographyonline.com/view/secrets-successful-temperature-programming]
- 89. GC Temperature Programming—10 Things You Absolutely ... [https://www.chromatographyonline.com/view/gc-temperature-programming-10-things-you-absolutely-need-know]
- 90. GC Temperature Program Development [https://www.elementlabsolutions.com/uk/chromatography-blog/post/gc-temperature-program-development]
- 91. Hydrogen as a Carrier Gas for GC and GC–MS [https://www.chromatographyonline.com/view/hydrogen-carrier-gas-gc-and-gc-ms]
- 92. Comparison of carrier gases for the separation and ... [https://www.sciencedirect.com/science/article/pii/S0021967324003200]
- 93. Implementation of quality toward processing of by products design food [https://pubmed.ncbi.nlm.nih.gov/28402220/]
- 94. Application of quality by design in the current drug development [https://pmc.ncbi.nlm.nih.gov/articles/PMC7032183/]
- 95. Implementation of Quality by Design for processing of food ... [https://www.sciencedirect.com/science/article/abs/pii/S0960308516300414]
- 96. Method Validation and Robustness [https://www.chromatographyonline.com/view/method-validation-and-robustness]
- 97. The Application of Quality by Design to Analytical Methods [https://www.pharmtech.com/view/application-quality-design-analytical-methods]
- 98. 10.4 Experimental design – Validation of liquid ... [https://sisu.ut.ee/lcms_method_validation/104-experimental-design/]
- 99. Robustness evaluation in analytical methods optimized ... [https://www.sciencedirect.com/science/article/abs/pii/S0026265X16303599]
- 100. Full factorial design for optimization, development and ... [https://www.sciencedirect.com/science/article/pii/S1319016415000390]
- 101. Matrix Effects on Quantitation in Liquid Chromatography [https://www.chromatographyonline.com/view/matrix-effects-on-quantitation-in-liquid-chromatography-sources-and-solutions]
- 102. Determining Matrix Effects in Complex Food Samples [https://www.waters.com/blog/understanding-sample-complexity-determining-matrix-effects-in-complex-food-samples/?srsltid=AfmBOorp7-n_80PqSHtzko65xqBgy7HMa8mIB65aVKV5wSrbaghbUFYD]
- 103. HPLC Sample Preparation [https://www.organomation.com/hplc-sample-preparation]
- 104. Everything You Need to Know About HPLC Sample Preparation [https://www.hplcvials.com/knowledge/everything-you-need-to-know-about-hplc-sample-preparation.html]
- 105. Analytical Method Validation: Back to Basics, Part II [https://www.chromatographyonline.com/view/analytical-method-validation-back-basics-part-ii]
- 106. The 6 Key Aspects of Analytical Method Validation [https://www.elementlabsolutions.com/uk/chromatography-blog/post/6-key-aspects-of-analytical-method-validation]
- 107. Development and Validation of HPLC-DAD Method for ... [https://pmc.ncbi.nlm.nih.gov/articles/PMC7466259/]
- 108. Development and Validation of an HPLC Method ... [https://pmc.ncbi.nlm.nih.gov/articles/PMC6431496/]
- 109. Conducting GC Method Validation Using High Accuracy ... [https://www.environics.com/2024/08/23/gc-method-validation-high-accuracy-standards/]
- 110. Going Low: Understanding Limit of Detection in Gas ... [https://www.chromatographyonline.com/view/going-low-understanding-limit-of-detection-in-gas-chromatography-gc-]
- 111. Development and Validation of Gas Chromatography ... [https://www.mdpi.com/2227-9717/11/8/2337]
- 112. Determination of Detection Limits and Quantitation ... [https://pmc.ncbi.nlm.nih.gov/articles/PMC4803648/]
- 113. 2025 Annual Meeting Scientific Sessions [https://www.aoac.org/2025-annual-meeting-exposition/2025-annual-meeting-scientific-sessions/]
- 114. Validation, measurement uncertainty, and application of ... [https://www.sciencedirect.com/science/article/abs/pii/S0889157525001498]
- 115. HPLC Method Development and Validation for ... [https://www.pharmtech.com/view/hplc-method-development-and-validation-pharmaceutical-analysis]
- 116. Green Approaches in High-Performance Liquid ... [https://pmc.ncbi.nlm.nih.gov/articles/PMC12430196/]
- 117. GC Vs. HPLC: A Comprehensive Comparison And ... [https://www.alwsci.com/news/gc-vs-hplc-a-comprehensive-comparison-and-pr-78733374.html]
- 118. Determination of Contaminants: HPLC vs. GC [https://www.tentamus.com/news/determination-of-contaminants-hplc-vs-gc/]
- 119. Comprehensive Strategy for Sample Preparation for the ... [https://pmc.ncbi.nlm.nih.gov/articles/PMC8535889/]
- 120. Comparison of Targeted (HPLC) and Nontargeted (GC-MS ... [https://pmc.ncbi.nlm.nih.gov/articles/PMC7465048/]
- 121. Comparison Between HPLC-PAD and GC-MS Methods for ... [https://link.springer.com/article/10.1007/s12161-021-02226-7]
- 122. Determination of Cholesterol Content in Butter by HPLC [https://pmc.ncbi.nlm.nih.gov/articles/PMC7650802/]
- 123. Simple and Rapid Method for the Simultaneous ... [https://open.metu.edu.tr/handle/11511/36170]
- 124. Analysis results of GC [https://www.shimadzu.com/an/service-support/technical-support/analysis-basics/fundamentals/results.html]
- 125. Establishment and Validation of a GC–MS/MS Method for ... [https://pmc.ncbi.nlm.nih.gov/articles/PMC8621557/]
- 126. Development and validation of a GC-MS method for ... [https://www.sciencedirect.com/science/article/pii/S0731708523002728]