Gold Nanoparticle-Based Lateral Flow Immunoassay for Wheat Allergen Detection: A Comprehensive Guide from Development to Application
This article provides a comprehensive overview of the development, optimization, and application of gold nanoparticle-based lateral flow immunoassays (LFIA) for the rapid and sensitive detection of wheat allergens, with a...
Gold Nanoparticle-Based Lateral Flow Immunoassay for Wheat Allergen Detection: A Comprehensive Guide from Development to Application
Abstract
This article provides a comprehensive overview of the development, optimization, and application of gold nanoparticle-based lateral flow immunoassays (LFIA) for the rapid and sensitive detection of wheat allergens, with a specific focus on gliadin. Tailored for researchers, scientists, and drug development professionals, the content explores the foundational principles of LFIA, details the step-by-step methodological process for constructing a wheat allergen assay, addresses critical troubleshooting and optimization parameters to enhance performance, and validates the method through comparative analysis with other diagnostic techniques. The integration of advanced strategies, such as molecular dynamics for antibody optimization and novel nanoparticle labels, is also discussed to present a future-oriented perspective on point-of-care food safety diagnostics.
Understanding Wheat Allergens and the Principles of Lateral Flow Immunoassays
The Clinical and Public Health Significance of Wheat Allergy and Celiac Disease
Wheat allergy and celiac disease represent two distinct but clinically significant gluten-related disorders with substantial public health implications. Celiac disease, an autoimmune disorder triggered by gluten, damages the small intestine and affects approximately 1% of the population globally [1]. Meanwhile, non-celiac gluten sensitivity (NCGS) may affect up to 10-15% of the global population, though recent research from the University of Melbourne suggests its symptoms are often part of the gut-brain interaction spectrum rather than being directly caused by gluten [1]. The development of accurate, rapid diagnostic tools is crucial for proper disease management. Gold nanoparticle-based lateral flow immunoassays (LFIA) have emerged as promising platforms for detecting wheat allergens like gliadin, offering rapid on-site testing capabilities that can benefit both clinical diagnostics and food safety monitoring [2] [3].
Quantitative Analysis of Gluten-Related Disorders and Detection Methods
Epidemiology and Clinical Presentation
Table 1: Global Prevalence and Key Characteristics of Gluten-Related Disorders
| Disorder Type | Global Prevalence | Key Trigger | Primary Symptoms | Diagnostic Criteria |
|---|---|---|---|---|
| Celiac Disease | ~1% general population [1] | Gluten (wheat, barley, rye) | Diarrhea, weight loss, fatigue, malnutrition; 50% of pediatric celiac cases may lack GI symptoms [1] | Positive serology (tTG-IgA) & confirmatory intestinal biopsy [1] |
| Non-Celiac Gluten Sensitivity (NCGS) | 10-15% global population [1] | Often not gluten (gut-brain interaction) [1] | Bloating (71%), abdominal discomfort (46%), abdominal pain (36%), fatigue (32%) [1] | Exclusion of celiac disease/wheat allergy + symptom resolution on GF diet |
| Wheat Allergy | Varies by region | Wheat proteins | Urticaria, breathing difficulties, anaphylaxis | Clinical history + IgE testing/oral food challenge |
| Celiac in SLE Pediatric Patients | 3% (3x higher prevalence) [1] | Gluten | Only 50% present with GI symptoms [1] | Serological screening in high-risk groups |
Table 2: Gluten Detection Technologies: Performance Comparison
| Detection Method | Detection Limit | Time Required | Equipment Needs | Primary Application |
|---|---|---|---|---|
| Gold nanoparticle-based LFIA [2] | 6.56 ng/mL (calculated); 25 ng/mL (visual) [2] | 15 minutes [3] | Minimal; portable strips | Rapid on-site screening |
| Sandwich ELISA [2] | 60 ng/mL [2] | 2-4 hours | Plate reader | Laboratory quantification |
| HPLC/MS [3] | Variable; sub-ppm possible | 30-60 minutes + sample prep | Advanced laboratory equipment | Confirmatory testing |
| PCR [3] | Variable | 2-3 hours | Thermal cycler, electrophoresis | DNA-based gluten detection |
Public Health Burden and Food Safety Regulations
The public health impact of gluten-related disorders extends beyond clinical symptoms to include significant lifestyle and economic burdens. Research indicates that 26% of households with celiac disease children experience gluten-free food insecurity, which significantly delays antibody normalization and disease recovery due to cost, transportation barriers, and limited access to gluten-free foods [1]. Regulatory frameworks have been established globally, with the Codex Alimentarius standard mandating that gluten-free products must contain less than 20 parts per million (ppm) of gluten [3]. This threshold is recognized by both the U.S. Food and Drug Administration and European Commission Regulation [3]. Emerging legislation, such as California's Allergen Disclosure for Dining Experiences (ADDE) Act, will require major restaurants to list common food allergens including wheat on menus by July 2026, highlighting the increasing recognition of these disorders as public health priorities [1].
Gold Nanoparticle-Based Lateral Flow Immunoassay: Application Notes and Protocols
Principle and Advantages of LFIA for Wheat Allergen Detection
The gold nanoparticle-based lateral flow immunoassay operates on a sandwich immunoassay principle for the detection of wheat gliadin, a major allergen and the immunotoxic component of gluten [2] [3]. The assay utilizes two monoclonal antibodies that specifically target gliadin—one immobilized on the membrane as a capture reagent and another conjugated to gold nanoparticles as a detection reagent [3]. When a sample containing gliadin is applied, it forms a complex with the gold nanoparticle-conjugated antibodies, which then migrate along the strip via capillary action until captured at the test line, generating a visible signal [2]. This technology offers significant advantages over traditional methods like ELISA, PCR, and HPLC, particularly for field use, as it requires minimal equipment, provides results within 15 minutes, and can be performed by non-specialized personnel [3]. The visual limit of detection of 25 ng/mL with a calculated LOD of 6.56 ng/mL in milk samples demonstrates sufficient sensitivity for monitoring the 20 ppm gluten threshold established for gluten-free foods [2] [3].
Experimental Protocol: LFIA for Gliadin Detection
Gold Nanoparticle Synthesis and Characterization
Protocol: Gold nanoparticles (AuNPs) of approximately 20 nm diameter are synthesized using the citrate reduction method of HAuCl₄ [3].
- Step 1: Prepare 0.01% HAuCl₄ solution and heat to boiling with vigorous stirring.
- Step 2: Rapidly add 1% trisodium citrate solution (1:10 v/v ratio) and continue heating until color changes to deep red.
- Step 3: Cool to room temperature and characterize using UV-Vis spectrophotometry (peak absorption at 523 nm) and dynamic light scattering (hydrodynamic diameter ~23 nm) [3].
- Step 4: Adjust concentration to an optical density of 10 at 520 nm for conjugation.
Antibody Selection and Conjugation Optimization
Protocol: Monoclonal antibodies (mAbs) against gliadin are screened for optimal pairing [2].
- Step 1: Screen anti-gliadin mAbs using pairwise sandwich ELISA to identify optimal capture-detection pairs (mAb 7 as capture antibody and HRP-labeled mAb 6 as detection antibody shown optimal in studies) [2].
- Step 2: Adjust AuNP solution to pH 8.0 using 0.1M K₂CO₃, which is critical for stable conjugation [3].
- Step 3: Add gliadin mAb to AuNP solution at optimal concentration of 1 μg/mL and incubate for 1 hour at room temperature with gentle mixing [3].
- Step 4: Block remaining surfaces with 1% BSA for 30 minutes.
- Step 5: Centrifuge at 12,000 × g for 15 minutes and resuspend in preservation buffer containing sucrose and BSA.
- Step 6: Characterize conjugated AuNPs using FESEM and UV-Vis spectroscopy (peak shift to 526-529 nm indicates successful conjugation) [3].
LFTS Assembly and Testing Procedure
Protocol: Lateral flow test strips are assembled with conjugated AuNPs applied to conjugate pad [3].
- Step 1: Dispense anti-gliadin mAb (1 mg/mL) and species-specific anti-IgG antibody (1 mg/mL) on nitrocellulose membrane as test and control lines, respectively.
- Step 2: Dry membranes at 37°C for 12 hours.
- Step 3: Assemble components: sample pad, conjugate pad containing gold-labeled mAbs, nitrocellulose membrane with test/control lines, and absorbent pad.
- Step 4: Cut into 4-mm wide strips and store in desiccated packaging.
- Step 5: For testing, apply 40 μL of extracted food sample to the sample pad and allow to migrate for 15 minutes [3].
- Step 6: Interpret results: two red lines (test and control) indicate positive result (>20 ppm gluten); one control line only indicates negative result (<20 ppm gluten) [3].
LFIA Test Workflow and Interpretation
Research Reagent Solutions
Table 3: Essential Materials for Gold Nanoparticle-Based LFIA Development
| Reagent/Material | Function/Description | Specifications/Alternatives |
|---|---|---|
| Anti-gliadin mAbs [2] | Primary detection reagents; specifically target gliadin epitopes | mAb 6 (detection) and mAb 7 (capture) shown optimal; specificity for PQPQLPY epitope enhances accuracy [3] |
| Gold nanoparticles (AuNPs) [3] | Signal generation; colorimetric detection | 20 nm spherical particles; citrate reduction synthesis; peak absorption 523 nm |
| Nitrocellulose membrane [3] | Matrix for antibody immobilization | Pore size 8-15 μm; consistent flow characteristics critical |
| Sample pad [3] | Application point for food extracts | Glass fiber or cellulose; may require pre-treatment with buffers/surfactants |
| Gliadin standard [2] | Positive control and calibration | Sigma-Aldrich; prepare stock solutions in 60% ethanol |
| Phosphate buffered saline (PBS) [3] | Buffer system for extraction and dilution | 0.01M phosphate, 0.138M NaCl, 0.0027M KCl, pH 7.4 |
| Blocking agents (BSA, sucrose) [3] | Stabilize conjugated AuNPs; reduce non-specific binding | 1% BSA for blocking; sucrose (2-5%) in preservation buffer |
Gold nanoparticle-based lateral flow immunoassays represent a significant advancement in the detection of wheat allergens, particularly for gliadin, addressing crucial clinical and public health needs in managing celiac disease and wheat allergy. The protocol outlined herein provides researchers with a comprehensive framework for developing sensitive, specific, and rapid tests capable of detecting gluten at the regulatory threshold of 20 ppm. With the high global prevalence of gluten-related disorders and the documented challenges of gluten-free food insecurity, such accessible detection technologies play an essential role in protecting vulnerable populations. Further development and refinement of these assays will continue to enhance clinical diagnostics, food safety monitoring, and ultimately improve quality of life for individuals with gluten-related disorders.
IgE-mediated wheat allergy is an emerging global health concern, particularly prevalent in Northern Europe and parts of Asia [4]. This immunologic response can manifest with symptoms ranging from mild urticaria to life-threatening anaphylaxis. A unique and severe manifestation is wheat-dependent exercise-induced anaphylaxis (WDEIA), where symptoms occur only when wheat ingestion is followed by physical exertion or other co-factors like NSAIDs or alcohol [4]. Among the complex mixture of wheat proteins, gliadin has been identified as a major culprit in triggering these allergic responses. Understanding the specific gliadin proteins and their epitopes is therefore crucial for developing accurate diagnostic tools, including gold nanoparticle-based lateral flow immunoassays (LFIAs) for rapid detection [2].
Major Wheat Allergen Proteins and Epitopes
Wheat proteins are classified into two main categories based on their solubility: the water/salt-soluble proteins (albumins and globulins) and the alcohol/dilute acid-soluble proteins (gliadins and glutenins) [4]. The table below summarizes the major allergenic wheat proteins, with gliadins being particularly significant.
Table 1: Major Allergenic Wheat Proteins and Their Characteristics
| Protein Category | Specific Protein | Allergen Designation | Solubility | Primary Clinical Association |
|---|---|---|---|---|
| Gliadins | ω-5-gliadin | Tri a 19 | Alcohol/water-soluble | WDEIA, IgE-mediated allergy |
| α/β-gliadin | Tri a 21 | Alcohol/water-soluble | IgE-mediated allergy | |
| γ-gliadin | Tri a 20 | Alcohol/water-soluble | IgE-mediated allergy | |
| Glutenins | HMW Glutenin | Tri a 26 | Dilute acid-soluble | IgE-mediated allergy |
| LMW Glutenin | Tri a 36 | Dilute acid-soluble | IgE-mediated allergy | |
| Albumins/Globulins | Lipid Transfer Protein (LTP) | Tri a 14 | Water/salt-soluble | WDEIA |
| Alpha-amylase inhibitors | Tri a 15 | Water/salt-soluble | IgE-mediated allergy |
The most allergenic wheat proteins responsible for IgE-mediated wheat allergy are gliadins, particularly ω-5-gliadin, and glutenins [4]. In WDEIA, ω-5-gliadin and LTP are the major allergens involved [4]. Gliadins are monomeric proteins that can be further subdivided into α/β-, γ-, and ω-gliadins based on their primary structure and molecular weight. Omega-5-gliadin, a subset of ω-gliadins with higher molecular weight (∼55–65 kDa) and specific repetitive motifs (QQIPQQ), is especially notable for its strong association with WDEIA [5].
Table 2: Key Epitopes in Gliadin Families for Wheat Allergy and Celiac Disease
| Gliadin Family | Epitope Type | Example Epitope Sequences/Regions | Associated Condition |
|---|---|---|---|
| ω-5-gliadin | IgE | SRLL-, FPQQQ, QQIPQQ repetitive motifs | WDEIA [5] |
| α-gliadin | T-cell (CD) | Five known core sequences | Celiac Disease [5] |
| γ-gliadin | T-cell (CD) | Eight known core sequences | Celiac Disease [5] |
| ω-1,2-gliadin | T-cell (CD) | Two known core sequences | Celiac Disease [5] |
Proteomic Profiling and Epitope Analysis Protocol
A detailed understanding of the specific gliadin proteins and their epitopes in a wheat sample requires sophisticated proteomic analysis. The following protocol, adapted from Cho et al. (2018), outlines the key steps for gliadin extraction, separation, and epitope characterization [5].
Protocol: Proteomic Analysis of Gliadins from Wheat Flour
Principle: This method uses sequential extraction to isolate alcohol-soluble gliadins from wheat flour, followed by high-resolution 2-Dimensional Gel Electrophoresis (2-DE) to separate individual protein components. The separated proteins are then identified using Tandem Mass Spectrometry (MS/MS), and the resulting sequences are analyzed for known CD and WDEIA epitopes [5].
Materials and Reagents:
- Wheat flour (e.g., from Triticum aestivum L. cv. Keumkang)
- 150 mM NaCl solution
- 70% Ethanol (HPLC grade recommended)
- 2-DE reagents: Immobilized pH Gradient (IPG) strips (pI range 6-11 and/or 3-11), SDS-PAGE gels, electrophoresis buffer, staining solutions (e.g., Coomassie Brilliant Blue, Sypro Ruby)
- MS/MS reagents: Trypsin (sequencing grade), MALDI matrix (if using MALDI-TOF/TOF), LC-MS/MS solvents
Procedure:
- Extraction of Gliadin Proteins:
- Begin with 100 mg of wheat flour.
- Add 1 mL of 150 mM NaCl solution. Shake the mixture for 2 hours at room temperature to dissolve and remove water/salt-soluble albumins and globulins.
- Centrifuge at 15,000 g and 20°C for 10 minutes. Carefully discard the supernatant.
- To the pellet, add 1 mL of 70% ethanol. Shake the mixture overnight at room temperature to solubilize the gliadins.
- Centrifuge again at 15,000 g and 20°C for 10 minutes.
- Collect the supernatant, which contains the extracted gliadins. Aliquot (e.g., 500 μL) and immediately freeze in liquid nitrogen. Store at -80°C for long-term preservation. Perform three separate extractions for analytical reproducibility [5].
Protein Separation using Two-Dimensional Gel Electrophoresis (2-DE):
- Use an appropriate volume of the gliadin extract for isoelectric focusing (IEF). The Keumkang study used a pI range of 6-11 in the first dimension for initial separation, identifying α-, γ-, and ω-gliadins in 31, 28, and one 2-DE spot, respectively [5].
- For a more comprehensive profile, especially to capture more ω-gliadins, a second separation using a broader pI range (3-11) is recommended. This approach identified an additional six ω-gliadins in the Keumkang cultivar [5].
- Following IEF, perform the second dimension separation by SDS-PAGE on a suitable polyacrylamide gel (e.g., 12%).
- Visualize the separated protein spots by staining (e.g., Coomassie Brilliant Blue or fluorescent stains) [5].
Protein Identification via Tandem Mass Spectrometry (MS/MS):
- Excise the protein spots of interest from the 2-DE gels.
- Digest the proteins in-gel with trypsin.
- Analyze the resulting peptides using tandem mass spectrometry (MS/MS).
- Identify the proteins by searching the acquired MS/MS spectra against relevant protein databases (e.g., NCBInr) [5].
Epitope Analysis:
- Compile the identified protein sequences from the MS/MS data.
- Systematically analyze these sequences for known core epitope sequences relevant to CD and WDEIA, as summarized in Table 2 of this document [5].
Diagram 1: Workflow for gliadin proteomic profiling.
Gold Nanoparticle-based Lateral Flow Immunoassay (LFIA) for Gliadin
For the rapid and on-site detection of the major wheat allergen gliadin in food products, a gold nanoparticle-based Lateral Flow Immunoassay (LFIA) presents a highly effective solution. The protocol below is based on the work of Hu et al. (2023), which developed a sensitive and specific LFIA for gliadin detection in milk, a common food matrix [2].
Protocol: Development of LFIA Strips for Gliadin Detection
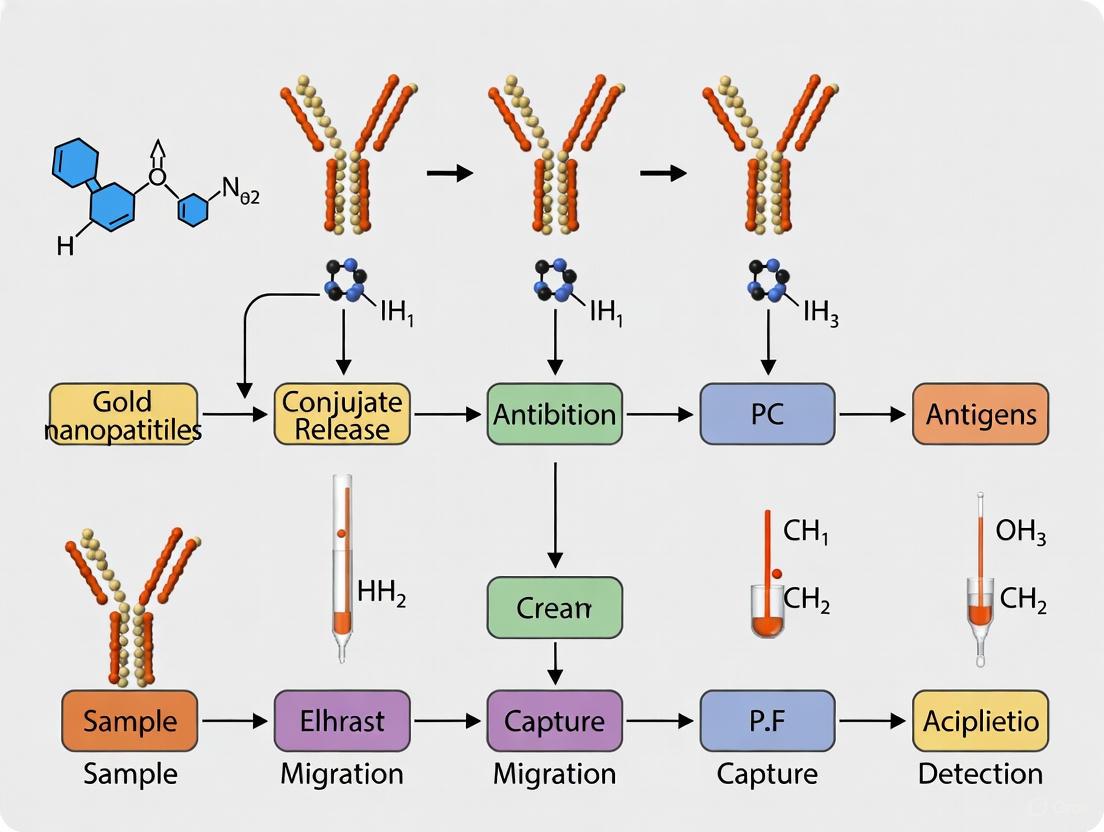
Principle: This sandwich immunoassay uses two monoclonal antibodies (mAbs) that bind to distinct epitopes on the gliadin molecule. One mAb (capture antibody) is immobilized on a nitrocellulose membrane at the test line. The other mAb (detection antibody) is conjugated to gold nanoparticles (AuNPs). When a liquid sample containing gliadin is applied, it binds to the AuNP-conjugated mAb. This complex migrates along the strip via capillary action and is captured by the immobilized mAb at the test line, generating a visible red line due to the accumulation of AuNPs [2].
Materials and Reagents:
- Monoclonal Antibodies: A pair of high-affinity mAbs against gliadin (e.g., mAb 7 as capture antibody and mAb 6 as detection antibody, as identified by Hu et al.) [2].
- Gold Nanoparticles (AuNPs): Colloidal gold, ~20-40 nm in diameter.
- LFIA Components: Sample pad, conjugate pad, nitrocellulose membrane, absorbent pad, and backing card.
- Buffer Solutions: Phosphate Buffered Saline (PBS), blocking buffer (e.g., containing BSA or sucrose).
- Gliadin Standard: For calibration and quality control.
Procedure:
- Preparation of AuNP-mAb Conjugate:
- Adjust the pH of the colloidal gold solution to an optimal level (typically slightly above the isoelectric point of the antibody, often around pH 8.0-9.0).
- Add the detection mAb (e.g., mAb 6) to the pH-adjusted AuNP solution and incubate to allow adsorption of the antibody onto the AuNP surface.
- Block the remaining surfaces of the AuNPs with a suitable blocking agent (e.g., BSA) to prevent non-specific binding.
- Purify the conjugate by centrifugation and resuspend in a storage buffer containing stabilizers. Dispense the conjugate onto the conjugate pad and dry [2].
Assembly of LFIA Strips:
- Immobilize the capture mAb (e.g., mAb 7) at the test line (T-line) of the nitrocellulose membrane. Immobilize a control antibody (e.g., anti-mouse IgG) at the control line (C-line).
- Assemble the strip components in the following sequence on a backing card: sample pad, conjugate pad (overlapping the sample pad), nitrocellulose membrane (overlapping the conjugate pad), and absorbent pad (overlapping the end of the nitrocellulose membrane).
- Cut the assembled card into individual strips of the desired width (e.g., 4 mm) [2].
Detection and Analysis:
- Prepare the sample. For solid foods, an extraction with a suitable solvent (e.g., 60% ethanol) is necessary to solubilize gliadins.
- Apply the extracted sample (e.g., 80-100 μL) to the sample pad of the LFIA strip.
- Allow the sample to migrate up the strip for a specified time (e.g., 10-15 minutes).
- Visually inspect the strip for the appearance of lines. A visible T-line alongside a C-line indicates a positive result. The C-line must always appear for the test to be valid.
- The visual limit of detection (vLOD) reported for this assay was 25 ng/mL in milk, with a calculated LOD of 6.56 ng/mL [2].
Diagram 2: LFIA principle for gliadin detection.
The Scientist's Toolkit: Key Research Reagent Solutions
The following table details essential materials and reagents used in the featured experiments for gliadin analysis and detection.
Table 3: Research Reagent Solutions for Gliadin and Wheat Allergen Research
| Reagent / Material | Function / Application | Example & Key Characteristics |
|---|---|---|
| Anti-Gliadin mAbs | Core recognition elements in immunoassays (ELISA, LFIA). | mAb 6 (HRP-detection) & mAb 7 (capture); high specificity and affinity pair with minimal cross-reactivity [2]. |
| Colloidal Gold Nanoparticles | Signal generation in LFIA; conjugated to detection mAb. | ~20-40 nm diameter; conjugated to anti-gliadin mAb for visual detection [2]. |
| ω-5-gliadin Allergen | Positive control and assay standardization for specific IgE detection. | Purified native or recombinant ω-5-gliadin (Tri a 19); essential for WDEIA diagnostics [4]. |
| Ethanol (70%) | Solvent for extracting gliadins from food and flour matrices. | Effectively solubilizes monomeric gliadins while leaving other protein fractions insoluble [5]. |
| 2-DE & MS Consumables | High-resolution separation and identification of complex gliadin families. | IPG strips (pI 3-11, 6-11), SDS-PAGE gels, trypsin, MALDI/LC-MS/MS platforms [5]. |
Core Components and Working Principle of a Lateral Flow Immunoassay
Lateral Flow Immunoassays (LFIAs) are paper-based platforms for detecting and quantifying analytes in complex mixtures, where results are displayed within 5–30 minutes [6]. These assays are widely adopted in biomedicine, agriculture, food safety, and environmental sciences due to their simplicity, rapid results, and portability [6]. The COVID-19 pandemic demonstrated the feasibility of large-scale LFIA testing for clinical and public health purposes, highlighting their utility beyond traditional laboratory settings [7]. In the context of wheat allergen research, LFIAs provide a rapid, on-site method for detecting gluten proteins such as gliadin, which is crucial for food safety and managing celiac disease [3]. This application note details the core components, working principles, and experimental protocols for developing a gold nanoparticle-based LFIA for wheat allergen detection, framed within a broader thesis on method development for food allergen research.
Core Components of a Lateral Flow Immunoassay
A typical lateral flow test strip consists of overlapping membranes mounted on a backing card for stability and handling [6]. Each component plays a specific role in ensuring the proper flow, reaction, and detection of the target analyte. The table below summarizes the core components, their functions, and material considerations for developing an LFIA for wheat allergen detection.
Table 1: Core Components of a Lateral Flow Immunoassay Strip for Wheat Allergen Detection
| Component | Function | Common Materials | Considerations for Wheat Allergen (Gliadin) Detection |
|---|---|---|---|
| Sample Pad | Receives the liquid sample; distributes it evenly to the conjugate pad; may contain buffers and surfactants to treat the sample [6] [8]. | Cellulose, glass fiber [7] | Must effectively handle food extracts. Pre-treatment may be needed to solubilize gliadins [3]. |
| Conjugate Pad | Stores dried detector reagents (e.g., antibody-labeled nanoparticles); releases them upon contact with the sample [6]. | Glass fiber, polyester, rayon [6] | Conjugated anti-gliadin monoclonal antibodies must remain stable and functional when dried [3]. |
| Nitrocellulose Membrane | Critical platform where immunochemical reactions occur; contains immobilized capture reagents at the test and control lines [6] [9]. | Nitrocellulose with various capillary flow times [6] | Pore size and flow rate must be optimized for efficient capture of gliadin-antibody-gold complexes [6]. |
| Test Line | Contains immobilized capture antibodies (or antigens) specific to the target analyte; generates a positive signal [6] [8]. | Anti-target analyte antibodies bound to the membrane [3] | Striped with a monoclonal antibody specific for gliadin's immunodominant sequence (e.g., PQPQLPY) [3]. |
| Control Line | Verifies that the test has functioned correctly; captures unused conjugate particles [6] [10]. | Secondary antibodies specific to the conjugate antibody [9] | Confirms the flow and reactivity of the gold-labeled antibodies, ensuring test validity [8]. |
| Absorbent Pad | Acts as a waste reservoir; wicks the fluid through the strip to maintain continuous capillary flow [6] [10]. | High-density cellulose [6] | Must have sufficient capacity to handle the entire sample volume and prevent backflow. |
| Backing Card | Provides structural support for assembling and overlapping all strip components [6]. | Plastic, adhesive-coated vinyl or polyester [6] | Ensures mechanical stability during handling and storage. |
Working Principle and Assay Formats
The fundamental principle of an LFIA is that a liquid sample moves without external forces via capillary action through the various zones of the strip [6]. As the sample migrates, it interacts with reagents that lead to a visual response indicating the presence or absence of the target analyte. The two primary formats for LFIAs are the sandwich assay and the competitive assay.
The Direct (Sandwich) Format
The sandwich format is used for larger analytes with multiple antigenic sites, such as proteins or whole pathogens [6] [10]. This format is suitable for detecting gliadin, a protein complex.
Diagram 1: Sandwich assay workflow for gliadin detection
- Sample Application: The liquid food extract containing gliadin is applied to the sample pad.
- Conjugation: The sample migrates to the conjugate pad, dissolving the dried gold nanoparticle (GNP)-conjugated anti-gliadin antibodies. The gliadin antigens bind to these antibodies, forming an analyte-conjugate complex [3].
- Capture at Test Line: The complex continues to flow along the nitrocellulose membrane to the test line. This line is striped with a second, immobilized anti-gliadin antibody that captures the complex. The accumulation of GNPs results in a visible red line [3].
- Capture at Control Line: The remaining free GNP-conjugated antibodies continue to the control line, which is striped with a species-specific secondary antibody (e.g., anti-mouse IgG). This line captures the conjugate regardless of the presence of gliadin, validating the test functionality [9] [8].
- Result Interpretation: The appearance of both a test line and a control line indicates a positive result. The appearance of only the control line indicates a negative result. The absence of a control line indicates an invalid test [8].
The Competitive Format
The competitive format is used for small molecules with single antigenic determinants that cannot bind two antibodies simultaneously [6] [8]. While less common for large proteins like gliadin, it is the standard format for small allergens like certain mycotoxins.
Diagram 2: Competitive assay workflow for small molecules
- Sample Application: The sample containing the small analyte is applied.
- Conjugation: The analyte mixes with the GNP-conjugated antibodies in the conjugate pad.
- Competition at Test Line: The test line is coated with the target analyte (or an analogue). If the target is present in the sample, it binds to the conjugate antibodies, blocking them from binding to the test line. Therefore, no visible line appears at the test zone for a positive result. If the target is absent, the conjugate antibodies bind to the immobilized analyte on the test line, producing a visible line, indicating a negative result [6] [8].
- Control Line: The control line functions identically to the sandwich format, capturing excess conjugate to confirm proper flow.
Detailed Protocol: Gold Nanoparticle-Based LFIA for Gluten Detection
This protocol outlines the steps for developing a sandwich-format LFIA for detecting gluten in raw food materials, based on the method described by Hu et al. (2022) [3]. The target is gliadin, with a detection limit of 20 ppm, aligning with the Codex Alimentarius standard for "gluten-free" labeling [3].
Reagents and Materials
Table 2: Research Reagent Solutions for GNP-based Gliadin LFIA
| Item | Specification/Function | Source/Example |
|---|---|---|
| Anti-Gliadin mAb | Monoclonal antibody specific for the immunodominant 33-mer peptide (e.g., recognizes PQPQLPY); used for both conjugation and capture. | Commercial suppliers (e.g., RayBiotech [11]) |
| Gold Nanoparticles (GNPs) | ~20 nm spherical particles; serve as the colorimetric label due to localized surface plasmon resonance [3]. | TED PELLS, Inc. (citation:6) or Cytodiagnostics |
| Nitrocellulose Membrane | Porous membrane with optimized capillary flow time for protein immobilization and sample development. | EMD Millipore Hi-Flow Plus [11] [3] |
| Sample Pad | Glass fiber pad for sample application and filtration. | Ahlstrom-Munksjö [12] or EMD Millipore |
| Conjugate Pad | Glass fiber or polyester pad for storing dried antibody-GNP conjugates. | EMD Millipore [11] |
| Absorbent Pad | High-capacity cellulose pad to wick fluid and maintain flow. | EMD Millipore [11] or GE Healthcare |
| Backing Card | Adhesive-coated plastic card for assembling strip components. | DCNova or Kenosha |
| Buffer Salts & Blockers | PBS, Sucrose, Trehalose, BSA, Tween-20; used for conjugation, blocking, and sample pad treatment. | Sigma-Aldrich |
Step-by-Step Experimental Procedure
A. Synthesis and Conjugation of Gold Nanoparticles (GNPs)
- Synthesis of GNPs: Synthesize ~20 nm colloidal gold nanoparticles using the citrate reduction method of trisodium citrate with chloroauric acid (HAuCl₄) [3]. Confirm particle size and monodispersity via UV-Vis spectroscopy (peak at ~523 nm) and dynamic light scattering (DLS).
- pH Optimization: Adjust the pH of the GNP solution to 8.0 using a mild buffer like 2-10 mM potassium carbonate (K₂CO₃). This is the optimal pH for antibody adsorption to the GNP surface without causing aggregation [3].
- Antibody Conjugation: Determine the minimum amount of antibody required to stabilize the GNPs by adding varying concentrations of anti-gliadin monoclonal antibody (e.g., 0-8 µg/mL) to fixed volumes of GNPs. Incubate for 30-60 minutes. Add NaCl to a final concentration of 1.5 M to stress-test stability. The optimal antibody concentration is the lowest that prevents aggregation (solution remains red, not blue/purple) [3].
- Blocking and Stabilization: Add a blocking solution containing Bovine Serum Albumin (BSA) to a final concentration of 1% to cover any remaining bare GNP surfaces and minimize non-specific binding. Incubate for 30 minutes.
- Purification: Centrifuge the conjugate (e.g., at 14,000 x g for 30 minutes for 20 nm GNPs) to remove unbound antibodies and excess blockers. Resuspend the soft pellet in a storage buffer containing 10-20 mM Borax, 1% BSA, 5-10% sucrose, and 0.05-0.1% sodium azide [6].
- Characterization: Verify successful conjugation by a slight red-shift in the UV-Vis spectrum (e.g., from 523 nm to 529 nm) and a slight increase in hydrodynamic diameter as measured by DLS [3].
B. Strip Assembly and Coating
- Membrane Coating:
- Test Line: Dispense the capture anti-gliadin monoclonal antibody at a concentration of 1.0 mg/mL onto the nitrocellulose membrane using a striping dispenser. A typical volume is 0.5 µL per linear cm [11] [3].
- Control Line: Dispense a goat anti-mouse IgG secondary antibody at a concentration of 0.4 mg/mL approximately 3-5 mm downstream from the test line. A typical volume is 0.4 µL per linear cm [11].
- Conjugate Pad Preparation: Dilute the purified antibody-GNP conjugate to an optimal optical density (OD) and dispense it onto the glass fiber conjugate pad. Lyophilize or air-dry the pad, often in the presence of sugar stabilizers like sucrose or trehalose [6].
- Component Assembly: Mount the following components sequentially onto the adhesive backing card with ~1-2 mm overlaps to ensure capillary transfer [11]:
- Absorbent pad at the top.
- Nitrocellulose membrane in the center.
- Conjugate pad below the membrane.
- Sample pad at the bottom.
- Cutting: Cut the assembled card into individual strips of 4-5 mm width using a programmable shear cutter.
C. Test Procedure and Data Acquisition
- Sample Preparation: Homogenize the food sample (e.g., flour) and extract gliadin using a suitable extraction solution (e.g., 60% ethanol). Centrifuge to remove particulates.
- Assay Execution: Apply 40-100 µL of the extracted sample to the sample pad [3]. Follow with 80 µL of chase buffer if required by the strip design [11].
- Incubation and Visualization: Allow the strip to develop at room temperature for 15 minutes [3]. Observe the appearance of lines at the test and control zones.
- Result Interpretation:
- Positive: Both test (T) and control (C) lines are visible. The intensity of the test line is inversely proportional to the gliadin concentration.
- Negative: Only the control (C) line is visible.
- Invalid: The control line does not appear. The test should be repeated.
Table 3: Quantitative Performance of the Gluten LFIA
| Parameter | Specification/Value | Experimental Detail |
|---|---|---|
| Target Analyte | Gliadin (a component of gluten) | - |
| Assay Format | Sandwich immunoassay | Using identical mAbs for capture and detection [3] |
| Detection Limit | 20 ppm (ng/mL) | Meets Codex standard for "gluten-free" [3] |
| Assay Time | 15 minutes | Total development time [3] |
| Sample Volume | 40 µL | Volume of extracted sample applied [3] |
| Specificity | High for gliadin from wheat, rye, barley | Recognizes the immunodominant peptide sequence [3] |
| Quantitative Readout | Possible with a reader | Intensity can be measured with a colorimetric reader [12] |
Advanced Quantitative Readout Techniques
While visual readout is sufficient for qualitative assessment, quantitative data can be obtained using a dedicated reader device. These devices measure the intensity of the test line, which correlates with the analyte concentration [12]. For GNP-based LFIAs, the highest sensitivity in colorimetric readout is often achieved using the green channel of a color image sensor (center wavelength ~537 nm), as the signal-to-noise ratio for the red GNP signal is optimal in this band [12]. This approach can significantly improve the sensitivity and objectivity of the assay.
Advantages of Gold Nanoparticles as Optical Labels in LFIA
Lateral Flow Immunoassay (LFIA) has emerged as a predominant point-of-care diagnostic tool, characterized by its rapid analysis, cost efficiency, and user-friendly visual interpretation [13]. The core of its detection capability lies in the optical labels that generate the visible signal, and among these, gold nanoparticles (AuNPs) have established themselves as the leading label material. This document details the specific advantages of AuNPs as optical labels, framed within research on developing a gold nanoparticle-based LFIA for the detection of wheat allergens. The unique properties of AuNPs—from their strong optical characteristics to their superior biocompatibility—directly address the need for sensitive, rapid, and reliable detection of allergens like gliadin in complex food matrices [2] [3]. The following sections will quantify these advantages, provide detailed experimental protocols, and contextualize their application for researchers and scientists in food safety and drug development.
Core Advantages of Gold Nanoparticles in LFIA
The widespread adoption of AuNPs in LFIA is driven by a combination of optical, physical, and chemical properties that make them uniquely suited for this application.
Strong Optical Properties: AuNPs exhibit intense color due to Localized Surface Plasmon Resonance (LSPR), a phenomenon where conduction electrons oscillate in resonance with incident light [13]. This provides a high extinction coefficient, meaning they are intensely colored even at low concentrations, facilitating clear visual detection. The LSPR band and extinction coefficient are influenced by the nanoparticles' size, shape, and composition, allowing for tuning of their optical properties [13] [14]. For instance, larger spherical AuNPs and non-spherical variants like nanostars scatter light more effectively, further enhancing their visibility [15].
Excellent Biocompatibility and Simple Functionalization: AuNPs are known for their biocompatibility and chemical stability [13]. Their surface allows for straightforward conjugation with biomolecules, such as antibodies, through simple physical adsorption (physisorption) or more controlled covalent bonding methods [16]. This process is well-established, and the resulting conjugates are stable, ensuring the long-term shelf life of LFIA strips. The surface of AuNPs can be easily modified with antibodies via electrostatic interactions, typically by adjusting the pH of the colloidal solution to a value slightly above the isoelectric point of the antibody [3].
Enhanced Sensitivity through Morphology and Size Control: The sensitivity of an LFIA is critically dependent on the label's characteristics. Research demonstrates that moving beyond traditional spherical AuNPs to more complex morphologies can yield significant gains. For example, one study found that star-shaped gold nanoparticles (AuNSs) showed an 86% antibody binding efficiency due to their greater surface area, achieving a limit of detection (LOD) for aflatoxin B1 of 0.01 ng/mL, which surpassed the performance of both spherical nanoparticles and nano-flowers [13]. Similarly, the use of highly spherical gold nanoparticles (S-GNPs) can lead to an 8-fold decrease in LOD compared to conventional quasispherical nanoparticles, attributed to more effective antibody immobilization and superior optical properties [14].
Table 1: Comparative Performance of Different Gold Nanoparticle Morphologies in LFIA
| Nanoparticle Morphology | Key Feature | Reported Advantage | Limit of Detection (LOD) | Target Analyte |
|---|---|---|---|---|
| Spherical (C-GNPs) | Conventional, simple synthesis | Baseline for comparison | Varies with size (e.g., 9.9 ng/mL for 33.7 nm) [14] | Troponin I [14] |
| Gold Nano-Stars (AuNSs) | Branched structure, high surface area | Increased antibody binding efficiency (86%) [13] | 0.01 ng/mL [13] | Aflatoxin B1 [13] |
| Gold Nano-Popcorns (GNPNs) | Rough, hierarchical structure | Improved sensitivity vs. spheres [17] | 0.1 ng/mL [17] | Procalcitonin [17] |
| Superspherical (S-GNPs) | High uniformity, optimal optics | 8-fold lower LOD vs. C-GNPs [14] | 1.2 ng/mL [14] | Troponin I [14] |
Experimental Protocols for AuNP-Based LFIA
This section provides a detailed methodology for developing an LFIA for wheat allergen (gliadin) detection, from the synthesis of AuNPs to the assembly and testing of the strip.
Synthesis and Characterization of Spherical Gold Nanoparticles (Turkevich-Frens Method)
Objective: To synthesize ~20 nm spherical AuNPs for use as optical labels [3] [17].
Materials:
- Tetrachloroauric acid (HAuCl₄)
- Trisodium citrate dihydrate (Na₃C₆H₅O₇·2H₂O)
- Deionized water
Procedure:
- Add 100 mL of a 0.01% (w/v) HAuCl₄ solution to a clean, round-bottom flask equipped with a condenser.
- Heat the solution to boiling under continuous stirring.
- Rapidly add 2.7 mL of a 1% (w/v) trisodium citrate solution to the boiling gold solution.
- Continue heating and stirring for 15 minutes. The solution will change color from pale yellow to deep red.
- Remove the flask from the heat source and allow the colloidal suspension to cool to room temperature while stirring.
- Characterize the synthesized AuNPs by:
Antibody Conjugation and Probe Formation
Objective: To conjugate anti-gliadin monoclonal antibodies to the surface of the synthesized AuNPs to create stable detection probes [3].
Materials:
- Synthesized AuNP colloid
- Anti-gliadin monoclonal antibody (mAb)
- Bovine Serum Albumin (BSA)
- Phosphate Buffered Saline (PBS), pH 7.4
- Sucrose
- Tween 20
Procedure:
- pH Optimization: Determine the optimal pH for conjugation by adding AuNPs to solutions with different pH values (6.0-9.0). The ideal pH is the highest value that prevents aggregation upon salt addition, typically pH 8.0-9.0 [3].
- Antibody Concentration Optimization: At the optimal pH, add varying concentrations of antibody (e.g., 0-8 µg/mL) to separate aliquots of AuNPs. After incubation, add NaCl to a final concentration of 1.5 M. The minimal antibody concentration that prevents a color change from red to blue/purple (indicating aggregation) is the optimal amount for stable conjugation [3].
- Conjugation: For large-scale conjugation, adjust the pH of the AuNP colloid to the optimal value. Add the determined optimal concentration of anti-gliadin mAb dropwise under constant stirring. Incubate for 30-60 minutes at room temperature.
- Blocking: Add BSA to a final concentration of 0.25-1% to block any remaining bare gold surfaces and prevent non-specific binding. Incubate for another 30 minutes.
- Purification: Concentrate the conjugate by centrifugation (e.g., 15,000 × g for 30 min). Carefully discard the supernatant and resuspend the soft pellet in a storage buffer (e.g., PBS containing 0.1% BSA, 10% sucrose, and 0.05% Tween 20). Sucrose acts as a cryoprotectant during the drying of the conjugate pad.
- Storage: Store the purified antibody-AuNP conjugate at 4°C until use.
LFIA Strip Assembly and Test Procedure
Objective: To assemble the functional LFIA strip and perform the detection assay for gliadin.
Materials:
- Membrane components: Sample pad, conjugate pad, nitrocellulose (NC) membrane, absorbent pad.
- Immunoreagents: Captured anti-gliadin mAb (for test line), anti-species antibody or Protein A (for control line).
- Dispenser: BioDot XYZ3000 or equivalent.
Procedure:
- Strip Assembly:
- Test and Control Line Dispensing: Dispense the capture anti-gliadin mAb on the NC membrane to form the test line (T). Dispense an anti-mouse IgG antibody or Protein A at a separate location to form the control line (C). Dry the membrane overnight at room temperature [17].
- Pad Preparation: Saturate the conjugate pad with a buffer containing sugars and surfactants, then dry it. Apply the purified antibody-AuNP conjugate onto the treated conjugate pad and dry.
- Final Assembly: Laminate the sample pad, conjugate pad, NC membrane, and absorbent pad sequentially on a backing card with a 1-2 mm overlap between each component. Cut the assembled card into individual strips of the desired width (typically 4 mm).
- Test Execution:
- Apply 40-100 µL of the extracted food sample or standard to the sample pad [3] [18].
- As the sample migrates, it rehydrates the AuNP-antibody conjugate in the conjugate pad. If gliadin is present, it binds to the AuNP-mAb conjugate.
- The complex continues to flow across the NC membrane and is captured by the immobilized mAb at the test line, forming a visible red line.
- The unbound conjugate is captured at the control line, validating the test.
- Results can be read visually within 5-15 minutes [18].
The following diagram illustrates the workflow and principle of the sandwich LFIA for detecting wheat allergens.
The Scientist's Toolkit: Key Research Reagent Solutions
Table 2: Essential Materials for Gold Nanoparticle-Based LFIA Development
| Item/Category | Specific Examples | Function in the Experiment |
|---|---|---|
| Gold Nanoparticles | Spherical AuNPs (20 nm, 40 nm), Gold Nano-Stars, Gold Nano-Popcorns [13] [17] | Optical label; generates the detectable signal based on LSPR. |
| Critical Antibodies | Anti-gliadin Monoclonal Antibodies (e.g., mAb 6, mAb 7) [2] | Provides specificity; detection antibody is conjugated to AuNPs, capture antibody is immobilized on the membrane. |
| Membrane & Pad System | Nitrocellulose Membrane (e.g., CNPC-SS12), Sample Pad (GFB-R4), Conjugate Pad (PT-R5), Absorbent Pad [17] | Paper-based platform that supports capillary flow and houses immunoreagents. |
| Conjugation Chemicals | Trisodium Citrate, HAuCl₄, BSA, Tween 20, Sucrose [3] [17] | Used for synthesizing, stabilizing, and functionalizing AuNPs, and for blocking non-specific sites. |
| Buffer Systems | Phosphate Buffered Saline (PBS), HEPES Buffer, Tris Buffer [13] [19] | Maintains optimal pH and ionic strength for antibody-antigen interactions and conjugate stability. |
Advanced LFIA Strategies and future trends
The field of AuNP-based LFIA continues to evolve with strategies aimed at pushing the limits of sensitivity.
Signal Amplification Techniques: The silver enhancement method is a powerful post-assay technique where silver ions are reduced onto the surface of captured AuNPs, depositing a metallic silver layer. This significantly increases the particle size and changes the color from red to black, leading to a dramatic enhancement of the signal [17]. Studies have reported up to a 10-fold improvement in sensitivity using this method [17].
Novel Detection Modalities: Moving beyond conventional colorimetric readouts, plasmonic scattering is an emerging modality. This involves using a transparent nitrocellulose membrane with a light-absorbing backing card to create a black background. This setup minimizes background reflection, allowing the strong scattering signal from AuNPs (especially larger ones around 100 nm) to be clearly visualized, significantly improving the signal-to-noise ratio and lowering the limit of detection [15].
Systematic Label Selection: The choice of nanoparticle label is a critical factor. A comparative study of colored labels (AuNPs, Au@Pt core-shell, latex, and magnetic nanoparticles) for detecting a bacterial pathogen concluded that the label's chemical nature and color directly impact the LOD. Au@Pt nanoparticles provided the best LOD in that study, underscoring the importance of screening different nanomaterials for a specific assay [19].
Comparing Sandwich vs. Competitive Assay Formats for Allergen Detection
The accurate detection of food allergens is a critical public health priority, with gluten-related disorders affecting a growing portion of the population. [20] Within this context, gold nanoparticle-based lateral flow immunoassays (LFIAs) have emerged as powerful tools for rapid, on-site screening of allergens such as wheat gliadin. [20] [3] The performance of these assays is fundamentally governed by their format, with sandwich and competitive assays representing two distinct approaches with specific applications. Sandwich immunoassays are predominantly used for larger antigens with multiple epitopes, while competitive formats are essential for detecting small molecules with single epitope sites. [21] This application note provides a detailed comparison of these two formats within the specific context of wheat allergen detection, offering structured protocols, performance data, and guidelines for format selection to assist researchers in developing optimal detection strategies.
Fundamental Principles and Format Selection
Sandwich Assay Format
The sandwich assay, also known as a non-competitive assay, requires two distinct antibodies that bind to different epitopes on the target antigen. [22] [21] In a lateral flow format, one antibody is typically conjugated to a reporter such as gold nanoparticles (AuNPs), while the other is immobilized on the nitrocellulose membrane as a capture antibody at the test line. [20] When the target antigen is present in the sample, it forms a complex "sandwiched" between the two antibodies, resulting in the accumulation of colored nanoparticles at the test line. The signal intensity is directly proportional to the antigen concentration, making the results intuitively interpretable—a visible test line indicates a positive result. [21] This format is ideal for larger protein allergens like wheat gliadin, which possesses multiple antibody-binding sites. [20]
Competitive Assay Format
Competitive assays are primarily employed for the detection of small molecules or single-epitope antigens that cannot accommodate two simultaneous antibodies. [21] This format operates on the principle of competition between the target analyte in the sample and a labeled competitor (antigen or analog) for a limited number of antibody binding sites. In the direct competitive format, the sample analyte competes with a labeled competitor for binding to antibodies immobilized at the test line. [21] Consequently, the signal intensity at the test line is inversely proportional to the analyte concentration—higher analyte concentrations lead to fainter test lines. [21] This counterintuitive signal response ("absence of line indicates positive") can present interpretation challenges but is necessary for detecting small allergenic peptides or hydrolyzed proteins. [21]
Decision Framework for Format Selection
The choice between sandwich and competitive formats should be guided by the molecular characteristics of the target allergen and the specific application requirements. The following table outlines the key selection criteria:
| Parameter | Sandwich Assay | Competitive Assay |
|---|---|---|
| Target Size | Larger proteins (>5 kDa) with multiple epitopes (e.g., native gliadin) [21] | Small molecules or single-epitope targets (e.g., hydrolyzed peptides, pesticide residues) [21] |
| Signal Response | Directly proportional to analyte concentration [21] | Inversely proportional to analyte concentration [21] |
| Result Interpretation | Intuitive (line presence = positive) [21] | Counterintuitive (line absence = positive); requires user training [21] |
| Key Advantage | High specificity and sensitivity; robust signal [20] [21] | Insensitive to the "hook effect"; requires only one antibody type [21] |
| Primary Limitation | Requires two distinct, non-interfering epitopes [22] | Lower absolute signal; more complex optimization [21] |
Performance Comparison and Quantitative Data
The performance characteristics of sandwich and competitive assays differ significantly in sensitivity, dynamic range, and applicability. Research on wheat allergen detection provides concrete examples of these differences.
Performance Metrics for Allergen Detection
The following table summarizes published performance data for both assay formats in food allergen analysis:
| Assay Format | Target Allergen | Detection Platform | Limit of Detection (LOD) | Dynamic Range | Reference |
|---|---|---|---|---|---|
| Sandwich | Wheat Gliadin (in milk) | AuNP-LFIA | Visual LOD: 25 ng/mLCalculated LOD: 6.56 ng/mL | Not specified | [20] |
| Sandwich | α-Lactalbumin (in formula) | Biotin-Streptavidin ELISA | LOD: 1.59 ng/mL | 61.04 ng/mL – 62.50 μg/mL | [23] |
| Competitive | Gluten (in raw materials) | AuNP-LFIA | Visual LOD: 20 ppm (∼20 μg/mL) | Not specified | [3] |
| Sandwich | Gluten | Commercial LFIA Kits (e.g., AgraStrip) | LOD: < 10 ppm (∼10 μg/mL) | Not specified | [3] |
The data demonstrates that sandwich assays generally achieve higher sensitivity (lower LOD) compared to competitive formats for allergen detection. The exceptional sensitivity of the α-lactalbumin sandwich ELISA can be attributed to the biotin-streptavidin amplification system, which significantly enhances the detection signal. [23] Furthermore, sandwich assays can exhibit an extensive dynamic range spanning several orders of magnitude, as evidenced by the three-log range achieved in the α-lactalbumin assay. [23]
Competitive assays, while potentially less sensitive, are perfectly suited for applications with defined threshold limits. For instance, the developed competitive LFIA for gluten meets the Codex Alimentarius standard of 20 ppm for gluten-free foods, providing a rapid, binary result suitable for on-site testing. [3] A key theoretical advantage of competitive assays is their immunity to the "hook effect", a phenomenon in sandwich assays where extremely high antigen concentrations saturate both capture and detection antibodies, leading to a false-negative signal. [21]
Detailed Experimental Protocols
Protocol: Sandwich LFIA for Wheat Gliadin Detection
This protocol is adapted from the work of Hu et al. for the rapid and on-site detection of wheat allergen in milk. [20]
Research Reagent Solutions
| Reagent/Material | Function/Description | Example/Specification |
|---|---|---|
| Anti-Gliadin mAb Pair | Capture (mAb 7) & Detection (mAb 6) antibodies for sandwich formation. [20] | Must recognize distinct, non-overlapping epitopes on gliadin. |
| Colloidal Gold Nanoparticles (AuNPs) | Visual reporter label for detection. [20] [3] | ~20 nm diameter, synthesized by citrate reduction. |
| Nitrate Cellulose Membrane | Porous matrix for capillary flow and antibody immobilization. | Pore size optimized for flow rate and binding capacity. |
| Sample Pad & Absorbent Pad | Sample application and fluid wicking. | Cellulose or glass fiber. |
| Conjugation Buffer | pH optimization for antibody-AuNP conjugation. [3] | Typically 20 mM Borax buffer, pH 8-9. |
| Blocking Buffer | Prevents non-specific binding on the membrane. | Phosphate buffer with 3-5% w/v BSA or sucrose. |
| Running Buffer | Facilitates sample flow and interaction. | PBS with 0.05% Tween-20 and protein stabilizers. |
Step-by-Step Procedure
AuNP-Antibody Conjugate Preparation:
- Synthesize ~20 nm colloidal gold nanoparticles using the citrate reduction method. [3] Characterize by UV-Vis spectroscopy (peak at ~523 nm) and FESEM. [3]
- Adjust the pH of the AuNP solution to 8.0 using 0.1 M K₂CO₃. This is critical for stabilizing the AuNP-antibody interaction. [3]
- Add the detection antibody (e.g., mAb 6) to the pH-adjusted AuNP solution at an optimized concentration (e.g., 1-10 μg/mL). Incubate for 1 hour at room temperature with gentle agitation. [20] [3]
- Block remaining active sites on the AuNPs with a stabilizing agent (e.g., BSA). Purify the conjugate by centrifugation and resuspend in a storage buffer containing sucrose. Dispense onto the conjugate pad and dry.
Strip Assembly:
- Test and Control Line Printing: Dispense the capture antibody (e.g., mAb 7) at a concentration of 1 mg/mL onto the nitrocellulose membrane to form the test line. Dispense a species-specific anti-immunoglobulin antibody to form the control line. Dry the membrane completely. [20]
- Membrane Stacking: Assemble the strip by sequentially overlapping the sample pad, conjugate pad (containing the dried AuNP-antibody conjugate), nitrocellulose membrane (with printed test and control lines), and absorbent pad on a backing card. [20]
Assay Execution:
Result Interpretation
- Positive Result: Both the test line and control line are visible. The intensity of the test line correlates with the gliadin concentration.
- Negative Result: Only the control line is visible.
- Invalid Result: The control line does not appear, indicating a faulty strip or incorrect procedure.
Protocol: Competitive LFIA for Small Allergens
This protocol outlines the development of a competitive LFIA, suitable for small allergenic peptides or molecules where a sandwich format is not feasible. [21]
Key Reagent Solutions
| Reagent/Material | Function/Description | Example/Specification |
|---|---|---|
| Anti-Allergen mAb | Single monoclonal antibody for target recognition. | High affinity and specificity for the target small molecule. |
| Analyte-Protein Conjugate | Competitor molecule immobilized on the test line. | Target analyte conjugated to a carrier protein (e.g., BSA, OVA). |
| Colloidal Gold Nanoparticles (AuNPs) | Visual reporter label. | ~20 nm diameter. |
| Secondary Antibody | For the control line. | e.g., Goat anti-mouse IgG, if mAb is mouse-derived. |
Step-by-Step Procedure
Conjugate Pad Preparation:
Strip Assembly:
- Test Line Printing: Immobilize the analyte-protein conjugate (the competitor) on the nitrocellulose membrane to form the test line. The concentration must be carefully optimized to achieve the desired sensitivity. [21]
- Control Line Printing: Immobilize a secondary antibody (e.g., anti-species IgG) to capture the free AuNP-labeled mAb, forming the control line.
- Assemble the strip components as described in the sandwich protocol.
Assay Execution:
- Apply the liquid sample to the sample pad. The target analyte in the sample and the immobilized competitor on the test line will compete for the limited binding sites on the AuNP-labeled mAb as they migrate. [21]
- Allow the strip to develop for the prescribed time (e.g., 15 minutes).
Result Interpretation
- Positive Result (Analyte present): The test line is faint or absent because the labeled antibody is bound to the sample analyte and cannot bind to the test line competitor. The control line must be visible.
- Negative Result (Analyte absent): Both the test line and control line are visible because the labeled antibody binds to the immobilized competitor on the test line.
- Invalid Result: The control line does not appear.
The selection between sandwich and competitive assay formats is a foundational decision in the development of a gold nanoparticle-based LFIA for wheat allergen research. For intact gliadin and other large protein allergens, the sandwich format offers superior sensitivity, an intuitive readout, and robust performance, as demonstrated by its successful application in detecting gliadin in milk with a LOD as low as 6.56 ng/mL. [20] Conversely, for small allergenic peptides, hydrolyzed proteins, or other single-epitope targets, the competitive format is indispensable, despite its counterintuitive signal interpretation and often lower sensitivity. [21] Mastery of both formats, including their underlying principles, optimization parameters, and limitations, empowers researchers to create highly effective diagnostic tools that enhance food safety and protect consumers with food allergies.
A Step-by-Step Protocol for Developing a Wheat Allergen LFIA
Synthesis and Characterization of Colloidal Gold Nanoparticles (20-40 nm)
Gold nanoparticles (AuNPs) in the 20-40 nm size range represent a critical material class for developing advanced diagnostic platforms due to their strong optical properties and biocompatibility. Within the context of wheat allergen research, specifically targeting gliadin, these AuNPs serve as exceptional signal transducers in lateral flow immunoassays (LFIAs). Their size-dependent optical cross-section provides the high sensitivity required for detecting trace allergens at concentrations mandated by food safety regulations, such as the Codex Alimentarius standard of 20 parts per million (ppm) for gluten-free products [2] [3]. This protocol details the synthesis, functionalization, and characterization of 20-40 nm AuNPs, framing them as essential components for constructing a robust LFIA for gliadin detection.
Synthesis of Monodisperse 40 nm Gold Nanoparticles
Seed-Mediated Growth Method
Seed-mediated growth is the preferred method for producing monodisperse 40 nm AuNPs with a narrow size distribution, offering superior control over final particle size [24] [25].
Experimental Protocol:
Seed Solution Preparation:
- Prepare a 20 mL aqueous solution containing 0.25 mM hydrogen tetrachloroaurate (HAuCl₄) and 0.25 mM trisodium citrate in a clean, glass vial.
- Under vigorous stirring, rapidly add 0.3 mL of a fresh, ice-cold 10 mM sodium borohydride (NaBH₄) solution.
- Continue stirring for 5 minutes. The solution will turn pale pink/orange, indicating the formation of 2-5 nm gold seeds. This seed solution can be stored for several hours at room temperature.
Growth Solution Preparation:
- In a round-bottom flask, add 40 mL of a 0.2 mM HAuCl₄ solution.
- Add 0.2 mL of 1.0 M hydrochloric acid (HCl) to adjust the pH.
- Introduce 0.04 mL of a 10% (w/v) solution of Tannic Acid and 0.24 mL of a 12.5 mM solution of Potassium Carbonate (K₂CO₃).
Particle Growth:
- Under constant stirring, add 0.08 mL of the previously synthesized seed solution to the growth solution.
- Allow the reaction to proceed at a controlled temperature of 25-30°C until the solution color stabilizes to a deep red (approximately 15-30 minutes).
- The growth can be halted by cooling the solution on ice.
Optimized Citrate Reduction Method
A modified Turkevich method can be tuned to reliably generate AuNPs in the 15-40 nm range [24].
Experimental Protocol:
Reaction Setup:
- Bring 50 mL of a 0.5 mM HAuCl₄ solution to a boil under vigorous stirring and reflux conditions.
- Rapidly add 1.0 mL of a 1% (w/v) trisodium citrate solution to the boiling gold salt solution.
- The solution will change color from pale yellow to deep red over several minutes.
Heating and Cooling:
- Continue boiling and stirring for 15 minutes to ensure complete reduction and Ostwald ripening for size focusing.
- Remove the heating mantle and allow the solution to cool to room temperature while stirring continues.
- To achieve the target 40 nm size, the citrate-to-gold ratio, temperature, and addition rate must be meticulously optimized for the specific setup [24].
Table 1: Comparison of Synthesis Methods for 40 nm AuNPs
| Parameter | Seed-Mediated Growth | Citrate Reduction (Optimized) |
|---|---|---|
| Mechanism | Two-step process: nucleation followed by controlled growth | Single-step, thermally-driven co-reduction |
| Size Control | Excellent; precise control via seed number and growth time | Good; achieved by tuning citrate:gold ratio and temperature |
| Size Dispersity | Narrow (PDI < 0.2 achievable) | Moderate to narrow |
| Typical Size Range | 10 - 100 nm | 15 - 40 nm |
| Primary Capping Agent | Variable (often citrate) | Citrate |
| Reproducibility | High with careful control | High with parameter standardization |
Characterization of Gold Nanoparticles
Rigorous characterization is critical to ensure batch-to-batch consistency and predictable performance in the LFIA. ASTM International standard E3269 provides guidelines for characterizing colloidal gold suspensions [26].
Experimental Protocols and Quantitative Data:
UV-Vis Spectroscopy:
- Protocol: Dilute the AuNP colloid appropriately with deionized water and measure the absorbance from 400 to 700 nm.
- Expected Data: A sharp Localized Surface Plasmon Resonance (LSPR) peak is characteristic of monodisperse, spherical particles. For 20 nm AuNPs, the peak is at ~523 nm [3], shifting to ~528 nm for 40 nm AuNPs [24]. The Full Width at Half Maximum (FWHM) of the peak indicates size dispersity.
Dynamic Light Scattering (DLS) and Zeta Potential:
- Protocol: Measure the hydrodynamic diameter and polydispersity index (PDI) of the AuNPs in their storage buffer. For zeta potential, dilute the sample in a low-ionic-strength solution.
- Expected Data: Citrate-capped 20 nm AuNPs have a hydrodynamic diameter of ~23 nm and a PDI of 0.1, indicating high monodispersity [3]. A zeta potential more negative than -30 mV indicates good colloidal stability.
Transmission Electron Microscopy (TEM):
- Protocol: Deposit a drop of diluted AuNP solution onto a carbon-coated copper grid, allow to settle, and wick away excess liquid. Image under appropriate acceleration voltage.
- Expected Data: TEM provides the core diameter and confirms spherical morphology. It is the gold standard for validating size measurements from DLS and UV-Vis.
Table 2: Characterization Parameters for 20 nm and 40 nm AuNPs
| Characterization Technique | Key Parameter | 20 nm AuNPs (Target) | 40 nm AuNPs (Target) |
|---|---|---|---|
| UV-Vis Spectroscopy | LSPR Peak (λmax) | 522 - 525 nm [3] | 527 - 531 nm [24] |
| FWHM | < 50 nm | < 60 nm | |
| Dynamic Light Scattering | Hydrodynamic Diameter | 22 - 25 nm [3] | 42 - 47 nm |
| Polydispersity Index (PDI) | < 0.2 [3] | < 0.2 [24] | |
| Zeta Potential | Surface Charge (in water) | < -35 mV [3] | < -35 mV |
| Transmission Electron Microscopy | Core Diameter | 20 ± 2 nm | 40 ± 3 nm |
The following workflow outlines the integrated process from synthesis to application in LFIA strip development:
Figure 1: Workflow for AuNP Synthesis and LFIA Integration.
Application in Lateral Flow Immunoassay for Wheat Allergen
The primary application within this thesis context is the development of a rapid, on-site LFIA for detecting wheat gliadin in food samples.
Conjugation of Anti-Gliadin Antibodies to 20 nm AuNPs
For LFIA, 20 nm AuNPs are often preferred due to their higher diffusion coefficients and efficient conjugation kinetics [3].
Experimental Protocol:
pH Optimization:
- Adjust the pH of the 20 nm AuNP solution to 8.0 using 0.1 M potassium carbonate (K₂CO₃). This is critical as it ensures the nanoparticle surface is optimally charged for electrostatic adsorption of antibodies without causing aggregation [3].
Antibody Conjugation:
Stabilization and Blocking:
- Add an aqueous solution of bovine serum albumin (BSA) to a final concentration of 1% (w/v) to block any remaining bare gold surface.
- Stir for an additional 30 minutes.
Purification:
- Centrifuge the conjugated AuNPs at 12,000 rpm for 20 minutes at 4°C to remove unbound antibodies and BSA.
- Carefully decant the supernatant and resuspend the red pellet in a storage buffer containing 10 mM Tris-HCl, 1% BSA, and 0.1% sodium azide, pH 8.0.
Quality Control:
- Characterize the conjugated AuNPs by UV-Vis. A successful conjugation is indicated by a red-shift of the LSPR peak from 523 nm to 526-529 nm and an increase in absorbance intensity [3].
LFIA Strip Assembly and Function
The assembled strip operates on a sandwich immunoassay principle.
Experimental Protocol:
Strip Configuration:
- Sample Pad: Pre-treat the cellulose sample pad with buffers to adjust sample pH and filter particulates.
- Conjugate Pad: Saturate the glass fiber conjugate pad with the purified anti-gliadin-AuNP conjugates and dry.
- Nitrocellulose Membrane: Dispense two lines:
- Test Line: Immobilize a second, capture anti-gliadin monoclonal antibody (e.g., mAb 7 [2]).
- Control Line: Immobilize a secondary antibody specific to the host species of the detection antibody.
- Absorbent Pad: Place at the distal end to wick the solution and maintain flow.
Assay Procedure:
- Apply 40 µL of the extracted food sample to the sample pad [2].
- Add running buffer to initiate the flow.
- The sample rehydrates the AuNP-antibody conjugates. If gliadin is present, it binds to the AuNP-antibody.
- The complex migrates and is captured at the test line by the immobilized antibody, forming a sandwich (AuNP-antibody-gliadin-antibody), resulting in a visible red line.
- The excess AuNP-antibody conjugates are captured at the control line, validating the test.
Table 3: Performance Metrics of Gliadin LFIA Using AuNPs
| Performance Metric | Value | Methodology / Note |
|---|---|---|
| Visual Limit of Detection (vLOD) | 25 ng/mL (in negative milk) [2] | Qualitative visual assessment |
| Calculated LOD | 6.56 ng/mL (in negative milk) [2] | Quantitative analysis of test line intensity |
| Detection Limit (Commercial Target) | 20 ppm (Codex standard) [3] | Corresponds to 20 µg/g of gluten |
| Assay Time | 15 minutes [2] [3] | From sample application to result |
| Assay Type | Sandwich Immunoassay | Utilizes two distinct monoclonal antibodies |
The following diagram illustrates the molecular detection mechanism on the LFIA strip:
Figure 2: LFIA Molecular Detection Mechanism.
The Scientist's Toolkit: Research Reagent Solutions
Table 4: Essential Materials for AuNP Synthesis and LFIA Development
| Reagent / Material | Function | Application Notes |
|---|---|---|
| Hydrogen Tetrachloroaurate (HAuCl₄) | Gold precursor for nanoparticle synthesis | Use high-purity grade; aqueous solution stability is limited, store as recommended. |
| Trisodium Citrate | Reducing and capping agent | Concentration and addition rate critically control final particle size in citrate synthesis. |
| Anti-Gliadin Monoclonal Antibodies | Specific recognition element for the target allergen | A matched pair (capture & detection) is required for a sandwich assay [2]. |
| Nitrocellulose Membrane | Porous matrix for antibody immobilization and fluid flow | Pore size and flow rate must be optimized for the specific assay. |
| Thiol-Polyethylene Glycol (SH-PEG) | AuNP surface passivation | Improves colloidal stability and reduces non-specific binding in complex matrices [24]. |
| Bovine Serum Albumin (BSA) | Blocking agent | Used to block residual binding sites on AuNPs and the membrane, minimizing background noise. |
| Lateral Flow Strip Components | Platform for the assay | Includes sample, conjugate, and absorbent pads. Assembly must ensure consistent capillary flow. |
Selection and Epitope Mapping of Anti-Gliadin Monoclonal Antibodies
Within the context of wheat allergen research, the selection and precise epitope mapping of anti-gliadin monoclonal antibodies (mAbs) constitute a critical foundational step. This process is paramount for developing robust and reliable detection assays, particularly gold nanoparticle (AuNP)-based lateral flow immunoassays (LFIAs). Gliadin, a primary immunotoxic component of gluten, is characterized by a complex protein structure rich in proline and glutamine, which complicates the development of antibodies with broad reactivity to its diverse epitopes [27] [3]. The identification of mAbs that specifically target clinically relevant, stable epitopes, such as the 33-mer peptide, ensures that diagnostic assays can accurately detect the pathogenic components of gluten that trigger conditions like celiac disease [27] [28]. This document provides detailed application notes and protocols for the selection and epitope characterization of anti-gliadin mAbs, framed specifically for their application in AuNP-LFIA development for wheat allergen detection.
Antibody Selection and Characterization
The generation of high-affinity, specific mAbs begins with careful immunogen design and a rigorous, multi-stage screening process to isolate lead candidates with the desired characteristics for LFIA development.
Immunogen Preparation and Animal Immunization
The goal is to elicit an antibody response against multiple pathogenic epitopes simultaneously. The 33-mer gliadin peptide, which contains several immunodominant epitopes (including DQ2.5-glia-α1a, DQ2.5-glia-α2, and DQ2.5-glia-α1b), serves as an ideal immunogen for this purpose [27].
- Procedure:
- Antigen Complex Formation: Recombinantly express and purify the HLA-DQ2.5 molecule. Complex it with the 33-mer gliadin peptide to form a peptide:HLA-DQ2.5 (pHLA-DQ2.5) immunogen. This structure can help focus the immune response on the native conformation of the epitopes [27].
- Animal Immunization: Immunize New Zealand White (NZW) rabbits with the recombinant HLA-DQ2.5:33mer gliadin complex. Use a standard immunization protocol involving primary immunization with Freund's Complete Adjuvant, followed by booster injections with Freund's Incomplete Adjuvant [27] [2].
- B Cell Isolation: Following immunization, harvest splenocytes or peripheral blood B cells from the immunized animals for hybridoma generation [27].
Primary Screening and Cross-Reactivity Analysis
The initial screening aims to identify a large pool of mAb candidates that bind the immunogen, followed by a critical cross-reactivity assessment to narrow down the leads.
- Materials:
- Ba/F3 cell panels expressing a variety of pHLA-DQ2.5 complexes (including at least 29 distinct gluten epitopes) [27].
- Cell lines expressing other HLA-II molecules (e.g., HLA-DR, HLA-DQ variants) to test for off-target binding [27].
- Primary human B cells from HLA-DQ2.5-positive and negative donors [27].
Procedure:
- High-Throughput Screening: Screen over 40,000 antibody supernatants from B cell cultures for binding to the immunogen (HLA-DQ2.5:33mer) using flow cytometry or ELISA [27].
- Cross-Reactivity Profiling: Test the positive hits for binding to the extensive panel of Ba/F3 cells expressing distinct gluten pHLA-DQ2.5. The ideal lead antibody should demonstrate broad reactivity to numerous pathogenic gluten epitopes while showing minimal binding to non-gluten pHLA-DQ2.5 (e.g., those loaded with human CLIP, HBV, salmonella, or TPO peptides) [27].
- Specificity Confirmation: Validate the specificity of lead antibodies using primary human B cells. The antibody should only bind to HLA-DQ2.5+ B cells when the 33mer gliadin peptide is exogenously loaded, confirming that it does not recognize endogenous peptide complexes [27].
Representative Data: The following table summarizes the idealized binding profile of a broadly reactive, lead anti-gliadin mAb, as exemplified by antibodies like DONQ52 [27]:
Table 1: Example Broadly Reactive Anti-Gliadin mAb Binding Profile
| Target Category | Specific Target Examples | Observed Binding |
|---|---|---|
| Pathogenic Gluten pHLA-DQ2.5 | DQ2.5-glia-α1a, -α2, -ω1, -ω2; DQ2.5-hor-3a; >25 distinct epitopes | Positive [27] |
| Non-Gluten pHLA-DQ2.5 | Human CLIP, Hepatitis B Virus, Salmonella, Mycobacterium bovis, Thyroid Peroxidase | No substantial binding [27] |
| Other HLA-II Molecules | HLA-DR, other HLA-DQ alleles | No substantial binding [27] |
Antibody Engineering for Enhanced Function
Lead mAbs from animal immunization may require protein engineering to improve their function and suitability as therapeutics or diagnostic reagents.
- Procedure:
- Humanization: Humanize the variable regions of the lead rabbit mAbs to reduce immunogenicity for potential clinical applications [27].
- Affinity Maturation: Employ techniques such as site-directed mutagenesis or phage display to generate and screen mutant libraries for variants with enhanced affinity and cross-reactivity [27].
- Formatting for LFIA: For LFIA development, the variable regions of a pair of complementary mAbs can be formatted into a bi-specific IgG. This involves engineering the interface residues of the heavy and light chains to ensure correct pairing. Furthermore, the Fc region can be engineered to reduce binding to Fc gamma receptors and complement C1q, thereby eliminating effector functions that are unnecessary for diagnostics [27].
Epitope Mapping and Structural Analysis
Understanding the precise region on the gliadin peptide that an antibody recognizes (its epitope) is crucial for explaining its cross-reactivity profile and diagnostic utility.
Defining the Core Epitope
A primary goal is to identify the minimal peptide sequence required for antibody binding.
- Materials:
- A series of synthetic gliadin peptides with systematic N- and C-terminal truncations.
- Peptides with single-point alanine (or other amino acid) substitutions.
- Platform for binding analysis (e.g., ELISA, surface plasmon resonance).
- Procedure:
- Truncation Analysis: Test antibody binding against the series of truncated peptides. The shortest peptide that retains full binding capacity defines the core epitope region.
- Alaninine Scanning Mutagenesis: Within the core epitope, systematically replace each residue with alanine and test antibody binding. A significant loss of binding upon substitution of a specific residue identifies it as a critical "hot spot" for the antibody-antigen interaction [27].
- Key Epitope Motif Identification: For gliadin, the proline-rich and glutamine-rich motif (e.g., PQPQLPY) is often the critical pathogenic sequence targeted by mAbs. The G12 antibody, for instance, specifically targets the sequence PQPQLPY, a highly immunotoxic epitope in celiac disease [3].
Structural Characterization of the Antibody-Antigen Complex
For a mechanistic understanding of broad reactivity, structural biology techniques are employed.
- Procedure:
- Crystallography: Co-crystallize the Fab fragment of the mAb with its gliadin peptide antigen (often in complex with the HLA-DQ2.5 molecule). Solve the three-dimensional structure using X-ray crystallography [27].
- Paratope Analysis: Analyze the antibody paratope (the antigen-binding site). For example, the broadly reactive antibody DONQ52 uses multiple tyrosine residues in its paratope to flexibly recognize the shared proline-rich and glutamine-rich motif present across diverse gluten epitopes. This structural plasticity allows a single antibody to engage with more than twenty-five distinct gluten pHLA-DQ2.5 complexes [27].
Figure 1: Workflow for the selection and epitope mapping of anti-gliadin monoclonal antibodies.
Application in Gold Nanoparticle-Based Lateral Flow Immunoassay
The selected and characterized mAbs are functionalized for deployment in a sensitive and specific AuNP-LFIA.
Conjugation of mAb to Gold Nanoparticles
The conjugation process is critical for maintaining antibody functionality and assay stability.
- Materials:
- Monodisperse, spherical gold nanoparticles (AuNPs), ~20-30 nm in diameter [3].
- Purified anti-gliadin monoclonal antibody.
- Conjugation buffer (e.g., 20 mM Borax, pH 8-9).
- Blocking buffer (e.g., PBS with 1% BSA or sucrose).
- Centrifugation equipment.
- Procedure:
- pH Optimization: Adjust the pH of the AuNP colloidal solution to 8.0-9.0 using a weak base (e.g., 0.1 M K₂CO₃). This is the optimal range for antibody adsorption to the gold surface while preventing nanoparticle aggregation [3].
- Antibody Concentration Optimization: Incubate the pH-adjusted AuNPs with varying concentrations of the mAb (e.g., 0-8 µg/mL) for 1 hour at room temperature. Add 1.5 M NaCl to stress the solution. The optimal antibody concentration is the lowest that prevents a color change from red to purple/blue, indicating stable conjugation and resistance to salt-induced aggregation [3].
- Conjugation and Blocking: Incubate the AuNPs with the optimal concentration of the mAb for 1 hour. Block remaining AuNP surfaces by adding blocking buffer and incubating for another 30-60 minutes.
- Purification: Centrifuge the conjugated AuNPs to remove unbound antibodies and resuspend them in a suitable storage buffer (e.g., PBS with stabilizers) [3].
LFIA Strip Assembly and Testing
The conjugated AuNPs are integrated into a lateral flow strip.
- Materials:
- LFIA components: Sample pad, conjugate pad, nitrocellulose membrane, absorbent pad, backing card.
- Capture reagents: Test line (second anti-gliadin mAb, different epitope), Control line (anti-species IgG).
- Strip cutter and housing.
Procedure:
- Strip Preparation: Dispense the capture mAb (e.g., mAb 7 from the paired set) on the test line and a control antibody on the control line of the nitrocellulose membrane [2].
- Curing: Dry the membrane and other pads completely.
- Assembly: Laminate the sample pad, conjugate pad (pre-loaded with the AuNP-mAb conjugate), nitrocellulose membrane, and absorbent pad onto a backing card. Cut into individual strips [2] [3].
- Performance Evaluation:
- Sensitivity: Test the strip with a series of known gluten/gliadin concentrations (e.g., 0, 10, 20, 40, 70 ppm). The visual limit of detection (vLOD) is the lowest concentration producing a visible test line. For quantitative analysis, use a reader [2] [3].
- Specificity: Confirm no cross-reactivity with other common food allergens or non-target proteins.
Representative Data: The performance metrics of a well-optimized AuNP-LFIA for gliadin are summarized below:
Table 2: Typical Performance Metrics of an Anti-Gliadin AuNP-LFIA
| Parameter | Performance Value | Reference |
|---|---|---|
| Visual Limit of Detection (vLOD) | 6.56 - 25 ng/mL (in buffer/milk) | [2] |
| Calculated LOD | 6.56 ng/mL (in milk) | [2] |
| Codex Alimentarius Threshold | 20 ppm (20 mg/kg) gluten | [3] |
| Assay Time | 5 - 15 minutes | [29] [3] |
| Detection Format | Sandwich immunoassay | [2] [3] |
Figure 2: Architecture and result interpretation of a sandwich AuNP-LFIA for gliadin detection.
The Scientist's Toolkit: Key Research Reagent Solutions
The following table lists essential materials and their specific functions in the development and deployment of anti-gliadin mAbs and subsequent AuNP-LFIAs.
Table 3: Essential Reagents for Anti-Gliadin mAb and AuNP-LFIA Development
| Research Reagent / Material | Function and Role in Development |
|---|---|
| HLA-DQ2.5:33mer Gliadin Complex | Used as an immunogen to elicit a broad-spectrum antibody response against multiple immunodominant gliadin epitopes simultaneously [27]. |
| Ba/F3 Cell Panel (pHLA-DQ2.5) | A critical screening tool comprising cells expressing over 25 distinct gluten and non-gluten pHLA-DQ2.5 complexes to profile antibody cross-reactivity and specificity [27]. |
| Gliadin Monoclonal Antibody (e.g., G12) | A well-characterized mAb that specifically targets the immunotoxic 33-mer peptide epitope (e.g., PQPQLPY); used as a capture or detection antibody in standardized assays [3]. |
| Spherical Gold Nanoparticles (20-30 nm) | Function as the optical label in LFIA. Their aggregation or accumulation at the test line produces a red color, enabling visual or instrumental detection [3] [30]. |
| Nitrocellulose Membrane | The porous matrix in an LFIA strip where the immunochromatographic separation occurs and the test/control lines are immobilized [31]. |
| Lateral Flow Reader (e.g., AgraVision) | An optional, quantitative instrument that measures the color intensity at the test line, converting it into a quantitative analyte concentration [29] [32]. |
Within the development of a gold nanoparticle (AuNP)-based lateral flow immunoassay (LFIA) for wheat allergen detection, the stability and functionality of the AuNP-antibody conjugate are paramount. This conjugate serves as the critical detection probe, where its performance directly dictates the sensitivity, specificity, and reliability of the entire assay. Unsatisfactory conjugation can lead to nanoparticle aggregation, inadequate antigen binding, and ultimately, assay failure. This application note provides a detailed, step-by-step protocol for optimizing two of the most crucial parameters in conjugate preparation: pH and antibody concentration, to ensure the formation of stable and highly functional AuNP-probes for gluten detection [33] [34].
Experimental Protocols
Reagent Preparation
- Gold Nanoparticles (AuNPs): Synthesize spherical citrate-reduced AuNPs with an average diameter of approximately 20-24 nm, as confirmed by Field Emission Scanning Electron Microscopy (FESEM) or Atomic Force Microscopy (AFM) [33] [34]. The characteristic UV-Vis absorption peak should be between 520-523 nm for unconjugated AuNPs.
- Antibody Solution: Prepare a stock solution of the gliadin-specific monoclonal antibody in deionized water.
- pH Adjustment Solutions: Prepare 0.1 M or 0.2 M solutions of potassium carbonate (K₂CO₃) and hydrochloric acid (HCl) for fine-tuning pH.
- Salt Challenge Solution: Prepare a 10% (w/v) or 1.5 M sodium chloride (NaCl) solution in deionized water.
- Conjugation Buffer: Although not specified in the search results, standard practice often uses low-salt buffers like 2-(N-morpholino)ethanesulfonic acid (MES) for pH 6-7 or Tris/HCl for pH 8-9 to avoid premature aggregation.
Optimization of Conjugation pH
The pH of the conjugation environment critically affects the electrostatic interaction between the AuNP surface and the antibody molecules. An incorrect pH can lead to insufficient binding or nanoparticle aggregation.
- Sample Preparation: Aliquot 1 mL of the synthesized AuNP solution into a series of 1.5 mL microcentrifuge tubes.
- pH Adjustment: Gradually adjust the pH of each aliquot across a range from 6.0 to 9.0 using the prepared K₂CO₃ or HCl solutions. Record the final pH for each tube.
- Antibody Addition: Add a fixed, preliminary quantity of the gliadin antibody (e.g., 1 µg) to each pH-adjusted AuNP aliquot.
- Incubation: Allow the mixtures to incubate at room temperature for 30-45 minutes with gentle agitation.
- Salt Challenge Test: To assess conjugate stability, add a fixed volume of the 10% NaCl solution to each tube. Stable, well-conjugated AuNPs will resist aggregation and maintain a red color, while unstable conjugates will turn blue/purple due to aggregation.
The optimal pH is identified as the condition that prevents color change upon salt addition, indicating successful antibody binding and stabilization. Research on gluten LFIAs has identified pH 8.0 as the optimal value for this conjugation [33] [34].
Determination of Optimal Antibody Concentration
Using the optimal pH determined in Section 2.2, the minimum amount of antibody required to fully stabilize the AuNPs is determined. This ensures cost-effectiveness and prevents antibody-induced aggregation.
- Sample Preparation: Aliquot a series of 1 mL volumes of AuNP solution and adjust each to the optimal pH of 8.0.
- Antibody Titration: Add varying volumes of the antibody stock solution to the aliquots to create a concentration series. The provided research indicates testing a range from 0 to 8 µg/mL is effective [34].
- Incubation: Incubate the mixtures for 30-45 minutes at room temperature.
- Stability Assessment: Perform the salt challenge test by adding NaCl to each tube. The optimal antibody concentration is the lowest concentration that prevents a color shift from red to purple upon salt addition. Studies have found this to be 1 µg/mL of antibody under these conditions [33] [34].
Table 1: Summary of Quantitative Optimization Data from Gluten LFIA Development
| Parameter | Tested Range | Optimal Value | Method of Assessment | Observation at Optimal Condition |
|---|---|---|---|---|
| Conjugation pH | 6.0 - 9.0 | 8.0 | Salt challenge (1.5 M NaCl) | No color change (red remains); UV-Vis peak shift to ~526-529 nm [34] |
| Antibody Concentration | 0 - 8 µg/mL | 1 µg/mL | Salt challenge (1.5 M NaCl) | No color change (red remains); Increased UV-Vis absorbance and redshift [33] [34] |
| AuNP Size (Pre-conjugation) | — | ~20-24 nm | FESEM/AFM & DLS | Spherical morphology; Hydrodynamic diameter ~23-25 nm [33] [34] |
| AuNP Size (Post-conjugation) | — | ~23.5-40 nm | FESEM/AFM & DLS | Hydrodynamic diameter increase confirms protein adsorption [33] [34] |
Final Conjugation and Purification
- Bulk Conjugation: Scale up the conjugation reaction using the optimized pH and antibody concentration parameters. Incubate the mixture for a minimum of 1 hour at room temperature with slow stirring.
- Stabilization and Blocking: Add a blocking agent (e.g., 1% Bovine Serum Albumin or casein) to passivate any remaining reactive sites on the AuNP surface. Incubate for an additional 30 minutes.
- Purification: Centrifuge the conjugated AuNP probes to remove unbound antibodies and blocking agents. Gently resuspend the pellet in a storage buffer containing a stabilizer (e.g., sucrose, BSA) and a preservative.
- Characterization: Validate the final conjugate using UV-Vis spectroscopy to confirm the expected redshift in the absorption peak and dynamic light scattering to measure the increased hydrodynamic diameter.
The Scientist's Toolkit: Research Reagent Solutions
Table 2: Essential Materials for AuNP-Probe Conjugation
| Item | Function / Role in Conjugation |
|---|---|
| Citrate-reduced AuNPs (~20-24 nm) | Plasmonic reporter; provides the visual signal (red color) in the LFIA strip [34]. |
| Gliadin Monoclonal Antibody | Detection reagent; specifically binds to the target gliadin allergen [33] [34]. |
| Potassium Carbonate (K₂CO₃) / HCl | Used for precise pH adjustment of the AuNP solution prior to antibody addition [34]. |
| Sodium Chloride (NaCl) | Used in the salt challenge test to evaluate the stability of the antibody-AuNP conjugates [33] [34]. |
| Bovine Serum Albumin (BSA) | Blocking agent; passivates the surface of AuNPs after conjugation to prevent nonspecific binding [34]. |
| Ultrafiltration Devices / Centrifuges | For purifying the final conjugate by removing excess, unbound antibodies and reagents. |
Workflow and Data Interpretation
The following diagram illustrates the logical workflow for the optimization process and the interpretation of results.
AuNP-Probe Optimization Workflow
Application in Gluten Allergen Detection
The implementation of this optimized conjugation protocol is central to the performance of the LFIA. In a sandwich-style assay for the wheat allergen gliadin, the AuNP-probe binds to gliadin in the sample. This complex then migrates along the strip and is captured at the test line by a second, immobilized anti-gliadin antibody, generating a visible red line. A stable and properly conjugated probe is essential for achieving a low limit of detection. Research has demonstrated that using probes conjugated at pH 8.0 with an antibody concentration of 1 µg/mL enables the detection of gliadin at levels as low as 0.04 mg/kg, far exceeding the regulatory requirement of 20 mg/kg for "gluten-free" labels [33]. This high sensitivity allows for the reliable identification of hidden gluten in food samples, providing a crucial tool for protecting individuals with celiac disease.
The meticulous optimization of pH and antibody concentration is not a mere suggestion but a fundamental requirement for fabricating robust AuNP-based lateral flow assays. By systematically following the protocols outlined in this document—specifically, conjugating at pH 8.0 with an antibody concentration of 1 µg/mL for a 20-24 nm AuNP system—researchers can consistently produce stable and highly sensitive immunoprobes. This reliable conjugation forms the foundation for developing accurate and effective point-of-care diagnostics for wheat allergen detection and beyond.
Nitrocellulose (NC) membranes serve as the critical solid-phase matrix in lateral flow immunoassays (LFIAs), providing the substrate for capillary flow and the immobilization of capture reagents. In the context of developing a gold nanoparticle (AuNP)-based lateral flow immunoassay for wheat allergen detection, membrane selection directly impacts assay performance, including detection limit, specificity, and reproducibility. The porous structure of nitrocellulose facilitates the passive transport of liquid samples and AuNP-conjugated antibodies via capillary action, while its high protein-binding capacity enables the effective immobilization of capture antibodies at test and control lines. The pore size and flow dynamics within this matrix are therefore fundamental parameters that require precise optimization to achieve reliable detection of gluten proteins, particularly gliadin, in complex food matrices.
Core Principles: Pore Size and Capillary Flow
Membrane Pore Size Characteristics
The pore size of a nitrocellulose membrane is a primary determinant of its performance, influencing both the capillary flow rate and the surface area available for protein binding. Commercially available NC membranes for LFIAs typically feature pore sizes ranging from approximately 0.05 µm to 25 µm [35]. For the specific application of wheat allergen detection, membranes with pore sizes around 0.45 µm are often optimal, as exemplified by the Unisart CN95 membrane, which possesses a 0.45 µm pore size, a thickness of 130 µm, and is designed for high homogeneity and low background in immunoassays [36] [35]. This pore size provides an effective balance, offering a high surface area for antibody immobilization while maintaining a flow rate suitable for efficient immunoreactions.
Table 1: Key Characteristics of a Representative 0.45 µm Nitrocellulose Membrane
| Parameter | Specification | Functional Significance |
|---|---|---|
| Pore Size | 0.45 µm | Balances high protein binding capacity with manageable flow rate for proteins >10 kDa [36]. |
| Membrane Thickness | 130 µm | Standard thickness providing structural integrity for handling and consistent flow paths [36]. |
| Roll Width | 300 mm | Compatible with automated dispensing and cutting equipment for large-scale production [36]. |
| Wettability | Hydrophilic | Ensures spontaneous capillary action without the need for pre-treatment [36]. |
Fundamentals of Capillary Flow Dynamics
Capillary flow in porous membranes is governed by the Washburn equation, which describes how the flow distance is proportional to the square root of time. The flow rate is inherently highest at the beginning of the strip and decreases as the fluid fronts advance [37]. The dynamics are influenced by the membrane's microstructure, including pore size distribution, porosity, and surface chemistry. A uniform pore structure, as found in high-quality NC membranes, is crucial for achieving a consistent and reproducible flow front, which directly translates to uniform reagent mixing and binding, and ultimately, more reliable test lines [36]. Any significant variation in pore size can lead to non-uniform flow paths, affecting the dissolution of conjugated antibodies, their mixing with the analyte, and the efficiency of the immunoreaction at the test line.
Experimental Protocols for Flow Dynamics Analysis
Protocol 1: Quantitative Analysis of Capillary Flow Rate
This protocol outlines a method to characterize the baseline capillary flow performance of a nitrocellulose membrane, which is a prerequisite for any subsequent flow control modifications.
Materials:
- Nitrocellulose membrane strips (e.g., 4 mm width x 40 mm length)
- Glass slide (75 mm x 25 mm) and double-sided tape
- Deionized (DI) water with a visible dye (e.g., 1.25% w/w red food dye)
- Digital camera mounted on a stable stand
- Pipette and timer
- Video analysis software (e.g., Tracker)
Procedure:
- Strip Preparation: Adhere the nitrocellulose membrane strip onto a glass slide using double-sided tape. Ensure the strip is perfectly horizontal.
- Fluid Introduction: Pipette 40 µL of the dyed DI water onto the loading pad of the strip.
- Video Recording: Simultaneously start the timer and begin recording a high-resolution video of the strip as the fluid migrates.
- Data Extraction: Use video analysis software to track the position of the leading edge of the liquid front over time.
- Data Analysis: Plot the imbibition distance (mm) against the square root of time (s1/2). The slope of the linear region of this plot provides a quantitative measure of the capillary flow velocity [37].
Protocol 2: Controlling Flow Using Tape Lamination
This protocol details a facile method to modulate the capillary flow rate on nitrocellulose by applying a polymer tape overlay, a technique shown to significantly reduce flow rates.
Materials:
- Nitrocellulose membrane strips (as in Protocol 1)
- Polymer tape (e.g., Scotch MagicTM Tape, contact angle ~88.8°)
- Ruler and sharp blade for cutting tape
Procedure:
- Baseline Measurement: First, perform Protocol 1 on a pristine nitrocellulose strip to establish the baseline flow rate.
- Tape Application: Cut a piece of tape to the desired length and carefully laminate it onto the surface of a new nitrocellulose strip, ensuring no air bubbles are trapped.
- Flow Rate Measurement: Repeat Protocol 1 on the taped strip.
- Data Comparison: Calculate the percentage change in flow rate. Research has demonstrated that covering the surface of a nitrocellulose membrane with tape can reduce the average flow rate to 61% of the original, untaped value [37].
- Parameter Investigation: Experiment with different tape lengths and placements. Studies indicate that a longer tape leads to a greater flow reduction, and the effect is more pronounced when the tape is placed closer to the loading pad [37].
Protocol 3: Implementing Delaminating Timers for Sequential Flow
For complex assays requiring the timed release of multiple reagents, this protocol describes the creation of "timers" using water-insoluble ink to programmatically delay flow.
Materials:
- Nitrocellulose membrane laminated with a polymer sheath tape
- Two types of water-insoluble ink markers: one "delaminating" and one "non-delaminating" (more hydrophobic)
- Precision ruler
Procedure:
- Channel Patterning: Use the non-delaminating ink to draw the hydrophobic boundaries of the flow channel on the naked nitrocellulose.
- Timer Imprinting: Within the channel, imprint discrete lines perpendicular to the flow direction using the delaminating ink. These are the timers.
- Lamination: Laminate the imprinted membrane with the polymer sheath tape.
- Timer Characterization: Introduce a dyed sample. The flow will stop at the timer line. The delay is caused by the time required for a void to form via delamination of the tape from the wetted, ink-infused paper. The width of the timer directly controls the delay duration; for instance, a 0.5-mm-wide timer can create a ~38-second delay, while a 3-mm-wide timer can create a ~23-minute delay [38].
- Assay Design: For a linear and more predictable total delay, multiple identical timers can be cascaded in series. The total delay is then a linear function of the number of timers, simplifying manufacturing and calibration [38].
Data Presentation and Analysis
Table 2: Experimental Data on Capillary Flow Control Methods
| Control Method | Key Parameter | Effect on Flow Rate/Time | Application in Assay Design |
|---|---|---|---|
| Tape Lamination | Full surface cover | Decrease to 61% of original rate [37] | Slows assay to increase immunoreaction incubation time. |
| Delaminating Timer | Timer width (0.5 mm) | Introduces delay of ~38 seconds [38] | Creates a short pause for a specific reaction step before flow resumes. |
| Delaminating Timer | Timer width (3.0 mm) | Introduces delay of ~23 minutes [38] | Programs a long delay for extended incubation or multi-step procedures. |
| Cascaded Timers | Number of timers (e.g., 5x) | Linear increase in total delay (5x the single-timer delay) [38] | Provides a reproducible and scalable method for introducing precise delays. |
The Scientist's Toolkit: Essential Research Reagents and Materials
Table 3: Key Research Reagent Solutions for AuNP-based LFIA Development
| Item | Function/Description | Application Note |
|---|---|---|
| Nitrocellulose Membrane | Porous matrix for capillary flow and immobilization of capture antibodies. | Select a 0.45 µm pore size membrane (e.g., Unisart) for optimal balance of flow and binding capacity for gliadin detection [36]. |
| Gold Nanoparticles (AuNPs) | Label for detection antibodies; provide red color at test line. | Spherical ~20 nm AuNPs are commonly used; conjugated to anti-gliadin monoclonal antibodies [2] [3]. |
| Anti-Gliadin mAbs | Capture and detection antibodies for the specific identification of gliadin. | A matched pair (e.g., mAb 7 for capture, mAb 6 for detection) is required for a sandwich assay format [2]. |
| Polymer Sheath Tape | Laminating tape used to control flow via delamination or by modifying air fluidic resistance. | Integral for constructing delaminating timers and for general strip assembly [38] [37]. |
| Water-Insoluble Inks | Used to create hydrophobic barriers and programmable "timer" elements on the membrane. | A less hydrophobic ink is used for delaminating timers, and a more hydrophobic one for permanent channel boundaries [38]. |
Workflow and Signaling Pathway Visualization
The lateral flow immunoassay (LFIA) is a robust, paper-based diagnostic platform that allows for the rapid, on-site detection of target analytes. It operates on the principle of capillary action, which drives the liquid sample through a series of specialized pads where specific immunochemical reactions occur, resulting in a visually detectable signal, typically within minutes [39] [40]. Due to its simplicity, low cost, and minimal requirement for user training, LFIA has become a cornerstone technology in point-of-care testing, clinical diagnostics, food safety, and environmental monitoring [41]. In the context of food allergen research, such as the detection of wheat gliadin, the LFIA format provides an effective and reliable tool for the rapid and on-site screening of allergens in complex food matrices like milk, with visual detection limits as low as 25 ng/mL [2]. The core of this technology lies in the precise assembly and functional integration of its four primary components: the sample pad, conjugate pad, membrane, and absorbent pad.
The Four Core Components of a Lateral Flow Strip
A lateral flow strip is a multi-layered analytical device assembled on a backing card that provides structural support. Figure 1 illustrates the typical architecture and workflow of a sandwich format LFIA, which is commonly used for detecting larger molecules like allergens and pathogens.
Figure 1. Schematic diagram of a gold nanoparticle-based lateral flow immunoassay in a sandwich format. The sample liquid moves by capillary action from the sample pad through the conjugate pad, where the target analyte binds to the antibody-labeled AuNPs. The complex then flows across the membrane, where it is captured at the test line, generating a visible signal. The control line validates the assay functionality. The absorbent pad wicks the fluid and maintains flow.
Sample Pad
The sample pad is the point of entry for the liquid sample. Its primary function is to receive the applied sample and ensure its controlled and uniform flow onto the subsequent sections of the strip [40] [42].
- Function: To filter out particulate matter and adjust the sample properties (e.g., pH, viscosity) to be compatible with the immunoassay reagents. Pretreatment of the sample pad with buffers, blocking agents (e.g., PVP, PVA), and surfactants can significantly improve assay sensitivity and flow characteristics [40].
- Material: Common materials include cellulose, glass fiber, or non-woven fabrics, selected for their rapid wicking and sample distribution properties [40].
Conjugate Pad
The conjugate pad stores the labeled detection reagent, which is typically a monoclonal antibody specific to the target analyte (e.g., gliadin) conjugated to gold nanoparticles (AuNPs) [2] [40].
- Function: To release the AuNP-antibody conjugates uniformly upon contact with the liquid sample. The conjugate then binds to the target analyte present in the sample, forming a colored complex that migrates along the strip [39].
- Material: Materials such as glass fiber, polyester, or rayon are commonly used because they allow for even rehydration and release of the conjugate [40]. The pad is often pretreated with sugars, proteins, and surfactants to stabilize the conjugate during storage [40].
Membrane
The membrane, typically made of nitrocellulose, is the critical zone where the analytical result is generated.
- Function: To facilitate the capillary flow of the sample and host the immobilized capture reagents. The test line (T-line) is coated with a second monoclonal antibody that captures the target analyte-AuNP-antibody complex, forming a visible colored line. The control line (C-line) is coated with a secondary antibody (e.g., anti-species IgG) that captures any free AuNP-antibody conjugates, validating the test functionality [39] [2] [40].
- Material: Nitrocellulose is preferred due to its high protein-binding capacity and consistent capillary flow characteristics. The membrane's pore size and capillary flow rate are critical parameters that must be optimized for each specific assay to ensure adequate interaction time between the analyte and the capture antibodies [39] [40].
Absorbent Pad
The absorbent pad is located at the distal end of the strip.
- Function: To act as a sink for the liquid sample, thereby maintaining a consistent capillary flow across the entire strip and preventing backflow, which could lead to high background or false-positive results [39] [40] [42].
- Material: It is usually composed of materials with high fluid capacity, such as cellulose or filter paper [40].
Table 1: Summary of Lateral Flow Strip Components and Their Functions
| Component | Primary Function | Common Materials | Key Considerations |
|---|---|---|---|
| Sample Pad | Receives sample; filters particulates; adjusts pH/viscosity | Cellulose, Glass Fiber | Often pre-treated with buffers, blockers, and surfactants to optimize sample flow and reaction conditions [40]. |
| Conjugate Pad | Stores and releases AuNP-Ab conjugates | Glass Fiber, Polyester, Rayon | Must allow even rehydration and release; conjugate is typically dispensed quantitatively for consistency [40]. |
| Membrane | Site of immunoreaction; contains test and control lines | Nitrocellulose | Pore size and capillary flow rate are critical for sensitivity and must be optimized [39] [40]. |
| Absorbent Pad | Wicks fluid to maintain and terminate flow | High-density Cellulose | Prevents backflow; sufficient capacity is needed to handle the total sample volume [39] [40]. |
Advanced Configuration: The Stacking Pad Design
To enhance the sensitivity of a conventional LFIA without adding complex steps, an advanced "stacking pad" configuration can be implemented. This design incorporates an additional pad between the conjugate pad and the nitrocellulose membrane [42].
- Principle: The stacking pad acts analogously to a stacking gel in polyacrylamide gel electrophoresis, by accumulating and concentrating the antibody-antigen complexes. This extends the interaction time between the target analyte and the AuNP-antibody conjugates, leading to a higher density of the complex reaching the test line and a stronger signal [42].
- Impact: Research has demonstrated that incorporating a thin (0.5 mm) cellulose-based stacking pad can enhance the colorimetric signal intensity at the test line by almost two-fold for the detection of Protein A, significantly lowering the visual limit of detection [42]. The material and thickness of the stacking pad are critical, with cellulose proving more effective than polyester or glass fiber for this specific application [42].
Experimental Protocol for LFIA Assembly and Optimization for Wheat Allergen Detection
This protocol details the steps for assembling and optimizing a lateral flow strip specifically for the detection of wheat gliadin, based on established methodologies [2] [40].
Materials and Reagents
Table 2: Research Reagent Solutions for Gold Nanoparticle-Based LFIA
| Reagent / Material | Function / Description | Example / Specification |
|---|---|---|
| Anti-Gliadin mAb Pair | Capture (mAb 7) and Detection (mAb 6) antibodies for gliadin [2]. | Monoclonal antibodies are essential for high specificity and assay reproducibility [2]. |
| Colloidal Gold Nanoparticles | Label for visual detection. | 40 nm diameter; can be synthesized by citrate reduction or sourced commercially [40]. |
| Nitrocellulose Membrane | Matrix for immobilizing capture antibodies. | e.g., GE Whatman Immunopore or AE membranes; selection depends on desired flow rate [40]. |
| Backing Card | Platform for assembling strip components. | Pre-coated with pressure-sensitive adhesive (PSA) compatible with IVDs [40]. |
| Phosphate Buffered Saline (PBS) | Base for running and conjugation buffers. | Low ionic strength, neutral pH (e.g., 0.01 M PBS, pH 7.4) [40]. |
| Blocking Agents | Reduce non-specific binding. | Bovine Serum Albumin (BSA), Polyvinylpyrrolidone (PVP), or sucrose [40]. |
| Surfactants | Improve sample flow and conjugate release. | Tween 20 or Triton X-100 [40]. |
Step-by-Step Procedure
Step 1: Conjugation of Antibodies to Gold Nanoparticles (AuNPs)
- pH Optimization: Determine the optimal pH for adsorbing the anti-gliadin detection antibody (mAb 6) onto the AuNPs. This is typically done by testing adsorption across a range of pH values to prevent precipitation [40].
- Conjugation: Adjust the AuNP sol to the optimal pH. Add the minimal amount of antibody required to fully coat the nanoparticle surfaces under gentle stirring. Incubate for a set time (e.g., 30 minutes) [40].
- Stabilization: Block the remaining surfaces of the AuNPs by adding a blocking agent like BSA or aqueous PEG to prevent non-specific binding [40].
- Purification: Centrifuge the conjugate to remove unbound antibodies and resuspend the pellet in a storage buffer containing sucrose, BSA, and a surfactant [40].
Step 2: Preparation of the Conjugate Pad
- Pretreat the glass fiber or polyester pad by immersing it in a stabilizing solution (e.g., containing sucrose, Triton X-100, and BSA) and then drying completely [40].
- Dispense the AuNP-antibody conjugate onto the pretreated pad uniformly using an aerosol dispensing system (e.g., BioDot AirJet Quanti) for even distribution. Dry the pad and store desiccated until assembly [40].
Step 3: Coating the Nitrocellulose Membrane
- Capture Line Application: Using a non-contact dispenser (e.g., BioDot Quanti BioJet), stripe the anti-gliadin capture antibody (mAb 7) at a defined concentration (e.g., 0.5-1.0 mg/mL) onto the nitrocellulose membrane to form the test line (T-line) [2] [40].
- Control Line Application: Similarly, stripe a species-specific anti-IgG antibody at an optimized concentration (e.g., 1.0 mg/mL) to form the control line (C-line) [40].
- Drying and Blocking: Dry the membrane thoroughly. Subsequently, the entire membrane may be blocked with a protein solution (e.g., 1% BSA) to minimize background noise [40].
Step 4: Strip Assembly and Cutting
- Lamination: Adhere the various components sequentially onto the backing card with a 1-2 mm overlap between each pad to ensure continuous capillary flow. The standard order is: Sample Pad → Conjugate Pad → (optional Stacking Pad) → Nitrocellulose Membrane → Absorbent Pad [40] [42].
- Cutting: Cut the assembled card into individual strips of the desired width (typically 3-6 mm) using a dedicated strip cutter [40].
Step 5: Assay Performance and Validation
- Testing: Apply the liquid sample (e.g., extracted food sample) to the sample pad. The result can be read visually within 5-20 minutes [2] [43].
- Quantification (Optional): For quantitative results, use a portable strip reader or a smartphone-based application to measure the color intensity of the test line. The intensity is proportional to the analyte concentration within a defined range [39] [41].
- Validation: Validate the assembled strips using spiked negative samples and confirmed positive clinical or food samples. Compare the results with a gold standard method like ELISA to determine sensitivity, specificity, and accuracy [39] [2]. For gliadin detection in milk, the LFIA showed a calculated LOD of 6.56 ng/mL, with high consistency with ELISA results [2].
The workflow for the entire process, from conjugation to data analysis, is summarized in Figure 2.
Figure 2. Workflow for developing and validating a gold nanoparticle-based lateral flow immunoassay. The process begins with the conjugation of antibodies to AuNPs and culminates in the analytical and clinical validation of the assembled test strips.
Protocol for Sample Preparation and Extraction from Complex Food Matrices
The accurate detection of wheat allergens, specifically gliadin, in food products is critical for public health, particularly for individuals with celiac disease or gluten sensitivity. Effective analysis hinges on the efficient extraction of the target analyte from complex food matrices and the subsequent minimization of matrix effects that can interfere with detection. This document outlines a standardized protocol for sample preparation and extraction, designed to support research and development of gold nanoparticle-based lateral flow immunoassays (LFLIAs) for gliadin detection. The methods described herein—QuEChERS, Supported Liquid Extraction (SLE), and Solid-Phase Extraction (SPE)—are optimized to ensure high recovery and reliability, forming the foundational step for accurate on-site testing [3] [44].
Materials and Reagents
Research Reagent Solutions
The following table details essential materials and their functions for the extraction and analysis of gliadin from food matrices.
Table 1: Essential Research Reagents and Materials
| Item | Function / Application in Protocol |
|---|---|
| Gliadin Monoclonal Antibodies (mAbs) | Critical capture and detection reagents in the LFIA; specificity for the immunodominant gliadin peptide (e.g., PQPQLPY) ensures assay accuracy [3] [20]. |
| Gold Nanoparticles (AuNPs) (~20 nm) | Labels for detection in LFIA; conjugated to gliadin mAbs for visual signal generation at the test line [3]. |
| QuEChERS Extraction Kits | Provides pre-measured salts and sorbents for the quick, effective extraction and clean-up of gliadin from various solid and semi-solid food matrices [44]. |
| Supported Liquid Extraction (SLE) Plates/Tubes | A selective technique for aqueous or polar organic samples; replaces traditional liquid-liquid extraction to eliminate emulsions and improve reproducibility [44]. |
| Solid-Phase Extraction (SPE) Sorbents | Customizable clean-up; sorbents like C18, polymeric phases, or graphitized carbon black (GCB) are selected to retain gliadin or remove specific matrix interferences [44]. |
| Acetonitrile | Common extraction solvent used in QuEChERS and other protocols for efficiently isolating gliadin from food samples [45] [44]. |
| Buffers (e.g., Phosphate Buffered Saline) | Used for sample reconstitution, antibody conjugation, and as a running buffer in LFIA strips to maintain stable pH and ionic conditions [3]. |
Sample Preparation Workflow
The following diagram illustrates the logical workflow for preparing a food sample for gliadin analysis, from homogenization to final extract.
Extraction Protocols
The choice of extraction method depends on the physical state and composition of the food matrix. Below are three robust protocols.
Protocol for QuEChERS Extraction
The QuEChERS method is ideal for solid, semi-solid, and highly pigmented samples [44].
- Homogenization: Pre-homogenize the food sample (e.g., flour, bread, pasta) to ensure a consistent and representative sub-sample.
- Weighing: Accurately weigh 2.0 ± 0.1 g of the homogenized sample into a 50 mL centrifuge tube.
- Hydration: For low-moisture samples, add an appropriate amount of water (e.g., 2 mL) and vortex to hydrate fully.
- Solvent Addition: Add 10 mL of acetonitrile to the tube. Vortex vigorously for 1 minute.
- Salt Addition: Add a commercial QuEChERS extraction salt packet (typically containing MgSO₄ and NaCl or buffering salts like sodium acetate) to induce phase separation. Shake immediately and vigorously for 1 minute.
- Centrifugation: Centrifuge at ≥ 4000 RCF for 5 minutes. The acetonitrile layer (upper layer) will contain the extracted gliadin.
- Clean-up (dSPE): Transfer 1 mL of the upper acetonitrile layer to a dSPE tube containing clean-up sorbents (e.g., 150 mg MgSO₄, 25 mg PSA, and for pigmented samples, 5-10 mg GCB). Vortex for 30 seconds.
- Final Centrifugation: Centrifuge the dSPE tube at ≥ 4000 RCF for 2 minutes.
- Collection: The supernatant is the final purified extract. It can be used directly in the LFIA or diluted as needed.
Protocol for Supported Liquid Extraction (SLE)
SLE is highly effective for liquid or aqueous-based samples like milk, liquid dairy alternatives, or coffee [44].
- Sample Preparation: If the sample is not aqueous, make it so. For instance, liquid milk can be used directly. Oils can be mixed with a strong organic solvent, dried down, and reconstituted in DI water [44].
- Conditioning: Condition the SLE cartridge or plate with a water-miscible solvent, such as methanol or acetonitrile, followed by equilibration with water or a buffer.
- Sample Loading: Load the aqueous sample onto the conditioned SLE support bed. Allow it to fully absorb into the stationary phase.
- Analyte Elution: After a brief equilibrium period (5-10 minutes), elute the gliadin from the SLE support using a non-polar or semi-polar organic solvent that is immiscible with water (e.g., ethyl acetate or dichloromethane). Collect the eluate.
- Concentration (Optional): If necessary, evaporate the eluate to dryness under a gentle stream of nitrogen and reconstitute in a buffer compatible with the LFIA (e.g., phosphate buffer).
Protocol for Solid-Phase Extraction (SPE)
SPE offers the highest degree of customization for complex clean-up requirements [44].
- Sorbent Selection: Select an appropriate SPE sorbent. For gliadin, which is hydrophobic, a reversed-phase sorbent like C18 or a polymeric sorbent is a suitable starting point.
- Conditioning: Condition the SPE cartridge with 3-5 mL of methanol, followed by 3-5 mL of water or a buffer to activate the sorbent and create a compatible environment for sample loading.
- Sample Loading: Load the crude sample extract (in a weak solvent, e.g., <10% organic) onto the cartridge. Use a controlled flow rate (e.g., 1-2 mL/min) to ensure proper binding.
- Washing: Wash the cartridge with 3-5 mL of a weak wash solution (e.g., 5-10% methanol in water) to remove weakly retained matrix interferences without eluting the gliadin.
- Elution: Elute the purified gliadin with 2-3 mL of a strong solvent (e.g., 70-100% methanol or acetonitrile). Collect the entire eluate.
- Reconstitution: Evaporate the eluate to dryness and reconstitute in the desired buffer for LFIA analysis.
Quantitative Assessment of Protocol Performance
To validate the effectiveness of the sample preparation, two key parameters must be calculated: Extraction Recovery and Matrix Effect.
Table 2: Calculations for Assessing Extraction Efficiency and Matrix Interference
| Parameter | Formula | Interpretation & Best-Practice Threshold | ||
|---|---|---|---|---|
| Extraction Recovery [45] | (C / A) × 100% |
Measures the efficiency of the extraction process. A is the peak area of a solvent standard. C is the peak area of a sample spiked with the analyte before extraction. A recovery of 70-120% is generally considered acceptable, though specific guidelines (e.g., SANTE/12682/2019) should be consulted [45]. | ||
| Matrix Effect (ME) [45] | [(B / A) - 1] × 100% -- or -- [(mB / mA) - 1] × 100% |
Quantifies ion suppression/enhancement caused by co-extracted matrix. A is the peak area of a solvent standard; B is the peak area of a sample spiked after extraction. mA and mB are the slopes of solvent-based and matrix-matched calibration curves, respectively. | ME | > 20% typically requires action to compensate for the effect (e.g., using matrix-matched standards) [45]. |
Troubleshooting and Method Optimization
Even with standardized protocols, challenges may arise. The following table addresses common issues.
Table 3: Troubleshooting Guide for Sample Preparation
| Observation | Potential Cause | Suggested Solution |
|---|---|---|
| Low Recovery | Incomplete extraction; analyte loss during clean-up; strong analyte-matrix binding. | Ensure thorough homogenization and shaking. Re-evaluate dSPE/SPE sorbents (e.g., GCB can adsorb planar molecules). Optimize elution solvent strength in SPE [44]. |
| High Matrix Effect (>20%) | Excessive co-extraction of matrix components (e.g., lipids, pigments). | Increase clean-up rigor (e.g., optimize dSPE sorbent ratios). For SLE, screen different elution solvents to find one that minimizes ion suppression [45] [44]. |
| Poor Chromatography / Noisy Baseline | Inadequate clean-up; residual matrix interfering with detection. | Incorporate additional clean-up steps. For SPE, optimize the wash step stringency to remove interferences without eluting the analyte [44]. |
| Inconsistent Replicates | Inhomogeneous sample; variable flow rates in SPE. | Improve sample homogenization. Use automated liquid handlers or vacuum manifolds to ensure consistent flow rates across all samples [44]. |
Procedure for Running the Assay and Interpreting Visual Results
Core Principle and Procedure
The Gold Nanoparticle-based Lateral Flow Immunoassay (AuNP-LFIA) is a rapid, membrane-based technique that leverages the specific binding between antibodies and target antigens, with AuNPs serving as the colorimetric label. The procedure involves the application of a liquid sample to a strip, which then migrates via capillary action across various pads, leading to a visual result at the test and control lines within minutes [39].
Step-by-Step Assay Protocol
Materials Required:
- Pre-fabricated AuNP-LFIA strips.
- Prepared liquid samples (e.g., extracted food samples, buffer solutions).
- Timer.
Procedure:
- Sample Application: Pipette the recommended volume (typically 70-100 µL) of the prepared liquid sample onto the sample pad of the LFIA strip [39].
- Migration and Conjugation: The sample migrates from the sample pad to the conjugate pad, which contains gold nanoparticles conjugated with a specific antibody (e.g., anti-wheat allergen antibody). If the target allergen is present in the sample, it binds to the AuNP-Ab conjugate, forming a complex [39].
- Capture and Signal Generation: The fluid front, containing the complex, continues to migrate onto the nitrocellulose membrane. At the test line, which is immobilized with a second capture antibody specific to the target allergen, the AuNP-Ab-Ag complex is captured. This accumulation of gold nanoparticles produces a visible red or pink line. The remaining complex and free conjugate continue to flow to the control line, where an anti-species antibody (e.g., anti-rabbit IgG) captures the AuNP-Ab conjugate, validating the correct function of the strip [39].
- Result Reading: Results should be interpreted within the time window specified in the kit protocol (typically 5-20 minutes). The development of the control line is essential for the test to be considered valid [46] [47].
Workflow and Key System Components
The following diagram illustrates the assay workflow and the structure of the lateral flow strip.
Research Reagent Solutions and Essential Materials
The following table details the key components required for the fabrication and operation of a gold nanoparticle-based LFIA.
Table 1: Essential Materials for Gold Nanoparticle-Based LFIA Development
| Component | Function | Key Considerations |
|---|---|---|
| Gold Nanoparticles (AuNPs) | Colorimetric label; provides the red signal for visual detection [39]. | Typically 20-40 nm in diameter; requires optimization of pH and concentration for stable antibody conjugation [39]. |
| Specific Antibodies | Biorecognition elements that bind to the target wheat allergen [39]. | Requires a matched pair: one for conjugation to AuNPs, another for immobilization at the test line. Specificity and affinity are critical [39]. |
| Nitrocellulose Membrane | Porous matrix where the immunochemical reaction (capture at test/control lines) occurs [39] [47]. | Pore size (e.g., 8-15 µm) affects flow rate and sensitivity; must be optimized [39]. |
| Sample & Conjugate Pads | Cellulose or glass fiber pads for sample application and conjugate release [46] [47]. | Often pre-treated with buffers and blockers to stabilize the conjugate and ensure consistent flow [39]. |
| Bovine Serum Albumin (BSA) | Blocking agent used to passivate the membrane and conjugate surface [46]. | Reduces non-specific binding, lowering background noise and improving assay specificity [46]. |
| Absorbent Pad | Drives capillary action by wicking excess fluid, ensuring the sample flows the entire length of the strip [39]. | Prevents backflow and ensures complete development of the test and control lines [39]. |
Interpretation of Results and Performance Data
Visual Interpretation
Interpretation is based on the presence or absence of the test line, with the control line serving as an internal procedural control.
- Positive Result: Both the test line and control line are visible. The intensity of the test line is often proportional to the analyte concentration [47].
- Negative Result: Only the control line is visible.
- Invalid Result: The control line does not appear, regardless of the test line. This indicates a faulty strip or incorrect procedure, and the test must be repeated [39].
Quantitative and Semi-Quantitative Analysis
For more precise results, visual assessment can be supplemented with instrumental reading. The table below summarizes quantitative data from representative AuNP-LFIA studies.
Table 2: Quantitative Performance Data from AuNP-LFIA Studies
| Target Analyte | Assay Format | Limit of Detection (LOD) | Dynamic Range | Clinical Validation (vs. Gold Standard) | Citation |
|---|---|---|---|---|---|
| SARS-CoV-2 RBD Antigen | Sandwich LFIA | 1 ng/mL (in buffer) | Not specified | 94.3% Sensitivity, 90.9% Specificity (vs. RT-PCR) | [39] |
| Vancomycin | Competitive LFIA | 2.88 ng/mL | 2.88 to 45,000 ng/mL | High accuracy and reproducibility in spiked serum samples | [46] |
| Serum Amyloid A (SAA) | Quantitative LFIA | Not specified | 0 - 1500 μg/mL | 94.23% accuracy achieved using a smartphone-based algorithm | [47] |
Smartphone-Based Quantification
To overcome the subjectivity of visual interpretation, smartphone-based readers can be employed. The general workflow involves:
- Image Acquisition: Capturing an image of the developed LFIA strip under controlled lighting conditions (e.g., using a dark box) [47].
- Image Processing: Using software (e.g., OpenCV libraries) to preprocess the image, identify the region of interest (ROI), and reduce noise [47].
- Signal Quantification: Extracting the color intensity (e.g., in RGB or grayscale) of the test line [39] [31].
- Concentration Calculation: Correlating the measured intensity to a concentration via a pre-established calibration curve, often using machine learning models like Support Vector Machine (SVM) for fitting [47].
This method provides a portable, cost-effective solution for achieving high quantitative accuracy comparable to traditional laboratory methods [31] [47].
Critical Parameters for Enhancing LFIA Sensitivity and Specificity
In the development of a gold nanoparticle (GNP)-based lateral flow immunoassay (LFIA) for wheat allergen detection, the conjugation process between antibodies and GNPs represents a pivotal step that directly determines the analytical sensitivity and specificity of the final assay. The conjugation buffer formulation, specifically its molarity and pH, governs the electrostatic interactions between protein molecules and nanoparticle surfaces, ultimately controlling antibody orientation, stability, and biological activity. Optimal buffer conditions ensure maximum binding efficiency while preventing nanoparticle aggregation, a common failure point in LFIA development. For researchers targeting wheat gliadin allergens, where detection limits of 20-25 ng/mL are required to meet regulatory standards for gluten-free foods, precision in buffer optimization is not merely beneficial—it is essential for achieving reliable performance [20] [3].
The fundamental mechanism relies on manipulating electrostatic interactions between GNPs and antibodies. At a pH above the antibody's isoelectric point (pI), antibodies carry a net negative charge, while GNPs typically exhibit slight negative surface charges. Carefully controlled ionic strength provided by buffer molarity partially shields these repulsive forces, allowing hydrophobic and van der Waals interactions to facilitate adsorption without inducing aggregation. This delicate balance must be empirically determined for each antibody-nanoparticle system, as even minor variations can significantly impact the stability and functionality of the resulting conjugates [48] [49].
Key Buffer Parameters and Their Optimization
The Critical Role of pH
pH optimization is paramount as it directly affects the surface charge of both antibodies and gold nanoparticles, thereby controlling their electrostatic interactions. The optimal pH range for passive adsorption of antibodies to GNPs is typically between 7.0 and 9.0, slightly above the isoelectric point of most antibodies (pI ~5.5-7.0) [48]. At this alkaline range, antibodies maintain a net negative charge while the gold surface remains slightly negative, creating conditions conducive to stable binding without aggregation.
Table 1: pH Optimization Findings for GNP-Antibody Conjugation
| pH Value | Visual Observation with NaCl | Interpretation | Recommended Application |
|---|---|---|---|
| pH 6.0-7.0 | Color change from red to purple/gray | Nanoparticle aggregation; unstable conjugate | Unsuitable for conjugation |
| pH 8.0 | Maintains red color; no aggregation | Stable conjugation; optimal antibody orientation | Ideal for most monoclonal antibodies |
| pH 9.0 | Maintains red color; may show slight aggregation | Generally stable conjugation | Acceptable alternative if pH 8.0 fails |
| > pH 9.0 | Variable results; potential precipitation | High pH may denature antibodies | Not recommended for sensitive antibodies |
Experimental data from gliadin-specific monoclonal antibody conjugation demonstrates that pH 8.0 provides optimal conditions, yielding stable conjugates that maintain functionality throughout the LFIA strip's shelf life. At this pH, the antibody structure remains intact while achieving sufficient affinity for the GNP surface through hydrophobic interactions and coordination bonds [3]. Researchers developing assays for wheat allergens should note that significantly lower pH values (6.0-7.0) typically induce immediate nanoparticle aggregation upon salt addition, evidenced by a color change from red to purple or gray, indicating unsuccessful conjugation [3] [48].
Buffer Molarity and Composition
Buffer molarity directly influences ionic strength, which controls the electrostatic shielding between nanoparticles and proteins. Typically, low-concentration buffers (5-50 mM) are employed to maintain adequate buffering capacity without introducing excessive salts that would destabilize the colloidal suspension [50] [48].
Table 2: Buffer Composition and Molarity Optimization
| Buffer Type | Buffering Range | Recommended Molarity | Advantages | Limitations |
|---|---|---|---|---|
| Potassium Phosphate | 6.8-8.0 | 10-50 mM | Physiological compatibility; low cost | Phosphate can interfere with some conjugations |
| Borate | 8.0-10.0 | 10-50 mM | Ideal for higher pH requirements | May be less stable over long periods |
| HEPES | 6.8-8.2 | 10-50 mM | Good biological compatibility; stable | More expensive than phosphate or borate |
| MES | 5.5-6.7 | 10-50 mM | Suitable for low pH applications | Outside typical conjugation range |
For wheat allergen detection systems, 10-50 mM potassium phosphate or borate buffers are most commonly employed, depending on the target pH [48]. The buffer concentration must be sufficient to maintain stable pH during conjugation while avoiding high ionic strength that would screen electrostatic repulsions between nanoparticles, leading to aggregation. Empirical testing should determine the minimal molarity that maintains pH stability, as excess ions can compete with antibody binding to the GNP surface [51] [49].
Experimental Protocols for Buffer Optimization
pH Titration Protocol for Conjugation Optimization
This protocol determines the optimal pH for conjugating gliadin-specific monoclonal antibodies to 40 nm GNPs, adapted from established methodologies with specific applications for wheat allergen detection [3] [48].
Materials Required:
- nanoComposix BioReady 40 nm Bare Gold (OD 20)
- Gliadin-specific monoclonal antibodies (≥ 1 mg/mL)
- 100 mM buffers: Potassium phosphate (pH 7.0, 8.0), Borate (pH 9.0)
- 10% sodium chloride (NaCl) solution
- Protein desalting columns (e.g., Zeba Spin)
- Conjugate block buffer (10 mM potassium phosphate, 10% BSA, pH 8.0)
- Conjugate diluent (10 mM potassium phosphate, 1% BSA, pH 8.0)
- 1.5 mL microcentrifuge tubes
- Vortex mixer, laboratory rotator, centrifuge, bath sonicator
Methodology:
- Antibody Preparation: Purify antibodies into salt-free buffer using desalting columns according to manufacturer instructions. Determine protein concentration spectrophotometrically (A280). Adjust concentration to ≥1 mg/mL with purification buffer.
Buffer Preparation: Prepare 100 mM stock solutions of potassium phosphate (pH 7.0 and 8.0) and borate buffer (pH 9.0). Filter through 0.22 μm membrane to remove particulates.
pH Titration Setup: Label three microcentrifuge tubes as 7A, 8A, and 9A corresponding to pH values. To each tube, add 12.5 μL of the respective 100 mM buffer.
Antibody Addition: Add 20 μg of gliadin-specific antibody to each tube containing buffer. Vortex briefly to mix.
GNP Addition: Add 250 μL of OD 20 GNPs to each tube. Vortex immediately and incubate on a rotator for 10 minutes at room temperature.
Stability Test: Prepare three additional tubes (7B, 8B, 9B) each containing 50 μL of 10% NaCl. After 10 minutes of incubation, transfer 50 μL from each conjugation mixture (tubes A) to the corresponding NaCl-containing tubes (tubes B). Vortex and incubate for 10 minutes on rotator.
Visual Assessment: Observe color changes in tubes B:
- Stable conjugate: Maintains red color identical to original GNP solution
- Unstable conjugate: Color changes to purple, gray, or shows precipitation
Conjugate Processing: For pH conditions producing stable conjugates, continue processing the remaining volume from corresponding tubes A. Add conjugate block buffer to achieve 1% BSA final concentration. Incubate 30 minutes on rotator.
Purification: Centrifuge at 3600 RCF for 3 minutes. Carefully remove supernatant and resuspend pellet in conjugate diluent to original volume (250 μL). Vortex and bath sonicate if necessary to fully resuspend.
Functional Validation: Test optimized conjugates on LFIA strips with gliadin standards (0, 10, 20, 40 ppm) to confirm sensitivity meets the 20 ppm Codex standard for gluten detection [3].
Buffer Molarity Optimization Protocol
This protocol determines the optimal buffer concentration for maintaining both conjugation efficiency and nanoparticle stability.
Materials Required:
- Optimized pH buffer (as determined in Protocol 3.1)
- Gliadin-specific monoclonal antibodies (≥ 1 mg/mL)
- 40 nm GNPs (OD 20)
- Ultrapure water for dilution
- NaCl solution (10%)
Methodology:
- Prepare the optimized pH buffer at varying concentrations: 5 mM, 10 mM, 20 mM, 50 mM.
For each molarity, set up conjugation reactions as described in Protocol 3.1, steps 3-6.
After NaCl challenge, assess stability both visually and spectrophotometrically by measuring absorbance at 520 nm and 600 nm.
Calculate the stability ratio (A520/A600) for each condition. Higher ratios indicate maintained nanoparticle dispersion, while lower ratios suggest aggregation.
Select the lowest buffer molarity that maintains ≥90% of the maximum stability ratio, as this minimizes potential interference in subsequent assay steps.
The Scientist's Toolkit: Essential Research Reagents
Table 3: Key Research Reagent Solutions for GNP Conjugation
| Reagent / Material | Specifications | Function in Conjugation Process |
|---|---|---|
| Gold Nanoparticles | 20-40 nm diameter, OD 1-20 [3] [48] | Signal reporter; provides visual detection in LFIA |
| Anti-Gliadin mAbs | Monoclonal, specific to PQPQLPY epitope [20] [3] | Recognition element for wheat allergen detection |
| Potassium Phosphate Buffer | 10-100 mM, pH 7.0-8.0 [48] | Maintains pH during conjugation; optimal for antibody orientation |
| Borate Buffer | 10-100 mM, pH 8.0-9.0 [48] | Alternative buffer for higher pH requirements |
| BSA (Bovine Serum Albumin) | Fatty-acid free, molecular biology grade [52] | Blocking agent; prevents non-specific binding |
| Desalting Columns | Zeba Spin 7K MWCO or equivalent [48] | Removes interfering salts and additives from antibody solutions |
| Sodium Chloride (10%) | Molecular biology grade [48] | Stability challenge test for conjugated GNPs |
Troubleshooting and Technical Notes
Common Optimization Challenges
Problem: Immediate nanoparticle aggregation upon antibody addition
- Cause: pH too low or antibody concentration insufficient
- Solution: Verify pH calibration of buffers; test higher antibody concentrations (up to 160 μg/mL of OD 20 gold) [48]
Problem: Weak test line intensity in LFIA despite stable conjugation
- Cause: Antibody denaturation at high pH or insufficient binding sites
- Solution: Test narrower pH range (7.5-8.5); evaluate antibody activity after conjugation by ELISA
Problem: High background on nitrocellulose membrane
- Cause: Incomplete blocking or excessive ionic strength in running buffer
- Solution: Optimize blocking buffer (BSA concentration 1-5%); include surfactants (Tween-20, 0.05-0.1%) in running buffer [52]
Advanced Optimization Strategies
For enhanced performance in wheat allergen detection, consider these advanced strategies:
Secondary pH Optimization: Once the optimal pH range is identified (e.g., pH 8.0), conduct a secondary screen with 0.3 pH unit increments (7.7, 8.0, 8.3) to fine-tune conjugation efficiency [48].
Antibody Loading Optimization: At the optimal pH and molarity, vary antibody loading from 25-160 μg/mL of OD 20 gold to determine the minimal concentration that provides maximum signal intensity while maintaining stability [48].
Long-Term Stability: Assess conjugate stability over time by storing at 4°C and testing functionality weekly. Successful conjugates typically maintain performance for 3-6 months when properly stored in BSA-containing buffers [51].
Precise optimization of conjugation buffer parameters—specifically pH and molarity—represents a critical foundational step in developing reliable GNP-based LFIAs for wheat allergen detection. The systematic approach outlined in this application note enables researchers to establish robust conjugation conditions that maximize assay sensitivity and stability. By adhering to these protocols and leveraging the provided troubleshooting guidance, scientists can create highly sensitive detection systems capable of meeting the stringent 20 ppm threshold required for gluten-free certification, ultimately contributing to improved food safety for consumers with gluten-related disorders.
Blocking Agents and Surfactants to Minimize Non-Specific Binding
In the development of gold nanoparticle (AuNP)-based lateral flow immunoassays (LFIAs) for the detection of wheat allergens, the specificity of the assay is paramount. Non-specific binding (NSB) of proteins or other matrix components to the sensor surface can lead to false-positive results, reduced sensitivity, and unreliable data. The strategic use of blocking agents and surfactants is a critical step in passivating unused binding sites on the solid support and the surface of the AuNPs themselves. This protocol details optimized methods for blocking, framed within research on LFIA for wheat gliadin detection, to achieve highly specific and accurate results [20] [3].
Research Reagent Solutions
The following table catalogues essential reagents used to minimize non-specific binding in gold nanoparticle-based lateral flow assays.
Table 1: Key Reagents for Minimizing Non-Specific Binding
| Reagent | Function & Mechanism | Application Notes |
|---|---|---|
| Bovine Serum Albumin (BSA) | Protein-based blocking agent; occupies hydrophobic and charged sites on the nitrocellulose membrane and gold surfaces via physical adsorption [53]. | Effective for preventing bacterial attachment on gold surfaces, especially when used in combination with surfactants like Tween 20 [53]. |
| Polyethylene Glycol (PEG) | Hydrophilic polymer; forms a steric hydration shell that reduces protein adsorption through anti-biofouling properties [54]. Molecular weight (1-5 kDa) impacts packing density and steric hindrance [54] [53]. | Lower molecular weight PEG (e.g., 1 kDa) can pack more densely on gold surfaces. Higher molecular weights (e.g., 5 kDa) may enhance NSB for some organisms if not optimized [53]. |
| Mercaptoundecanol (MCU) | Small, thiolated molecule; forms a dense self-assembled monolayer (SAM) on gold surfaces, presenting hydrophilic terminal OH groups that resist protein adsorption [53]. | Provides high-density packing on gold electrodes. Shows high blocking capacity against bacterial attachment when used with Tween 20 [53]. |
| Tween 20 | Non-ionic surfactant; disrupts hydrophobic and ionic interactions, the primary forces behind NSB. It solubilizes proteins and prevents their deposition on surfaces [53]. | Typically used as a low-concentration additive (e.g., 0.1%) to blocking buffers and wash solutions. Greatly enhances the efficacy of other blocking agents like BSA and MCU [53]. |
| Chicken Serum Albumin (CSA) | Protein-based blocking agent; functions similarly to BSA but can be advantageous if the detection system involves anti-bovoid antibodies to prevent cross-reactivity [53]. | An effective alternative to BSA, showing comparable performance in blocking nonspecific bacterial attachment to gold electrodes [53]. |
Quantitative Comparison of Blocking Agent Efficacy
The choice of blocking agent significantly impacts the performance of a biosensor. The following table summarizes experimental data on the efficacy of various agents in preventing nonspecific attachment on gold surfaces.
Table 2: Efficacy of Blocking Agents on Gold Surfaces
| Blocking Agent | Formulation | Test System | Key Finding / Efficacy | Reference |
|---|---|---|---|---|
| BSA + Tween 20 | Combination in buffer | Impedimetric gold electrodes vs. S. aureus & S. intermedius | One of the most effective combinations, yielding the greatest blocking capacity. | [53] |
| MCU + Tween 20 | Combination in buffer | Impedimetric gold electrodes vs. S. aureus & S. intermedius | One of the most effective combinations, yielding the greatest blocking capacity. | [53] |
| 5kPEG | PEG, MW ~5 kDa | Impedimetric gold electrodes vs. S. intermedius | Found to enhance bacterial attachment, demonstrating the need for agent-specific optimization. | [53] |
| 1kPEG | PEG, MW ~1 kDa | Impedimetric gold electrodes | Induced higher impedance changes, suggesting denser molecular packing on the gold substrate. | [53] |
| PEG-based NPs | Nanoparticles from 6K PEG-diMA | Gold-coated sensor platforms | Formed a smooth, stable monolayer coating (80-120 nm thick), ideal for modifying biosensor surfaces. | [54] |
Experimental Protocols
Protocol for Blocking a Lateral Flow Strip
This protocol describes the post-conjugation blocking of a lateral flow strip to minimize non-specific binding after the test and control lines have been applied to the nitrocellulose membrane.
Materials:
- Blocking buffer (see Table 3 for formulations)
- Prepared lateral flow cards (with sample pad, conjugate pad, nitrocellulose membrane, and absorbent pad)
- Drying oven or desiccator
Procedure:
- Prepare the Blocking Buffer: Select a formulation from Table 3 below. A common and effective starting point is a phosphate buffer containing BSA and Tween 20.
Table 3: Example Blocking Buffer Formulations
Component Formulation 1 (General Use) Formulation 2 (Protein-Free) Buffer 10-50 mM Phosphate Buffered Saline (PBS), pH 7.4 10-50 mM Tris or PBS, pH 7.4 Blocking Agent 0.5-2% (w/v) BSA 0.5-1% (w/v) PEG (1 kDa) Surfactant 0.05-0.1% (v/v) Tween 20 0.05-0.1% (v/v) Tween 20 Stabilizer 2-5% (w/v) Sucrose or Trehalose (for long-term stability) 2-5% (w/v) Sucrose or Trehalose
Immerse the Strip: Dip the entire assembled lateral flow card into the prepared blocking buffer for 15-30 minutes at room temperature with gentle agitation. Ensure all components are fully saturated.
Rinse (Optional): For some formulations, a brief rinse in a buffer containing a low concentration of surfactant (e.g., 0.01% Tween 20 in PBS) may be used to remove excess, unbound blocking agents.
Dry the Strip: Place the blocked strip in an oven at 37-45°C for 2-4 hours or overnight at room temperature in a desiccator to ensure complete drying before packaging.
Protocol for Blocking Gold Nanoparticle Conjugates
This protocol is for blocking the surface of gold nanoparticles before their application on the conjugate pad, which prevents aggregation and non-specific binding in the pad.
Materials:
- Synthesized AuNPs (e.g., ~20 nm) [3]
- Detection antibody (e.g., anti-gliadin monoclonal antibody) [20] [3]
- Blocking buffer (e.g., 0.5-1% BSA, 0.05% Tween 20 in PBS, pH 8.0)
- Washing buffer (e.g., 0.01% Tween 20 in PBS, pH 8.0)
Procedure:
- Conjugate Antibodies: Adjust the pH of the AuNP solution to 8.0-9.0 using a mild base like potassium carbonate. Add the detection antibody at an optimized concentration (e.g., 1 µg/mL for 20 nm AuNPs) and incubate for 30-60 minutes at room temperature [3].
Block the Conjugates: Add blocking buffer to the AuNP-antibody conjugate solution to achieve a final concentration of 0.5-1% BSA. Incubate for an additional 30 minutes to allow the blocking agents to occupy any remaining bare gold surfaces.
Purify the Conjugates: Centrifuge the blocked AuNP conjugates (e.g., at 10,000-14,000 rpm for 15-20 minutes) to form a soft pellet. Carefully aspirate and discard the supernatant.
Wash and Resuspend: Resuspend the pellet in a resuspension buffer (e.g., 0.1% BSA, 0.05% Tween 20, 2% sucrose in PBS, pH 8.0). Repeat the centrifugation and resuspension step once more to ensure the removal of unbound antibodies and blocking agents. The final conjugate is ready for application onto the conjugate pad.
Visualization of Workflows and Mechanisms
AuNP Blocking and Non-Specific Binding Prevention
Lateral Flow Assay Workflow with Critical Blocking Steps
Antibody Orientation and Immobilization Strategies on Nitrocellulose
The performance of gold nanoparticle (AuNP)-based lateral flow immunoassays (LFIAs) for wheat allergen detection is critically dependent on the effective presentation of antibodies. Proper antibody orientation on the nitrocellulose membrane is a fundamental determinant of assay sensitivity, specificity, and reliability. Random antibody adsorption, the conventional immobilization approach, often obscures antigen-binding sites through steric hindrance, substantially compromising detection capability [55]. This application note details advanced immobilization strategies that address this limitation by promoting oriented antibody attachment, specifically within the context of developing enhanced LFIAs for wheat allergen research.
The Critical Importance of Antibody Orientation
In LFIA systems, antibodies immobilized on nitrocellulose membranes can assume various orientations. Among these, the "end-on" orientation is recognized as superior because it maximizes the exposure of the antigen-binding fragments (Fab), thereby significantly enhancing the likelihood of successful analyte capture [55]. Research indicates that improper orientation can substantially impair detection performance, leading to reduced sensitivity and potential false negatives [55]. For wheat allergen detection, where targets like gliadin must be identified at parts-per-million levels to comply with food safety regulations (e.g., Codex Standard 118-1979), maximizing antibody binding efficiency is not merely beneficial but essential [3].
Table 1: Comparison of Antibody Immobilization Approaches in LFIA
| Immobilization Approach | Binding Mechanism | Orientation Control | Relative Binding Strength | Impact on Assay Performance |
|---|---|---|---|---|
| Physical Adsorption | Hydrophobic interactions, electrostatic forces | Random | Weak | Variable sensitivity; potential for desorption |
| Covalent Attachment | Chemical bond formation | Random (unless specifically designed) | Strong | Risk of antibody denaturation; binding sites may be obscured |
| Protein A/G-Mediated | Affinity to Fc region of antibodies | Oriented (Fc-specific) | Moderate to Strong | Improved antigen binding due to controlled orientation |
| Dual-Headed Fusion Proteins | Combined NC membrane affinity and Fc binding | Oriented | Strong | Enhanced sensitivity and stability; requires protein engineering |
Oriented Immobilization Strategies for Nitrocellulose Membranes
Fc-Specific Affinity Ligands: Protein A and Protein G
Protein A, Protein G, and their recombinant variants exhibit specific binding affinity for the Fc region of antibodies. This biological specificity enables the directional immobilization of antibodies with their antigen-binding sites optimally exposed toward the solution, thereby increasing the probability of successful analyte capture [55]. The application of these proteins as intermediary immobilization agents has demonstrated significant improvements in LFIA performance.
A particularly innovative approach involves the development of a dual-headed recombinant protein fusing Protein A with a nitrocellulose-binding anchor protein (3-Helix). This construct simultaneously targets the nitrocellulose membrane and the Fc portion of antibodies, serving as a molecular bridge that strongly and directionally anchors antibodies to the membrane surface. Research has confirmed that this fusion protein enhances antibody binding and promotes stereochemical immobilization on nitrocellulose compared to Protein A alone [56].
Cellulose-Binding Domain Fusion Proteins
Although nitrocellulose is a modified cellulose polymer, strategies employing cellulose-binding domains (CBDs) represent a promising approach for oriented immobilization. One study developed a colorimetric LFIA utilizing a CBP31-BC bifunctional linker composed of cellulose-binding and antibody-binding domains. This system enabled oriented antibody immobilization and achieved sensitive detection of SARS-CoV-2 with 100% accuracy in clinical validation [57]. The underlying principle involves the CBD component strongly and specifically associating with the cellulose-based matrix, while the antibody-binding domain directs proper antibody presentation.
Experimental Protocols
Protocol: Oriented Antibody Immobilization Using Protein A-3Helix Fusion Protein
Purpose: To achieve oriented immobilization of anti-gliadin antibodies on nitrocellulose membranes using a recombinant Protein A-3Helix fusion protein, thereby enhancing detection sensitivity for wheat allergens.
Materials:
- Recombinant pET22b-proA-3Helix vector [56]
- E. coli BL21 (DE3) expression system
- Nitrocellulose membrane strips (e.g., Whatman, Millipore)
- Anti-gliadin monoclonal antibodies [2]
- Immobilized Metal Affinity Chromatography (IMAC) purification system
- Coomassie Blue staining solution
- Lateral flow assay components (sample pad, conjugate pad, absorbent pad)
Procedure:
- Protein Expression and Purification:
- Transform E. coli BL21 with pET22b-proA-3Helix plasmid.
- Induce protein expression with 1 mM IPTG at OD600 ≈ 0.8-0.9.
- Incubate culture at 25°C for 12 hours with shaking.
- Harvest cells by centrifugation (4,000 × g, 10 min).
- Resuspend cell pellet in lysis buffer (50 mM NaH₂PO₄, 300 mM NaCl, 10 mM imidazole, pH 8.0).
- Lyse cells using sonication (50% power, 3-sec pulse/2-sec pulse off for 10 min).
- Clarify lysate by centrifugation (10,000 × g, 20 min, 4°C).
- Purify recombinant protein using Ni-NTA affinity chromatography.
- Elute with imidazole gradient (50-250 mM) in lysis buffer.
- Dialyze purified protein against 100 mM sodium phosphate buffer (pH 7.0).
- Verify purity (>90%) by SDS-PAGE with Coomassie Blue staining [56].
Membrane Functionalization:
- Prepare a solution of Protein A-3Helix in phosphate buffer (1 mg/mL).
- Dispense the solution onto nitrocellulose membrane in a line pattern using a precision dispenser.
- Dry membranes at 37°C for 1 hour.
- Block membrane with 3% BSA in PBS for 30 minutes to prevent non-specific binding.
Antibody Immobilization:
- Apply anti-gliadin monoclonal antibody solution (1-2 mg/mL in PBS) to the functionalized membrane line.
- Incubate for 60 minutes at room temperature in a humidified chamber.
- Wash membrane with PBS containing 0.05% Tween-20 to remove unbound antibodies.
- Dry membranes and incorporate into lateral flow test strips [56].
Protocol: Gold Nanoparticle Conjugation for Gliadin Detection
Purpose: To conjugate anti-gliadin monoclonal antibodies to gold nanoparticles for use as detection probes in wheat allergen LFIA.
Materials:
- Chloroauric acid (HAuCl₄) or pre-synthesized 20-40 nm AuNPs [3]
- Anti-gliadin monoclonal antibodies [2]
- Trisodium citrate
- Bovine Serum Albumin (BSA)
- Potassium carbonate (K₂CO₃)
- Conjugation buffer (20 mM Tris-HCl, 150 mM NaCl, pH 8.0)
Procedure:
- AuNP Synthesis (if not purchased):
- Prepare 0.01% HAuCl₄ solution in ultrapure water.
- Heat to boiling with vigorous stirring.
- Rapidly add 1% trisodium citrate solution (1:10 v/v ratio).
- Continue heating and stirring until color changes to wine red.
- Cool to room temperature and characterize by UV-Vis spectroscopy (λmax = 520-530 nm) [3].
- Antibody Conjugation:
- Adjust AuNP solution to pH 8.0-9.0 using 0.1 M K₂CO₃.
- Add anti-gliadin antibody to achieve final concentration of 1-10 μg/mL.
- Incubate at room temperature for 60 minutes with gentle mixing.
- Block remaining AuNP surfaces with 1% BSA for 30 minutes.
- Centrifuge at 10,000 × g for 15 minutes to remove unbound antibodies.
- Resuspend conjugated AuNPs in storage buffer (20 mM Tris-HCl with 1% BSA, 5% sucrose, 0.1% Tween-20).
- Dispense onto conjugate pad and dry overnight with desiccant [3].
Table 2: Optimization Parameters for AuNP-Antibody Conjugation
| Parameter | Optimal Condition | Effect of Deviation | Validation Method |
|---|---|---|---|
| pH Level | 8.0-9.0 | Aggregation at lower pH; Reduced binding at higher pH | Color stability after NaCl addition |
| Antibody Concentration | 1-10 μg/mL depending on AuNP size | Insufficient coverage or nanoparticle aggregation | UV-Vis spectral shift and stability |
| Blocking Agent | 1% BSA | Non-specific binding in assay | Background signal intensity |
| Stabilizer | Sucrose/Trehalose (5%) | Reduced long-term stability | Signal consistency over storage time |
The Scientist's Toolkit: Essential Research Reagents
Table 3: Key Research Reagents for Advanced LFIA Development
| Reagent/Category | Specific Examples | Function in LFIA Development | Application Notes |
|---|---|---|---|
| Orientation Systems | Protein A, Protein G, Protein A/G chimeric | Fc-specific antibody binding for oriented immobilization | Selection depends on antibody species and subclass [55] |
| Nitrocellulose Binders | 3-Helix anchor protein, Cellulose-binding domains | Strong membrane association for stable immobilization | Enables directional antibody presentation [56] |
| Detection Nanoparticles | 20-40 nm spherical AuNPs | Colorimetric signal generation | Optimal balance between visibility and mobility [3] |
| Antibody Pairs | Anti-gliadin mAbs (e.g., mAb 6 & mAb 7) | Target capture and detection in sandwich format | Requires epitope mapping for non-competitive binding [2] |
| Membrane Blockers | BSA, casein, proprietary blocking buffers | Reduction of non-specific binding | Critical for signal-to-noise ratio improvement [58] |
Concluding Remarks
The strategic implementation of oriented antibody immobilization represents a paradigm shift in enhancing LFIA performance for wheat allergen detection. While traditional physical adsorption methods remain common due to their simplicity, their limitations in sensitivity and consistency are increasingly apparent. The integration of Fc-specific affinity systems, such as Protein A derivatives, and engineered nitrocellulose-binding fusion proteins offers researchers powerful tools to substantially improve assay capabilities. These approaches enable more efficient utilization of precious antibody reagents while delivering the enhanced sensitivity required for compliance with stringent food safety regulations. As wheat allergen research advances, these refined immobilization strategies will play an increasingly vital role in the development of next-generation rapid detection platforms.
Balancing Capture and Detector Antibody Concentrations for Optimal Signal
In the development of gold nanoparticle (AuNP)-based lateral flow immunoassays (LFIAs) for wheat allergen detection, the precise balance between capture and detector antibody concentrations is a fundamental determinant of assay performance. Achieving optimal signal intensity, sensitivity, and specificity requires meticulous optimization of these critical reagents [2]. This application note provides detailed methodologies and quantitative frameworks for researchers developing LFIAs targeting wheat allergens such as gliadin, with a specific focus on antibody concentration balancing to enhance assay precision and reliability. The principles outlined are particularly critical for sandwich-style LFIAs used in food allergen detection [2] [3].
Critical Reagent Considerations for LFIA Development
Antibody Selection and Properties
The foundation of a robust LFIA begins with antibody selection. Affinity and specificity are paramount; antibodies with fast association rates (kon) and slow dissociation rates (koff) are ideal for the brief interaction times characteristic of lateral flow tests [9]. For wheat allergen detection, monoclonal antibodies (mAbs) offer consistent specificity, while polyclonal antibodies (pAbs) can provide enhanced sensitivity through multi-epitope recognition [9]. Research on gliadin detection has successfully identified specific mAb pairs (e.g., capture mAb 7 with detection mAb 6) that deliver high specificity with minimal cross-reactivity [2].
Antibody orientation during conjugation significantly impacts functionality. Randomly oriented antibodies may have obscured paratopes, reducing binding capacity. Studies comparing conjugation methods have demonstrated that oriented immobilization techniques, such as utilizing UV-irradiated or reduced antibodies, can improve antigen-binding efficiency by ensuring better paratope accessibility [59].
Gold Nanoparticle Conjugation
AuNPs serve as the primary signal generators in many LFIAs. The conjugation process requires careful optimization of pH and antibody concentration to stabilize the colloidal suspension and maximize antibody loading. For gliadin-specific LFIAs, studies have determined that a pH of 8.0 and an antibody concentration of 1 µg/mL are optimal for creating stable, functional antibody-AuNP conjugates [3]. The conjugation strategy itself—whether through passive adsorption (physisorption) or covalent coupling (chemisorption)—also influences conjugate stability and performance. Optimized physisorption can achieve detection limits comparable to more complex covalent methods [16].
Table 1: Key Reagent Solutions for AuNP-Based LFIA Development
| Reagent / Material | Function / Role | Key Considerations |
|---|---|---|
| Anti-Gliadin mAbs [2] | Specific capture and detection of gliadin targets | Select high-affinity pairs (e.g., mAb 7 for capture, mAb 6 for detection); ensure specificity and minimal cross-reactivity. |
| Colloidal Gold (AuNPs) [3] | Visual signal generation | 20-40 nm particle size common; spherical for consistent color; requires surface functionalization. |
| Buffers (e.g., PBS, MES) [59] [3] | Conjugation and reaction medium | pH critical for conjugation stability (optimum ~pH 8.0 for anti-gliadin); ionic strength affects AuNP aggregation. |
| Blocking Agents (e.g., BSA, Skim Milk) [60] | Reduce non-specific binding | Block unused sites on AuNPs and membrane to minimize background noise and false positives. |
| Membrane (e.g., Nitrocellulose) [9] | Platform for capillary flow and test/control lines | Pore size affects flow rate and antibody immobilization; capture antibody striped at 1-3 µg/cm. |
Quantitative Optimization Data
Empirical data is essential for guiding the optimization of antibody concentrations. The following tables consolidate key quantitative findings from relevant studies.
Table 2: Experimentally Determined Optimal Antibody Concentrations in LFIA
| Assay Target | Capture Antibody [c] | Detector Antibody [c] | Key Outcome / Performance | Source |
|---|---|---|---|---|
| Gliadin (Wheat Allergen) | mAb 7 (Specific pair not quantified) | mAb 6-HRP (Specific concentration not detailed) | Achieved visual LOD of 25 ng/mL (calculated LOD 6.56 ng/mL) in milk. | [2] |
| Gluten | Monoclonal Anti-Gliadin (Immobilized concentration not detailed) | 1 µg/mL (conjugation concentration) | Detection limit of 20 ppm (20 ng/mL) for gluten in raw materials; result in 15 min. | [3] |
| Amitriptyline | (Binding Inhibition Format) | Varied by conjugation method | Direct adsorption of UV-irradiated antibody to AuNPs yielded the best quantitative results. | [59] |
Table 3: Impact of Antibody Conjugation Method on LFIA Performance
| Conjugation Method | Principle | Impact on Antibody Orientation/Stability | Reported Outcome |
|---|---|---|---|
| Direct Adsorption | Antibodies passively adsorb via electrostatic/hydrophobic interactions. | Random orientation; potential for paratope obstruction. | Common but may be less stable; performance is buffer and pH-dependent. |
| Adsorption of UV-Irradiated Antibody | UV light breaks disulfide bridges in constant regions. | Favors "side-on" orientation, improving paratope accessibility. | Best performance for quantitative amitriptyline assay [59]. |
| Covalent Binding via PEG Linker | Covalent attachment using crosslinkers (e.g., EDC/NHS). | Controlled, oriented binding possible by manipulating pH. | Can achieve high stability and good performance [59] [16]. |
| Biotin-Streptavidin Bridge | Antibody is biotinylated and bound to streptavidin-coated AuNPs. | High degree of orientation due to specific interaction. | Effective but adds complexity and cost; may require a spacer [59]. |
Experimental Protocols
Protocol: Conjugation of Antibodies to Gold Nanoparticles
This protocol is adapted for conjugating anti-gliadin antibodies to 20 nm AuNPs for wheat allergen detection [3].
Materials:
- Colloidal gold nanoparticles (20 nm, OD520 ~1)
- Anti-gliadin monoclonal antibody (lyophilized or in low-salt buffer)
- Potassium Carbonate (K2CO3, 0.2 M)
- Sodium Chloride (NaCl, 10% w/v)
- Blocking buffer (e.g., 1% BSA in Tris buffer, pH 8.0)
- Washing buffer (e.g., Tris buffer with 0.1% BSA, pH 8.0)
Procedure:
- pH Adjustment: Adjust 1 mL of the AuNP solution to pH 8.0 using 0.2 M K2CO3. Verify stability by adding 100 µL of 10% NaCl – the solution should remain red, not blue/purple.
- Antibody Addition: Add the anti-gliadin antibody to the pH-adjusted AuNP solution to a final concentration of 1 µg/mL. Mix gently and incubate at room temperature for 30-60 minutes.
- Blocking: Add blocking buffer to a final concentration of 0.1-0.5% BSA. Incubate for an additional 15-30 minutes to cover any remaining bare gold surfaces.
- Purification: Centrifuge the conjugate (e.g., 14,000 rpm for 30 minutes at 4°C). Carefully aspirate the supernatant.
- Resuspension: Resuspend the soft pellet in an appropriate volume of washing buffer. Store at 4°C until use.
Protocol: Striping Capture Antibodies and Assembling the LFIA Strip
This protocol details the assembly of a complete test strip for gliadin detection [2] [9].
Materials:
- Nitrocellulose membrane
- Capture antibody (e.g., anti-gliadin mAb 7)
- Positive control antibody (e.g., Goat Anti-Mouse IgG)
- Phosphate Buffered Saline (PBS) or suitable coating buffer
- Dispensing instrument (e.g., contact quill dispenser)
- Sample pad, conjugate pad, absorbent pad, backing card
- Guillotine cutter
Procedure:
- Membrane Preparation: Cut the nitrocellulose membrane to the required size and attach it to the backing card.
- Antibody Dispensing:
- Dilute the capture antibody (mAb 7) in coating buffer. A typical starting concentration for striping is 1-3 µg per linear cm of membrane [9].
- Strip the antibody solution onto the membrane as a thin line (test line).
- Strip the control antibody solution (e.g., 1 mg/mL Goat Anti-Mouse IgG) at a separate location.
- Drying: Dry the membrane overnight at 37°C or under controlled conditions.
- Blocking (Optional): The membrane may be blocked with a protein solution (e.g., 1% BSA) and dried again, though this is often incorporated into the pad treatment.
- Assembly: Layer the sample pad, conjugate pad (pre-treated with the AuNP-antibody conjugate), membrane, and absorbent pad on the backing card with ~1-2 mm overlaps. Laminate the assembled card.
- Cutting: Cut the laminated card into individual test strips of the desired width (typically 3-6 mm).
Workflow Diagram: LFIA Development and Optimization
The following diagram illustrates the core workflow for developing and optimizing an AuNP-based LFIA, highlighting the critical stages of conjugation, assembly, and the iterative optimization process.
LFIA Development and Optimization Workflow
Troubleshooting and Data Interpretation
A systematic approach to troubleshooting is vital for resolving common issues related to antibody balancing.
Table 4: Troubleshooting Guide for Signal Issues in AuNP-LFIA
| Observed Problem | Potential Causes | Suggested Remedial Actions |
|---|---|---|
| Weak or No Test Line | 1. Detector antibody concentration too low [59].2. Capture antibody concentration too low [9].3. Loss of antibody activity during conjugation. | 1. Titrate detector antibody concentration upward during conjugation.2. Increase concentration of capture antibody on membrane (e.g., from 1 to 2 µg/cm).3. Validate antibody activity and try a gentler conjugation method (e.g., covalent). |
| High Background Noise | 1. Detector antibody concentration too high [9].2. Inadequate blocking of membrane or AuNP conjugate.3. Non-specific antibody interactions. | 1. Reduce concentration of detector antibody during conjugation.2. Optimize blocking conditions (e.g., type of protein, concentration, incubation time).3. Include non-ionic detergents (e.g., Tween-20) in running buffer. |
| False Positive Results | 1. "Hook effect" at very high analyte concentrations.2. Non-specific binding of detector conjugate to capture line. | 1. Test high-concentration samples at dilution.2. Ensure detector conjugate is specific and does not bind capture antibody directly. |
| Low Signal Intensity | 1. Suboptimal antibody orientation on AuNPs [59].2. Antibody denaturation during conjugation. | 1. Compare conjugation methods (e.g., direct adsorption vs. oriented covalent binding).2. Ensure correct pH and avoid harsh chemical treatments. |
The successful development of a high-performance AuNP-LFIA for wheat allergen detection hinges on a meticulously balanced system of capture and detector antibodies. This balance is not a single fixed ratio but is achieved through iterative optimization of multiple interdependent factors, including antibody affinity, conjugation methodology, concentration, and orientation. The protocols and data provided herein offer a structured roadmap for researchers to systematically navigate this optimization process, ultimately leading to the creation of robust, sensitive, and reliable diagnostic assays.
The performance of a gold nanoparticle (AuNP)-based lateral flow immunoassay (LFIA) for wheat allergen detection is critically dependent on the precise control of environmental conditions during its manufacturing. The analytical sensitivity, shelf-life, and overall reliability of the final diagnostic strip are profoundly influenced by parameters such as temperature and relative humidity (RH) throughout the production process. These factors affect the structural integrity of nitrocellulose membranes, the stability of antibody-gold conjugates, and the functionality of immobilized biomolecules. This document provides detailed application notes and protocols for implementing robust environmental controls, specifically framed within a research methodology for developing a robust AuNP-LFIA for gluten detection, with a target sensitivity of 20 ppm as per the Codex standard [3]. Adherence to these protocols is essential for ensuring the batch-to-batch consistency and commercial viability of the diagnostic test.
The Impact of Environmental Conditions on LFIA Performance
Environmental factors during manufacturing can induce physical and biochemical changes that compromise test performance. The porous, fibrous architecture of the nitrocellulose membrane, essential for capillary flow, is highly susceptible to humidity, which can alter wicking rates and cause membrane deformation [61] [62]. Furthermore, the antibodies and conjugated gold nanoparticles, which are the core detection elements, are sensitive to thermal degradation. Elevated temperatures can denature antibodies, reducing their affinity and specificity, while also potentially causing aggregation of AuNPs, which alters their optical properties and conjugation efficiency [3] [6]. For a wheat allergen assay, which relies on a sandwich immunoassay format using anti-gliadin monoclonal antibodies, maintaining the conformational integrity of these proteins is paramount for achieving a low limit of detection [3].
Table 1: Effects of Improper Environmental Control During LFIA Manufacturing
| Manufacturing Stage | Effect of High Temperature | Effect of High Humidity |
|---|---|---|
| Conjugate Pad Drying | Denaturation of antibodies conjugated to AuNPs; reduced affinity [3]. | Incomplete drying leading to reagent instability and premature activation [6]. |
| Membrane Storage | Potential long-term loss of antibody binding capacity on test and control lines [6]. | Increased pore blocking; altered capillary flow time; membrane deformation [62]. |
| Strip Assembly & Packaging | Introduction of thermal stress affecting long-term reagent stability [63]. | Moisture absorption, leading to microbial growth or reagent hydrolysis during storage [63]. |
| Final Test Performance | Increased background noise; reduced signal intensity at test line; higher false-negative rate [61]. | Slow flow rate; incomplete release of conjugate; irregular test line formation [62]. |
Critical Parameters and Specifications
Based on empirical data and established manufacturing practices, the following environmental specifications are recommended for the production of AuNP-LFIAs. These parameters are designed to preserve the functionality of the anti-gliadin antibodies and the stability of the 20 nm colloidal gold reporters [3]. Controlling the RH is equally critical, as it directly influences the capillary flow time of the nitrocellulose membrane, a key performance metric [6].
Table 2: Optimal Environmental Ranges for Key LFIA Manufacturing Stages
| Manufacturing Stage | Recommended Temperature | Recommended Relative Humidity | Primary Rationale |
|---|---|---|---|
| Antibody-AuNP Conjugation | 4°C | 30-50% | Minimizes antibody aggregation and preserves colloidal stability of AuNPs during chemical coupling [3]. |
| Membrane Coating & Drying | 25°C ± 2°C | 45% ± 5% | Ensures uniform dispensing of capture antibodies and controlled drying for optimal protein immobilization [6]. |
| Conjugate Pad Drying | 25-37°C | < 30% | Facilitates complete and stable drying of AuNP-antibody conjugates in a sucrose matrix for long-term stability [6]. |
| General Assembly & Packaging | 20-25°C | 30-50% | Prevents moisture uptake and thermal stress on all components before final sealing in protective packaging [63]. |
| Long-Term Storage | 4-8°C (Recommended) | < 40% | Maximizes shelf-life (target 12-24 months) by slowing biochemical degradation processes [3] [63]. |
Experimental Protocols for Environmental Monitoring and Validation
Protocol: Validating Membrane Flow Rate Under Different Humidity Conditions
Objective: To quantitatively assess the impact of relative humidity on the capillary flow time of the nitrocellulose membrane, ensuring consistent sample migration in the final assay.
Materials:
- Nitrocellulose membrane strips (e.g., 5 cm length, 0.45 μm pore size)
- Controlled humidity chambers (e.g., using saturated salt solutions)
- Stopwatch or automated flow timer
- Distilled water containing a visible inert dye (e.g., 0.1% Blue Dextran)
Method:
- Conditioning: Place nitrocellulose strips in humidity chambers set at 30%, 50%, and 70% RH for a minimum of 4 hours prior to testing to achieve equilibrium.
- Measurement: Apply 100 μL of the dyed water to the sample pad of each conditioned strip. Simultaneously, start the timer.
- Data Collection: Record the time taken for the liquid front to travel from the start of the membrane to the end of the predefined 4 cm distance.
- Analysis: Plot flow time (y-axis) against relative humidity (x-axis). The optimal manufacturing RH range is where the flow time is most consistent and aligns with the designed assay run time (typically 15-20 minutes) [62].
Protocol: Accelerated Stability Study for AuNP-Conjugate Pads
Objective: To determine the thermal stability of the AuNP-anti-gliadin conjugate and establish the shelf-life of the conjugate pad under various stress conditions.
Materials:
- Conjugate pads coated with dried AuNP-anti-gliadin conjugates
- Temperature-controlled incubators (e.g., set at 4°C, 25°C, 37°C, and 45°C)
- Desiccators
Method:
- Storage: Store batches of conjugate pads in sealed containers with desiccant at the different temperatures.
- Sampling: At predetermined time points (e.g., 0, 1, 2, 4, and 8 weeks), remove pads from storage for testing.
- Performance Testing: Use the pads in a standard LFIA protocol against a reference gliadin sample (e.g., 20 ppm). Measure the signal intensity at the test line using a strip reader.
- Data Analysis: Plot the normalized signal intensity against time for each storage temperature. The data can be used to model degradation kinetics and predict the shelf-life at the intended storage temperature [63].
Workflow and Material Selection
The following diagram illustrates the logical decision-making process for selecting and controlling key materials and environmental parameters during the manufacturing of the AuNP-LFIA.
LFIA Manufacturing Control Logic
The Scientist's Toolkit: Research Reagent Solutions for Wheat Allergen LFIA
Table 3: Essential Materials for Gold Nanoparticle-Based Wheat Allergen LFIA
| Item | Function / Rationale | Key Specifications |
|---|---|---|
| Anti-Gliadin Monoclonal Antibody | Primary capture and detection reagent; specificity for the immunodominant PQPQLPY peptide in gliadin [3]. | High affinity; minimal cross-reactivity; validated for use in sandwich immunoassay format. |
| Colloidal Gold Nanoparticles (AuNPs) | Visual reporter particle; provides red color at test line upon accumulation [3] [6]. | ~20 nm diameter; spherical; absorbance peak at 523 nm; functionalized for antibody conjugation. |
| Nitrocellulose Membrane | Porous matrix for capillary flow and immobilization of capture antibodies at test/control lines [61] [6]. | Consistent pore size (e.g., 5-15 μm); defined capillary flow time; low non-specific binding. |
| Conjugate Release Pad | Reservoir for storing dried AuNP-antibody conjugates; releases them upon sample application [64] [6]. | Made of cross-linked silica; imparts minimal flow resistance; compatible with conjugate buffer. |
| Sucrose-Based Conjugation Buffer | Stabilizing agent for AuNP-antibody conjugates during drying and storage [6]. | Contains carbohydrates to form a protective layer around conjugates, aiding resolubilization. |
In the development of robust gold nanoparticle-based lateral flow immunoassays (LFIA) for wheat allergen detection, understanding the fundamental antibody-antigen (Ab-Ag) interaction is paramount. Molecular dynamics (MD) simulations and artificial intelligence (AI) have emerged as powerful tools that provide atomic-level insights into these interactions, enabling researchers to predict binding affinity, characterize conformational flexibility, and optimize antibody performance before experimental validation. These computational approaches are particularly valuable for designing highly specific anti-gliadin antibodies used in gluten detection, as they can differentiate between subtle epitope variations and guide the engineering of antibodies with enhanced sensitivity and specificity [65] [66].
The integration of these computational strategies with traditional immunoassay development creates a powerful pipeline for creating more reliable diagnostic tests. For wheat allergen research, this means developing LFIAs that can accurately detect gluten at or below the 20 ppm regulatory threshold, a critical requirement for protecting individuals with celiac disease [3] [67].
Key Computational Methodologies
Molecular Dynamics Simulations
Molecular dynamics simulations calculate the movements of atoms and molecules over time, providing insights into the dynamic behavior of antibody-antigen complexes in conditions mimicking physiological environments [68]. This approach is particularly valuable for studying the flexible complementarity-determining regions (CDRs) of antibodies that are crucial for antigen recognition.
Protocol: Molecular Dynamics Simulation of Antibody-Antigen Complexes
- System Preparation: Begin with a crystal structure of the antibody-antigen complex (e.g., from PDB). Add missing residues using tools like CHARMM-GUI. For gluten research, this would involve modeling the anti-gliadin antibody bound to the immunodominant 33-mer peptide from α-gliadin [65].
- Solvation and Ionization: Solvate the system in a water box (e.g., TIP3P water molecules) with a minimum distance of 15 Å from the protein to the box edge. Add ions (e.g., Na⁺ and Cl⁻) to neutralize the system and achieve a physiological concentration of ~150 mM [65].
- Energy Minimization: Minimize the system energy using steepest descent methods (e.g., 50,000 steps) to remove steric clashes [65].
- Equilibration: Gradually heat the system from 0 K to the target temperature (e.g., 300 K) while applying positional restraints to the protein heavy atoms. Subsequently, equilibrate the system in the NPT ensemble (constant Number of particles, Pressure, and Temperature) to achieve proper density [65].
- Production Simulation: Run the production MD simulation using software such as AMBER with the CHARMM36 force field. Use a timestep of 2 fs, the Particle Mesh Ewald method for electrostatic interactions, and a cutoff for van der Waals interactions (e.g., 12 Å). Save trajectories at regular intervals (e.g., every 0.1 ns) for analysis [65].
- Analysis: Calculate root-mean-square deviation (RMSD) to assess structural stability, root-mean-square fluctuation (RMSF) to identify flexible regions, and interaction energies to quantify binding. For LFIA applications, pay special attention to paratope flexibility and its effect on antigen binding [66].
AI-Enhanced Binding Affinity Prediction
Artificial intelligence models, particularly deep learning, can predict the effects of mutations on antibody-antigen binding affinity, complementing more computationally intensive MD simulations.
Protocol: AI-Assisted Affinity Prediction for Antibody Engineering
- Data Preparation: Curate a dataset of antibody-antigen sequences and their corresponding binding free energy changes (ΔΔG) upon mutation. Publicly available datasets like SKEMPI or AB-Bind can be used for training [65].
- Model Training: Utilize pre-trained protein language models (e.g., AntiBERTy for antibodies, ProtBert for antigens) to generate sequence embeddings. Train a ranking model (e.g., a transformer encoder) using a loss function like normalized discounted cumulative gain (NDCG) to predict affinity changes [65].
- Validation: Evaluate model performance using correlation metrics such as Pearson correlation coefficient (for linear correlation) and Spearman coefficient (for ranking correlation). State-of-the-art models can achieve Pearson correlations of 0.74–0.89 against experimental data [65].
- Application: Use the trained model to screen in silico mutant libraries for anti-gliadin antibodies, predicting variants with improved affinity or cross-reactivity profiles before experimental testing [65].
Flexibility Analysis with pLDDT
The predicted Local Distance Difference Test (pLDDT) from structure prediction tools like ESMFold serves as a computationally efficient proxy for residue flexibility, which is a critical factor in antigen recognition.
Protocol: Utilizing pLDDT to Assess Antibody Flexibility
- Structure Prediction: Input the antibody sequence (variable heavy and light chains) into ESMFold to generate a 3D structure and obtain per-residue pLDDT scores [66].
- Flexibility Analysis: Residues with low pLDDT scores (typically <70) indicate regions of high flexibility or disorder. Focus analysis on the CDR loops, particularly the highly variable CDRH3, which often shows lower pLDDT scores, reflecting its inherent flexibility [66].
- Integration with Fingerprint Methods: Incorporate pLDDT scores as features in geometric deep learning models (e.g., dMaSIF) to improve the prediction of interaction sites (paratopes) on the antibody surface. This approach has been shown to enhance predictive accuracy by 4%, achieving an AUC-ROC of 92% [66].
Table 1: Key Metrics from Computational Analyses of Antibody-Antigen Interactions
| Computational Method | Key Metric | Typical Value/Output | Biological Interpretation |
|---|---|---|---|
| Molecular Dynamics | Binding Free Energy (ΔG) | -6.7 to -11.8 kcal/mol [65] | Higher negative values indicate stronger binding affinity. |
| Root-Mean-Square Fluctuation (RMSF) | Residue-specific (Å) | Identifies flexible regions (e.g., CDR loops) in the complex. | |
| AI Affinity Prediction | Pearson Correlation | 0.74 – 0.89 [65] | Correlation between predicted and experimental ΔΔG values. |
| Flexibility (pLDDT) | Mean pLDDT (VH, whole) | 0.85 ± 0.04 [66] | Scores range 0-100; higher values indicate higher confidence/rigidity. |
| Mean pLDDT (VH, non-CDR) | 0.88 ± 0.04 [66] | Non-CDR regions are typically more rigid than CDR loops. |
Application to LFIA Development for Wheat Allergens
The computational methodologies described above directly inform and enhance the development of LFIAs for gluten detection. The following workflow integrates these in silico analyses with the experimental development process, focusing on the critical step of antibody selection and characterization.
This systematic integration of computational and experimental approaches enables the rational design of high-performance LFIAs. For instance, MD simulations can reveal how an anti-gliadin antibody maintains binding to its target epitope (e.g., the PQPQLPY sequence) in a dynamic, solvated environment, while AI models can predict the affinity of engineered antibody variants, streamlining the selection process [3] [65].
The Scientist's Toolkit: Essential Research Reagents and Materials
The successful application of the aforementioned protocols relies on a suite of specialized software, databases, and computational resources.
Table 2: Essential Research Reagent Solutions for Computational Antibody Analysis
| Item Name | Category | Function in Analysis | Example Use Case |
|---|---|---|---|
| AMBER | MD Software Suite | Performs molecular dynamics simulations and free energy calculations. | Simulating the dynamic interaction between an anti-gliadin antibody and its target peptide [65]. |
| CHARMM36 Force Field | Parameters | Defines energy terms for atoms in MD simulations (bonds, angles, dihedrals, non-bonded). | Providing accurate physical representations of proteins, water, and ions during simulation [65]. |
| GENESIS | MD Software | Enables enhanced sampling simulations for calculating binding free energies. | Performing replica-exchange umbrella sampling for anti-Aβ antibody characterization [68]. |
| AntiBERTy | AI Model | Pre-trained language model that generates informative embeddings from antibody sequences. | Featuring in AI models to predict the effect of mutations on antibody-antigen affinity [65]. |
| ESMFold | Structure Prediction | Predicts 3D protein structures from sequence and provides pLDDT confidence scores. | Rapidly modeling antibody Fv structure and estimating regional flexibility without MSAs [66]. |
| dMaSIF | Deep Learning Tool | A fingerprint-based method for predicting protein-protein interaction sites on surfaces. | Identifying the paratope region on an antibody using atomic coordinates and pLDDT scores [69] [66]. |
| SKEMPI/AB-Bind Database | Curated Dataset | Provides experimental data on binding free energy changes for mutant protein complexes. | Training and validating AI models for antibody-antigen affinity prediction [65]. |
The synergistic use of molecular dynamics simulations, AI-based affinity prediction, and flexibility analysis represents a transformative approach for the rational design of antibodies in diagnostic applications. For wheat allergen research, these computational strategies provide a powerful framework for developing highly sensitive and specific LFIAs. By enabling in-depth analysis of antibody-antigen interactions prior to costly experimental trials, these advanced computational protocols accelerate the development of reliable gluten detection tests that comply with regulatory standards and protect public health.
Assessing Performance: Validation, Comparison with Other Methods, and Real-World Application
Determining Limit of Detection (LOD) and Visual LOD (vLOD) in Food Matrices
The accurate determination of the Limit of Detection (LOD) and Visual Limit of Detection (vLOD) is a critical validation step in the development of gold nanoparticle (AuNP)-based lateral flow immunoassays (LFIAs) for detecting wheat allergens in food matrices. The LOD represents the lowest analyte concentration that an method can reliably detect, while the vLOD refers to the lowest concentration that can be visually determined without instrumentation [2]. For wheat allergens, specifically gliadin, regulatory standards set by the Codex Alimentarius and U.S. Food and Drug Administration establish a threshold of 20 parts per million (ppm) for "gluten-free" labeling, making this a critical value for assay sensitivity [3]. This protocol outlines standardized procedures for determining these essential parameters within the context of wheat allergen research, providing researchers with a framework for assay validation and performance assessment.
Theoretical Foundations of LOD and vLOD
Definition of Key Parameters
In LFIA development, LOD and vLOD represent distinct but complementary performance characteristics. The LOD is statistically derived and represents the lowest concentration at which a detection system can reliably distinguish the analyte from background noise, typically with a defined confidence level (often 95%) [70]. In contrast, the vLOD is the lowest analyte concentration that produces a visible test line discernible to the naked eye by a trained operator under standard lighting conditions [2]. For consumer-facing applications, the vLOD is particularly important as it determines the practical usability of the test without specialized equipment.
The International Conference on Harmonization (ICH) guidelines define standardized approaches for calculating these parameters. According to ICH Q2(R1), the LOD can be determined using the formula: LOD = 3.3σ/S, where σ represents the standard deviation of the response and S is the slope of the calibration curve [70]. Similarly, the Limit of Quantification (LOQ), which represents the lowest concentration that can be quantitatively determined with acceptable precision and accuracy, is calculated as LOQ = 10σ/S [70].
Performance Metrics in Food Allergen Detection
Table 1: Reported LOD and vLOD Values for Allergen Detection in Food Matrices
| Target Analyte | Matrix | LOD | vLOD | Detection Method | Reference |
|---|---|---|---|---|---|
| Wheat Gliadin | Milk | 6.56 ng/mL | 25 ng/mL | AuNP-LFIA | [2] |
| Gluten | Raw materials | 20 ppm | 20 ppm | AuNP-LFIA | [3] |
| Total Hazelnut Protein | Buffer | 0.05 ppm | N/R | Active flow immunoassay | [71] |
| Total Peanut Protein | Buffer | 0.05 ppm | N/R | Active flow immunoassay | [71] |
| Almond Protein | Food | 185 µg/kg | N/R | Lateral flow microimmunoassay | [72] |
| Peanut Protein | Food | 229 µg/kg | N/R | Lateral flow microimmunoassay | [72] |
N/R = Not reported
The variation in reported detection limits highlights the influence of matrix effects, antibody affinity, and nanoparticle labels on assay performance. For wheat allergen detection, the visual detection limit of 25 ng/mL for gliadin in milk represents a significant achievement, approaching the regulatory threshold of 20 ppm for gluten-free foods [2] [3].
Experimental Protocols for LOD and vLOD Determination
Reagent Preparation and Optimization
The foundation of a sensitive LFIA begins with optimized reagents. For wheat allergen detection, monoclonal antibodies (mAbs) targeting gliadin epitopes provide the necessary specificity. Antibody screening should identify pairs suitable for sandwich immunoassay format, with one antibody serving as the capture probe and the other conjugated to the detection label [2].
Gold Nanoparticle Conjugation Protocol:
- Synthesis of AuNPs: Prepare 20nm gold nanoparticles using the citrate reduction method of HAuCl₄. Characterize nanoparticles by FESEM and UV-Vis spectrophotometry to confirm size distribution and concentration [3].
- pH Optimization: Adjust AuNP solution to pH 8.0 using 0.1M K₂CO₃, as this pH provides optimal antibody conjugation without nanoparticle aggregation [3].
- Antibody Conjugation: Add gliadin-specific monoclonal antibody at a concentration of 1 µg/mL to the pH-adjusted AuNP solution. Incubate for 60 minutes at room temperature with gentle mixing [3].
- Stabilization: Block remaining surfaces with 1% bovine serum albumin (BSA) for 30 minutes.
- Purification: Centrifuge at 12,000 × g for 30 minutes, discard supernatant, and resuspend in storage buffer (10mM borate buffer, pH 8.0, containing 1% BSA, 5% sucrose, and 0.05% sodium azide) [3].
- Characterization: Verify successful conjugation by measuring the absorption spectrum shift from 520-523nm to 526-529nm, indicating increased particle size due to antibody adsorption [3].
LFIA Strip Assembly and Preparation
Table 2: Research Reagent Solutions for Wheat Allergen LFIA
| Component | Specifications | Function | Optimization Parameters |
|---|---|---|---|
| Gold Nanoparticles | 20nm, spherical, citrate-capped | Signal generation | Size uniformity (PDI <0.2), absorption peak 523nm |
| Anti-Gliadin mAb | Clone 6 (detection), Clone 7 (capture) | Analyte recognition | Pair with highest P/N value in checkerboard assay |
| Nitrocellulose Membrane | ~120-150s/4cm flow rate | Reaction platform | Mid-speed for optimal sensitivity/assay time balance |
| Sample Pad | Glass fiber | Sample filtration | Pre-treated with buffer containing surfactants |
| Absorption Pad | Cellulose | Waste reservoir | Sufficient capacity for 100µL sample volume |
| Running Buffer | 10mM borate, 1% BSA, 0.05% Tween-20 | Fluidics control | Optimized for flow rate and signal intensity |
The selection of membrane with flow rate of 120-150 seconds/4cm provides an optimal balance between sufficient binding time for sensitivity and reasonable assay duration [71]. Capture antibodies should be dispensed on the test line at a concentration of 2.0 mg/mL, with control line antibodies at 0.75 mg/mL [72].
Calibration Curve Generation and LOD Calculation
- Standard Preparation: Prepare gliadin standards in negative milk matrix at concentrations of 0, 5, 10, 20, 40, and 100 ng/mL using serial dilution [2].
- Assay Procedure: Apply 100µL of each standard to the sample pad and allow the reaction to proceed for 15 minutes at room temperature [3].
- Signal Measurement: For visual assessment, examine test lines under consistent lighting conditions. For instrumental LOD, capture images with a smartphone or scanner and analyze intensity using ImageJ software [72].
- Data Analysis: Plot signal intensity against concentration and perform linear regression analysis to determine the slope (S) and standard error (σ) of the calibration curve [70].
- LOD Calculation: Apply the ICH formula: LOD = 3.3 × σ / S [70].
- vLOD Determination: The vLOD is the lowest concentration where all trained operators (minimum of 3) consistently detect a visible test line compared to a blank control [2].
Method Validation
Validate calculated LOD and vLOD values by testing replicate samples (n=6) at the estimated limits. The LOD should consistently demonstrate a signal-to-noise ratio of 3:1, while the vLOD should be visually detectable in ≥95% of replicates [70]. Include internal controls for hook effect evaluation by testing high-concentration samples (≥1000 ng/mL) to ensure signal reduction does not cause false negatives at elevated analyte levels [72].
Workflow Integration and Data Analysis
The following workflow illustrates the complete procedure for determining LOD and vLOD in wheat allergen LFIA:
Figure 1: Complete workflow for LOD and vLOD determination in wheat allergen LFIA development
Advanced Statistical Approaches
For more sophisticated applications requiring high precision, consider the uncertainty profile method, which combines tolerance intervals and measurement uncertainty for realistic LOD assessment [73]. This approach calculates β-content tolerance intervals to define the validity domain of the method, with the LOQ represented by the intersection point of the uncertainty profile and acceptability limits [73]. This method is particularly valuable when validating assays for regulatory submission or when comparing performance across multiple platforms.
The following diagram illustrates the decision process for LOD calculation method selection:
Figure 2: Decision tree for selecting appropriate LOD calculation methodology based on application requirements
Troubleshooting and Technical Considerations
Common Challenges in LOD Determination
Matrix Interference: Food matrices can significantly impact LOD values. For example, sanitizing agents in production environments may reduce detection sensitivity by one-to fourfold [74]. To address this, always perform LOD determination in the relevant food matrix rather than buffer alone, and include matrix-matched controls in validation studies.
Hook Effect: High analyte concentrations may saturate binding sites, leading to false negatives. Incorporate hook effect controls by testing high-concentration samples (≥1000 ng/mL) and design the assay with sufficient dynamic range [72].
Operator Variability: For vLOD determination, train multiple operators (minimum of 3) and establish consistent lighting and viewing conditions to minimize subjective interpretation [2].
Enhancing Detection Sensitivity
Several strategies can improve LOD in AuNP-based LFIAs:
- Antibody Affinity Maturation: Select antibodies with fast association rates through surface plasmon resonance screening [71].
- Nanoparticle Optimization: Smaller AuNPs (10-15nm) may provide higher labeling density, though 20nm offers optimal visual detection [3].
- Flow Rate Control: Membranes with slower flow rates increase binding time and may improve sensitivity, though they extend assay duration [71].
Robust determination of LOD and vLOD is essential for developing reliable AuNP-based LFIAs for wheat allergen detection in food matrices. The protocols outlined herein, incorporating both ICH-compliant statistical approaches and practical visual assessment methods, provide a comprehensive framework for assay validation. By following these standardized procedures and considering matrix-specific effects, researchers can generate reproducible, reliable detection limits that ensure consumer protection and regulatory compliance for gluten-free food labeling. The integration of traditional calibration curve methods with advanced uncertainty profiling offers flexibility for applications ranging from rapid screening to rigorous quantitative analysis.
Analyzing Cross-Reactivity with Other Allergens and Cereals
Cross-reactivity in cereal allergies presents a significant diagnostic challenge, complicating the clinical management of affected individuals. The immunological phenomenon occurs when IgE antibodies originally directed against specific wheat proteins recognize structurally similar proteins in other grains and grasses. Molecular divergence between soluble allergens and gluten-derived proteins underpins the complex spectrum of cereal allergy, with distinct sensitization patterns requiring precise differentiation [75]. Understanding these cross-reactive pathways is essential for developing accurate diagnostic tools, including gold nanoparticle-based lateral flow immunoassays (LFIA), which can provide rapid, on-site detection of allergenic components in food products [3].
The clinical implications of cereal cross-reactivity range from mild oral allergy syndrome to severe, life-threatening anaphylaxis, particularly in cases of wheat-dependent exercise-induced anaphylaxis (WDEIA) [76]. Research demonstrates that sensitization to specific wheat allergens follows distinct immunological pathways, with limited co-sensitization between soluble and gluten-related proteins [75]. This mechanistic divergence necessitates component-resolved diagnostics that can identify specific IgE reactivity patterns to guide dietary recommendations and therapeutic interventions.
Molecular Basis of Wheat and Cereal Cross-Reactivity
Key Wheat Allergens and Their Cross-Reactive Counterparts
Wheat contains multiple allergenic proteins that exhibit varying degrees of cross-reactivity with other cereals and pollens. The major characterized allergens include:
Tri a 14 (non-specific lipid transfer protein): Demonstrates high sequence identity (72%) with maize-derived nsLTPs, suggesting broad cross-reactivity across multiple cereal species [75]. This protein is frequently associated with oral allergy syndrome and sometimes severe reactions, remaining stable to heat and digestion [76].
Tri a 19 (Omega-5-gliadin): Represents a major allergen in WDEIA and is typically exclusive to gluten-containing cereals [75]. This gluten-derived protein serves as a marker for severe allergy reactions after wheat ingestion accompanied by physical exercise [76].
Tri a 30 (secalin-like protein): Exhibits homologs in spelt and durum wheat, though with more restricted cross-reactivity patterns compared to Tri a 14 [75].
Epidemiological data reveals that sensitization to defined wheat allergens is relatively rare (3.9% of allergic individuals), with Tri a 14 being the most frequently recognized (64% of wheat-sensitized cases), followed by Tri a 30 (23%) and Tri a 19 (18%) [75]. The limited co-sensitization between these components indicates distinct IgE response pathways to soluble versus gluten-derived wheat proteins.
Clinical Significance of Cross-Reactive Patterns
The cross-reactivity patterns between wheat and other cereals have direct clinical implications:
Tri a 14-mediated cross-reactivity: Frequently co-sensitizes with nsLTPs from both gluten-containing and gluten-free cereals, potentially necessitating broad dietary restrictions in sensitized individuals [75].
Tri a 19-mediated reactivity: Exclusive to gluten-containing species (wheat, rye, barley), allowing for more targeted dietary management [75].
Grass pollen association: Cross-reactivity between wheat and grass pollen allergens (e.g., Phl p 12) typically manifests as mild symptoms like oral allergy syndrome, with heat-labile proteins that often permit tolerance of cooked foods [76].
Table 1: Major Wheat Allergens and Their Cross-Reactivity Profiles
| Allergen | Protein Family | Cross-Reactive Species | Clinical Manifestations | Heat Stability |
|---|---|---|---|---|
| Tri a 14 | nsLTP | Maize, other cereals | OAS, sometimes severe reactions | Stable |
| Tri a 19 | Omega-5-gliadin | Rye, barley | WDEIA, severe systemic reactions | Stable |
| Tri a 30 | Secalin-like | Spelt, durum wheat | Not specified | Not specified |
| Gliadin | Gluten protein | Rye, barley | Immediate wheat allergy, severe reactions | Stable |
| Phl p 12 | Profilin | Grass pollens, various plant foods | Mild OAS | Labile |
Experimental Protocols for Cross-Reactivity Analysis
Gold Nanoparticle-Based Lateral Flow Immunoassay for Gluten Detection
The development of a lateral flow test strip (LFTS) for gluten detection provides a rapid method for identifying cereal allergens in food samples, with particular relevance for detecting cross-contamination in products labeled as gluten-free [3].
Materials and Reagents
- Gold nanoparticles (AuNPs): Approximately 20nm diameter, synthesized by citrate reduction of HAuCl₄
- Gliadin monoclonal antibodies: Specifically targeting the immunodominant sequence PQPQLPY in the gliadin peptide
- Nitrate membrane: For immobilization of capture reagents
- Sample extraction solution: For preparing food samples
- Conjugate pad: For dispensing antibody-AuNP conjugates
- Absorbent pad: For facilitating capillary flow
AuNP Synthesis and Characterization
- Synthesis: Prepare 20nm AuNPs via citrate reduction method involving nucleation (reduction of HAuCl₄ to gold atoms), growth, and agglomeration of atoms into nanoclusters.
- Characterization: Verify AuNP size distribution and average diameter using field emission scanning electron microscopy (FESEM) and ultraviolet-visible (UV-VIS) light spectrophotometry.
- Quality assessment: Determine hydrodynamic diameter using dynamic light scattering, with expected diameter of ~23nm and polydispersity index of 0.1.
- Spectral confirmation: Ensure narrow absorption peak at 523nm, indicating uniform, spherical AuNPs.
Antibody Conjugation and Optimization
- pH optimization: Adjust AuNP solution to pH 8.0, determined as optimal for conjugation efficiency through color stability testing after NaCl addition.
- Antibody concentration: Use gliadin monoclonal antibody at 1μg/mL, determined as the highest concentration that maintains stable, conjugated AuNPs without aggregation.
- Conjugation validation: Confirm successful conjugation through FESEM imaging showing slight increase in nanoparticle size (~23.5nm) and UV-VIS spectral shift from 520-523nm to 526-529nm.
Test Strip Assembly and Procedure
- Strip configuration: Immobilize gliadin monoclonal antibodies on the membrane in the test zone as capture reagents.
- Sample preparation: Extract food samples using appropriate buffers, requiring only 40μL of extracted sample per test.
- Test execution: Apply sample to the strip and allow capillary flow for 15 minutes.
- Result interpretation:
- Positive: Appearance of both test and control lines indicates ≥20ppm gluten
- Negative: Appearance of only control line indicates <20ppm gluten
Lateral Flow Immunoassay Workflow: This diagram illustrates the sequential process of gluten detection using gold nanoparticle-based lateral flow immunoassay, from sample application to result interpretation.
Assessment of Cross-Reactivity Using Multiplex Platforms
For comprehensive analysis of cereal cross-reactivity patterns, researchers can employ multiplex diagnostic platforms:
Component-Resolved Diagnostic Protocol
- Sample collection: Obtain serum samples from patients with suspected cereal allergy.
- IgE profiling: Utilize multiplex platforms (ImmunoCAP ISAC and ALEX2) to evaluate IgE reactivity to major wheat allergens and their homologs [75].
- Data analysis: Assess sequence homology using BLAST analysis across cereal and pseudocereal proteomes.
- Clinical correlation: Integrate immunological findings with clinical presentation data, including symptom profiles and reaction severity.
Cross-Reactivity Validation Protocol
- Protein extraction: Prepare protein extracts from various cereals (wheat, barley, rye, maize, rice).
- Immunoblotting: Separate proteins via SDS-PAGE and transfer to membranes for IgE reactivity testing.
- Inhibition assays: Pre-incubate patient sera with potential cross-reactive allergens before testing against primary wheat allergens.
- Epitope mapping: Identify conserved epitopes responsible for cross-reactivity using peptide-based assays.
Table 2: Analytical Performance of Gluten Detection Methods
| Method | Detection Limit | Analysis Time | Equipment Needs | Cross-Reactivity Assessment |
|---|---|---|---|---|
| Gold nanoparticle LFIA | 20 ppm | 15 minutes | None | Limited to targeted epitopes |
| ELISA | Variable | 2-4 hours | Plate reader | Moderate |
| PCR | Variable | 4-6 hours | Thermal cycler, electrophoresis | Species-specific |
| HPLC | <10 ppm | 30-60 minutes | HPLC system | Limited |
| LC-MS/MS | <5 ppm | 60+ minutes | Mass spectrometer | Comprehensive |
The Scientist's Toolkit: Essential Research Reagents
Table 3: Key Research Reagent Solutions for Wheat Allergen Detection
| Reagent/Material | Function | Specifications | Application Notes |
|---|---|---|---|
| Gliadin monoclonal antibody | Targets immunodominant sequence PQPQLPY | Specific for 33-mer peptide of alpha 2-gliadin | Critical for both capture and detection in LFIA |
| Colloidal gold nanoparticles | Visual detection label | ~20nm diameter, spherical | Biocompatible with unique optical properties |
| Nitrate membrane | Platform for immunochromatography | Pore size optimized for capillary flow | Immobilizes capture antibodies in test zone |
| Tri a 14 recombinant protein | nsLTP allergen standard | High sequence identity with cereal nsLTPs | Essential for assay calibration and validation |
| Tri a 19 recombinant protein | Omega-5-gliadin standard | Marker for WDEIA | Useful for assessing severe allergy risk |
| Reference flour samples | Matrix-matched controls | Certified gluten content | Critical for avoiding false positives/negatives |
| Sample extraction solution | Protein solubilization | Optimized for gluten extraction | Maximizes recovery from processed foods |
Data Interpretation and Clinical Correlation
Analyzing Cross-Reactivity Patterns
The interpretation of cross-reactivity data requires understanding both molecular relationships and clinical manifestations:
Cross-Reactivity Clinical Pathways: This diagram illustrates the relationship between specific wheat protein sensitization and clinical manifestations of cross-reactivity with other cereals and pollens.
Methodological Considerations for Assay Development
When developing detection assays for wheat allergens and their cross-reactive counterparts, several methodological aspects require attention:
Epitope conservation: The PQPQLPY sequence in gliadin represents an immunodominant epitope highly conserved across wheat, barley, and rye, explaining the extensive cross-reactivity between these gluten-containing cereals [3].
Matrix effects: Food processing techniques, including high hydrostatic pressure treatment, can significantly alter allergenicity by modifying protein structures, potentially affecting antibody recognition in immunoassays [77].
Threshold detection: The 20 ppm detection limit aligns with the Codex Alimentarius standard for gluten-free foods, providing a clinically relevant cutoff for protecting sensitive individuals [3].
Validation requirements: Assays must be validated against both purified allergen standards and real-world food matrices to ensure accurate detection across varied sample types.
The integration of component-resolved diagnostics with clinical assessment enables precise identification of relevant cross-reactivity patterns, guiding appropriate dietary recommendations and management strategies for individuals with cereal allergies [75] [76]. The development of rapid, reliable detection methods such as gold nanoparticle-based LFIA provides valuable tools for both clinical diagnostics and food safety monitoring, contributing to improved quality of life for affected individuals.
The accurate detection of food allergens is a critical component of food safety, public health, and regulatory compliance. For researchers focusing on wheat allergen analysis, selecting the appropriate analytical method is paramount. This application note provides a detailed comparative analysis of four principal detection methodologies—Lateral Flow Immunoassay (LFIA), Enzyme-Linked Immunosorbent Assay (ELISA), Polymerase Chain Reaction (PCR), and High-Performance Liquid Chromatography-Tandem Mass Spectrometry (HPLC-MS/MS)—within the specific context of developing a gold nanoparticle-based LFIA for wheat allergens. We present structured quantitative comparisons, detailed experimental protocols, and strategic guidance to inform method selection and implementation for research and development professionals.
The following table summarizes the core characteristics, advantages, and limitations of each detection method, providing a foundation for comparative analysis.
Table 1: Core Characteristics of Allergen Detection Methods
| Method | Detection Principle | Key Advantage | Primary Limitation | Typical Analysis Time |
|---|---|---|---|---|
| LFIA | Immuno-chromatography with AuNP labels [3] [78] | Extreme ease of use; no specialized equipment needed; ideal for rapid, on-site screening [79] [78] | Lower sensitivity and semi-quantitative nature compared to other methods [79] [78] | ~15-20 minutes [3] |
| ELISA | Immunoassay with enzyme-mediated colorimetric detection [80] [79] | High sensitivity and specificity; well-established, quantitative gold standard [79] | Susceptible to protein denaturation from food processing; may exhibit cross-reactivity [80] [79] | Several hours (>2 hours) [79] |
| PCR | Amplification of species-specific DNA sequences [80] [81] | High sensitivity and specificity for DNA; robust in processed foods where proteins may degrade [79] [81] | Does not detect the allergenic protein itself; results can be influenced by food matrix and processing [80] [81] | 1.5 - 3 hours (including DNA extraction) [81] |
| HPLC-MS/MS | Detection of proteotypic peptides via mass spectrometry [82] [80] | Unparalleled specificity and ability to multiplex; can detect multiple allergens simultaneously [82] [80] | High equipment cost, requires significant expertise, and complex data analysis [80] [79] | 30 - 60 minutes (run time, excluding sample prep) [80] |
Quantitative Performance Metrics
For research and development, understanding the quantitative performance of each technique is crucial for benchmarking and goal-setting.
Table 2: Quantitative Performance Comparison for Allergen Detection
| Method | Sensitivity (Limit of Detection) | Quantitative Capability | Multiplexing Potential |
|---|---|---|---|
| LFIA | ~20 ppm for gluten; can be enhanced to ~0.001 ng/mL with advanced nanomaterials [3] [78] | Semi-quantitative (visual); quantitative with reader instrumentation [21] [78] | Limited, but possible with multiple test lines [78] |
| ELISA | Varies by target; can be very high (e.g., comparable to LC-MS/MS for some targets) [79] | Fully quantitative [79] | Low (typically single-analyte per well) |
| PCR | High; can detect below 10 copies of target DNA [79] | Fully quantitative (qPCR) [80] [81] | Moderate (multiplex qPCR) [79] |
| HPLC-MS/MS | Exceptionally high; as low as 0.0005% (5 ppm) for silkworm in model cookies [80] | Fully quantitative with use of isotope-labeled internal standards [80] | High (can detect dozens of allergens in a single run) [82] [80] |
Detailed Experimental Protocols
Protocol: Gold Nanoparticle-Based LFIA for Gluten Detection
This protocol outlines the development of a sandwich-style LFIA for the detection of gliadin, a toxic component of gluten, using gold nanoparticle (AuNP) conjugates [3].
Research Reagent Solutions & Materials:
Table 3: Essential Reagents for AuNP-LFIA Development
| Reagent/Material | Function | Brief Explanation |
|---|---|---|
| Gliadin Monoclonal Antibody | Primary biorecognition element | Specifically binds to the immunodominant peptide (QPQLPY) in gliadin [3]. |
| Colloidal Gold Nanoparticles (~20 nm) | Signal label | Provides a red color due to surface plasmon resonance, enabling visual detection [3]. |
| Nitrocellulose Membrane | Chromatographic substrate | Serves as the platform for capillary flow and immobilization of capture reagents [83]. |
| Conjugate Pad | Reagent release | Stores lyophilized antibody-AuNP conjugates for release upon sample application. |
| Anti-Species Antibody | Control line reagent | Binds the AuNP-antibody conjugate to validate strip functionality [21]. |
Procedure:
- AuNP-Antibody Conjugation: Synthesize or procure ~20 nm colloidal AuNPs. Adjust the pH of the AuNP solution to 8.0 using a mild buffer (e.g., 2-10 mM K₂CO₃). Incubate the AuNPs with the gliadin monoclonal antibody at an optimized concentration (e.g., 1 µg/mL) for 30-60 minutes. Block remaining surfaces with a stabilizing agent like BSA or PEG. Purify the conjugate via centrifugation and resuspend in a suitable storage buffer [3].
- Strip Assembly: On a nitrocellulose membrane, dispense the capture gliadin monoclonal antibody at the test line (T) and an anti-species antibody at the control line (C). Dry the membrane thoroughly. The conjugate pad is sprayed with the purified AuNP-antibody conjugate and dried. Assemble the strip by overlapping the sample pad, conjugate pad, nitrocellulose membrane, and absorbent pad on a backing card [3] [21].
- Assay Execution: Apply 40-100 µL of the extracted sample to the sample pad. Allow the sample to migrate via capillary action for 15 minutes. For liquid samples like milk, minimal extraction is needed, while solid foods require gliadin extraction with a suitable alcohol-based solution [3].
- Result Interpretation:
- Positive: Both control (C) and test (T) lines are visible.
- Negative: Only the control (C) line is visible.
- Invalid: The control (C) line does not appear.
Protocol: PCR for Detection of Wheat Allergen Genes
This protocol is adapted from a study on detecting wheat glutenin genes in processed foods [81].
Procedure:
- DNA Extraction: Grind 100 mg of the food sample to a fine powder. Extract genomic DNA using a CTAB-based method. Briefly, incubate the sample with CTAB buffer and proteinase K at 65°C. Treat with RNase A, perform chloroform extraction, precipitate DNA with isopropanol, wash with ethanol, and resuspend the pellet in nuclease-free water. Quantify DNA purity and concentration using UV-Vis spectrophotometry [81].
- Primer Design: Design primers targeting short, stable regions of the wheat allergen genes (e.g., High/Low Molecular Weight Glutenin subunits). To ensure reliability in processed foods, the amplicon size should be kept short, ideally between 200-300 base pairs, to accommodate potential DNA fragmentation [81].
- PCR Amplification: Prepare a reaction mix containing: 1x PCR buffer, 2.5 mM MgCl₂, 0.2 mM dNTPs, 0.2 µM of each forward and reverse primer, 1.25 U of DNA polymerase, and 50-100 ng of template DNA. Run the amplification in a thermal cycler with a program such as: initial denaturation at 95°C for 5 min; 35-40 cycles of denaturation at 95°C for 30 s, annealing at 60°C for 30 s, and extension at 72°C for 45 s; final extension at 72°C for 7 min [81].
- Analysis: Analyze the PCR products by agarose gel electrophoresis (e.g., 2% gel) and visualize under UV light to confirm the presence of the target amplicon.
Protocol: HPLC-MS/MS for Multiplex Allergen Detection
This protocol summarizes the targeted proteomic approach for detecting and quantifying specific allergen-derived peptides [80].
Procedure:
- Protein Extraction and Digestion: Extract proteins from the food matrix using a suitable buffer. Reduce and alkylate the proteins. Digest the protein extract into peptides using a sequence-specific protease, most commonly trypsin, overnight at 37°C [80].
- Liquid Chromatography: Separate the resulting peptides using reverse-phase HPLC (e.g., C18 column) with a gradient of water and acetonitrile, both containing 0.1% formic acid, to resolve the peptide mixture prior to mass spectrometry analysis [80].
- Mass Spectrometry Analysis: Introduce the eluting peptides into the mass spectrometer via electrospray ionization. Operate the mass spectrometer in Multiple Reaction Monitoring (MRM) mode. For each target allergen peptide (e.g., specific peptides from Ara h 3/6 for peanut, Bos d 5 for milk), pre-define the specific precursor ion (parent mass) and its most abundant fragment ions (product masses). This allows for highly selective and sensitive detection of multiple allergens simultaneously [82] [80].
- Quantification: Use stable isotope-labeled versions of the target peptides as internal standards. These are added to the sample at a known concentration before digestion. Quantify the native allergen peptides by comparing their signal intensity to that of the labeled internal standard, correcting for sample preparation and ionization variability [80].
Workflow and Method Selection Diagrams
The following diagrams visualize the procedural workflow of a typical LFIA and a logical framework for selecting the appropriate detection method.
Diagram 1: LFIA Experimental Workflow
Diagram 2: Method Selection Logic Framework
The choice between LFIA, ELISA, PCR, and HPLC-MS/MS is dictated by the specific requirements of the research question. For the development of a gold nanoparticle-based LFIA for wheat allergens, ELISA and HPLC-MS/MS serve as indispensable tools for initial assay development and validation due to their high sensitivity and precision. PCR offers a robust alternative for verifying the presence of wheat, especially in processed matrices. The final optimized LFIA stands as a powerful tool for rapid, user-friendly screening, fulfilling a distinct niche in the researcher's toolkit. A synergistic approach, leveraging the strengths of each method, often yields the most reliable and comprehensive results in allergen research.
Evaluating Recovery Rates and Assay Precision in Spiked Samples
This application note provides a detailed framework for evaluating the analytical performance of a gold nanoparticle-based lateral flow immunoassay (LFIA) for the detection of wheat allergens, with a specific focus on establishing recovery rates and assay precision using spiked samples. The data and protocols are contextualized within the development of a method for detecting wheat gliadin in milk, a clinically significant allergen. The procedures outlined are essential for researchers and scientists to validate robust, reliable, and quantitative LFIA systems for food safety and diagnostic applications.
For a lateral flow immunoassay to be considered reliable for real-world applications, it must demonstrate consistent and accurate detection of the target analyte across various sample matrices. The process of spiking a known quantity of the pure analyte (e.g., gliadin) into a negative sample matrix (e.g., allergen-free milk) and then measuring the amount recovered is a cornerstone of method validation. The recovery rate indicates the accuracy of the assay, revealing potential matrix interferences. The assay precision, expressed as the coefficient of variation (CV%), measures the reproducibility of results across multiple replicates. Together, these parameters form the basis for demonstrating that an LFIA is fit for its intended purpose, whether for research, quality control, or clinical monitoring [2] [84].
Key Experimental Data from Model Systems
The following table summarizes key performance data for gold nanoparticle-based LFIAs from relevant studies, which can serve as benchmarks for wheat allergen assay development.
Table 1: Analytical Performance of Gold Nanoparticle-based LFIAs in Spiked Samples
| Target Analyte | Sample Matrix | Recovery Rate (%) | Precision (CV%) | Limit of Detection (LOD) | Citation |
|---|---|---|---|---|---|
| Wheat Gliadin | Milk | 99.16 – 100.07% | Not Specified | 6.56 ng/mL (calculated) | [2] |
| Dichlorvos (DDVP) | Fruits & Vegetables | 87.3 – 109.4% | < 8.3% | 16-108 μg/kg (matrix-dependent) | [84] |
| JWH-200 (Synthetic Cannabinoid) | Oral Fluids | 82 – 134% | Not Specified | 0.08 ± 0.04 ng/mL | [85] |
Detailed Experimental Protocol for Spiked Sample Analysis
This protocol is adapted from published methods for wheat allergen detection and other relevant assays [2] [84].
Materials and Reagents
- Negative Control Matrix: The sample material known to be free of the target analyte. For food allergen research, this could be a certified allergen-free milk or a blank food slurry [2] [86].
- Standard Solution: Purified target analyte (e.g., gliadin from Sigma-Aldrich) of known concentration, prepared in an appropriate solvent [2].
- Gold Nanoparticle Conjugate: Anti-gliadin monoclonal antibody (e.g., mAb 6) conjugated to ~40 nm gold nanoparticles [2] [46].
- Lateral Flow Strips: Strips comprising a sample pad, conjugate pad, nitrocellulose membrane with immobilized capture antibody (e.g., mAb 7) at the test line and control line, and an absorbent pad [2] [87].
- Strip Reader: A portable fluorescence or reflectance reader for quantitative analysis. A smartphone-based imaging system can also be calibrated for this purpose [46].
Procedure
Step 1: Preparation of Spiked Samples
- Prepare a series of calibration standards by performing serial dilutions of the gliadin stock solution in a suitable buffer.
- Spike the negative control milk matrix with the gliadin standards to create a calibration curve covering the expected dynamic range of the assay (e.g., 0–1000 ng/mL). Each concentration should be prepared in multiple replicates (n ≥ 3) for precision calculation [2].
- Additionally, prepare quality control (QC) samples at low, medium, and high concentrations within the assay range for accuracy and precision monitoring.
Step 2: Sample Processing and LFIA Execution
- If necessary, pre-treat the spiked milk samples according to the optimized protocol (e.g., dilution, centrifugation). The study on wheat allergens used a buffered-detergent extraction [2].
- Apply a fixed volume (e.g., 100 µL) of each spiked sample to the sample pad of the LFIA strip.
- Allow the assay to develop for the specified time (e.g., 20 minutes) at room temperature [84].
Step 3: Data Acquisition
- After the development time, use a strip reader or a smartphone-based setup to measure the signal intensity at the test line (T) and control line (C). The result can be expressed as a T/C ratio for quantitative analysis [46].
Step 4: Data Analysis and Calculation
- Calibration Curve: Plot the average T/C ratio against the known concentration of the spiked gliadin standards. Fit a curve (e.g., 4-parameter logistic) to the data.
- Recovery Rate Calculation: For each spiked sample (both calibration and QC levels), calculate the measured concentration from the calibration curve. The recovery rate is then calculated as:
- Precision Calculation: Calculate the mean, standard deviation (SD), and coefficient of variation (CV%) for the measured concentrations of the replicate samples at each level.
- CV (%) = (Standard Deviation / Mean) × 100 [84].
The workflow below illustrates the logical sequence of the spiked sample analysis protocol.
The Scientist's Toolkit: Research Reagent Solutions
Table 2: Essential Reagents and Materials for LFIA Development
| Item | Function / Role in the Assay | Example from Literature |
|---|---|---|
| Monoclonal Antibody Pair | A matched capture and detection antibody pair specific to the target analyte is critical for a sandwich-style LFIA. | Anti-gliadin mAb 7 (capture) and mAb 6 (detection) [2]. |
| Gold Nanoparticles (40 nm) | Serve as the visual and spectroscopic label; conjugated to the detection antibody. | Citrate-capped AuNPs synthesized from HAuCl4 [84] [88] [46]. |
| Nitrocellulose Membrane | The porous matrix on which capture antibodies are striped to form test and control lines. | HiFlow Plus membrane from Millipore [87] [46]. |
| Blocking & Stabilization Buffers | Used to pre-treat sample/conjugate pads and stabilize the conjugate to prevent non-specific binding and ensure long-term stability. | PBS with BSA and sucrose [2] [87]. |
| Reference Material | Highly purified analyte used for spiking experiments to establish ground truth for recovery calculations. | Gliadin from Sigma-Aldrich [2]. |
Troubleshooting and Critical Factors for Success
- Matrix Effects: If recovery rates are consistently outside the acceptable range (e.g., 80-120%), the sample matrix is likely interfering. Re-optimize the sample extraction and dilution protocol to mitigate these effects [86].
- Poor Precision (High CV%): High variability between replicates can stem from inconsistent sample application, uneven flow in the strip, or unstable conjugate. Ensure homogeneous mixing of samples and check the dispensing quality of the conjugate and capture lines.
- Optimization of Antibody Pair: The sensitivity and specificity of the assay are fundamentally determined by the selected antibodies. A thorough pairwise interaction analysis, as performed in the wheat allergen study, is essential to identify the optimal capture/detection combination [2].
- Signal Amplification: For targets requiring ultra-high sensitivity, consider advanced signal amplification strategies, such as using polylysine chains and biotin-streptavidin systems to load more labels per binding event, which can lower the LOD by up to 100-fold [87].
Wheat gluten allergy and celiac disease represent significant global health concerns, with gliadin being the primary trigger protein [2]. The detection of trace amounts of wheat allergens in food products is crucial for consumer safety, particularly given the strict thresholds for gluten-free products, which must contain less than 20 parts per million (ppm) of gluten [67]. Traditional detection methods like enzyme-linked immunosorbent assay (ELISA) and polymerase chain reaction (PCR) often involve complex procedures, require specialized equipment, and are time-consuming [2].
Gold nanoparticle-based lateral flow immunoassays (LFIA) have emerged as a powerful alternative, combining rapid results with high sensitivity and specificity suitable for on-site testing [2]. This case study examines the successful application of this technology for detecting gliadin in milk and processed foods, detailing the experimental protocols, performance characteristics, and practical implementation of this method within the broader context of wheat allergen research.
Key Experimental Findings and Performance Data
The developed LFIA demonstrated excellent analytical performance for gliadin detection in milk and food matrices, as summarized in the table below.
Table 1: Performance characteristics of the gold nanoparticle-based lateral flow immunoassay for gliadin detection
| Parameter | Sandwich ELISA | LFIA Strips |
|---|---|---|
| Limit of Detection (LOD) | 60 ng/mL [2] | Visual LOD: 25 ng/mL [2] |
| Calculated LOD | Not applicable | 6.56 ng/mL [2] |
| Average Recovery | 99.16%–100.07% [2] | Highly consistent with ELISA results [2] |
| Cross-Reactivity | Negligible to other allergens [2] | Not specified |
| Analysis Time | Several hours | <15 minutes [2] [7] |
Advanced Multiplexed and Quantitative Systems
Recent advancements have integrated smartphone-based image analysis to enhance the utility of LFIAs. The LEO (Lateral flow Enhanced by Optical imaging) system enables quantification with sensitivity below the FDA's 20 ppm threshold and over 98% accuracy [67]. This system utilizes a unique three-line design (O, E, L lines) that combines competitive and sandwich detection formats on a single strip, allowing detection results to be converted into a binary code for precise interpretation [67].
Table 2: Comparison of nanoparticle labels for lateral flow immunoassays
| Nanoparticle Type | Color | Relative Detection Limit | Key Characteristics |
|---|---|---|---|
| Gold Nanoparticles (Au NPs) | Red | 10⁴ CFU/mL [19] | Excellent optical properties, easy conjugation [19] |
| Au-core/Pt-shell NPs | Black | 10³ CFU/mL [19] | Enhanced catalytic activity [19] |
| Latex Nanoparticles | Green | 10⁴ CFU/mL [19] | Stable, well-dispersed [19] |
| Magnetic Nanoparticles | Brown | 10⁵ CFU/mL [19] | Potential for sample concentration [19] |
Experimental Protocols
Production of Monoclonal Antibodies Against Gliadin
Immunization and Cell Fusion:
- Immunize mice with purified gliadin antigen using Freund's complete adjuvant for initial injection and Freund's incomplete adjuvant for boosts [2].
- Perform pairwise interaction analysis of all obtained monoclonal antibodies (mAbs) to identify optimal pairs for sandwich assay development [2].
- Select capture antibody (mAb 7) and detection antibody (mAb 6) based on highest P/N value and lowest background in negative controls [2].
Antibody Purification and Characterization:
- Purify selected antibodies using saturated ammonium sulfate method [2].
- Determine antibody affinity through sandwich ELISA with systematic optimization of coating and detection antibody concentrations [2].
Gold Nanoparticle Synthesis and Conjugation
Citrate Reduction Synthesis of AuNPs:
- Add 1 mL of 1% HAuCl₄ to 95 mL deionized water and heat to boiling with continuous stirring [19].
- Rapidly add 4 mL of 1% sodium citrate to the boiling solution [19].
- Continue boiling for 30 minutes until the solution turns deep red, indicating nanoparticle formation [19].
- Cool the solution to room temperature and store at 4°C in amber containers or foil-covered vessels [89].
Antibody Conjugation to AuNPs:
- Adjust pH of AuNP solution to 9.5 using appropriate buffers [2].
- Add purified anti-gliadin mAb 6 at a ratio of 12 µg per 1 mL of AuNP solution [2].
- Incubate for 1 hour at room temperature with continuous mixing [2].
- Add bovine serum albumin (BSA) to a final concentration of 0.25% as a blocking reagent [2].
- Centrifuge at 15,000 × g for 30 minutes to separate AuNP conjugates from unbound antibodies [2].
- Resuspend the conjugate pellet in storage buffer (10 mM Tris, pH 7.4, 0.25% BSA, 0.05% Tween 20, 1% sucrose) [2].
Lateral Flow Strip Assembly and Testing
Membrane Preparation:
- Dispense capture antibody (mAb 7) and gliadin (for competitive line) onto nitrocellulose membrane at 1 µL/cm using a quantitative dispensing system [67] [40].
- Prepare the conjugate pad by immersing glass fibre pad in conjugate buffer containing AuNP-mAb 6 conjugates [2] [90].
- Dry all components overnight and assemble the strip components (sample pad, conjugate pad, membrane, absorbent sink) on a backing card [2] [40].
Sample Preparation and Testing:
- Extract gliadin from food samples using specialized extraction buffers, such as ionic liquid-based solutions for rapid extraction (3 minutes) [67].
- Apply 30 µL of sample to the sample pad and allow to migrate for 15 minutes [90].
- Interpret results visually or using smartphone-based imaging systems [67].
The Scientist's Toolkit: Essential Research Reagents and Materials
Table 3: Key research reagent solutions for gold nanoparticle-based LFIA development
| Reagent/Material | Function | Specifications/Alternatives |
|---|---|---|
| Anti-gliadin mAbs | Core recognition elements | Clone mAb 7 (capture), mAb 6 (detection) [2] |
| Gold(III) chloride | Gold nanoparticle precursor | 1 mM solution for citrate reduction synthesis [19] |
| Nitrocellulose membrane | Assay platform | Varying flow rates (e.g., Immunopore vs AE membranes) [40] |
| Conjugate release pad | Reservoir for AuNP-antibody | Glass fiber pretreated with blocking reagents [40] |
| Capture antibody dispensing | Membrane patterning | Quantitative dispensing system (e.g., BioDot Quanti BioJet) [40] |
Technological Workflows and Signaling Mechanisms
LFIA Strip Architecture and Detection Principle
LFIA Strip Components and Flow
Advanced Multicolor Detection System
Multicolor Detection Logic
Discussion and Implementation Considerations
The successful implementation of this gold nanoparticle-based LFIA for gliadin detection demonstrates several advantages over traditional methods. The visual limit of detection of 25 ng/mL and calculated LOD of 6.56 ng/mL in milk samples provides sufficient sensitivity to detect gluten contamination below the 20 ppm regulatory threshold [2] [67]. The high consistency between LFIA results and sandwich ELISA validation confirms the reliability of this rapid method [2].
For researchers implementing this protocol, several factors require careful optimization:
- Antibody pairing: Systematic screening of monoclonal antibody pairs is essential for optimal sandwich assay performance [2].
- Membrane selection: Nitrocellulose membranes with appropriate capillary rise times must be selected to balance flow rate and detection sensitivity [40].
- Conjugate application: Quantitative dispensing systems provide more consistent results than immersion methods for applying detection conjugates to pads [40].
- Sample preparation: Efficient extraction of hydrophobic gliadin proteins from complex food matrices may require specialized buffers, such as ionic liquids [67].
The integration of smartphone-based reading systems and multicolor detection technologies represents the future direction of LFIA development, enabling quantitative analysis, digital connectivity, and enhanced sensitivity while maintaining the simplicity of lateral flow platforms [67] [7] [91].
Benchmarking Against International Standards (e.g., Codex 20 ppm Gluten-Free Threshold)
For the millions of individuals with celiac disease, adherence to a strict gluten-free diet is the only current treatment, making reliable food labeling a critical health issue [92]. The Codex Alimentarius and subsequent regulatory bodies like the U.S. Food and Drug Administration (FDA) have established that foods labeled "gluten-free" must contain less than 20 parts per million (ppm) of gluten [92] [93]. This international threshold serves as the definitive benchmark for safety and compliance, demanding analytical methods that are both highly sensitive and specific.
Gold nanoparticle-based lateral flow immunoassays (LFIAs) have emerged as a powerful technology for rapid, on-site detection of wheat allergens, primarily targeting gliadin, the principal glycoprotein component of gluten that triggers adverse immune responses [2] [67]. These assays must be rigorously validated against international standards to ensure their utility in research, food manufacturing, and regulatory oversight. This application note provides detailed protocols for developing, optimizing, and benchmarking LFIA methods against the Codex 20 ppm gluten-free threshold, providing researchers with a framework for robust method validation.
International Gluten Standards and Analytical Targets
The Codex 20 ppm Threshold: Basis and Significance
The 20 ppm threshold was established as the lowest level that can be consistently detected and quantified using validated analytical methods, and it is a level that most individuals with celiac disease can tolerate without adverse health effects [92]. This standard is recognized globally, though it is subject to ongoing re-evaluation as detection technologies and clinical understanding advance [93]. The FDA's regulation mandates that any food bearing a "gluten-free," "no gluten," "free of gluten," or "without gluten" claim must meet the following criteria [92]:
- Contain less than 20 ppm gluten.
- Not contain any ingredient that is a gluten-containing grain (wheat, rye, barley, or crossbred hybrids).
- Not contain an ingredient derived from a gluten-containing grain that has not been processed to remove gluten.
The Primary Analytical Target: Gliadin
Gliadin, a component of wheat gluten, is the primary target for immunoassays due to its role as a major allergen and its presence in proportion to total gluten content [2] [67]. Its hydrophobic nature and low solubility present specific challenges for extraction and detection, which must be addressed in method development [67].
Table 1: International Gluten Labeling Standards and Key Provisions
| Regulatory Body/Standard | Gluten-Free Threshold | Key Provisions and Scope |
|---|---|---|
| Codex Alimentarius | 20 ppm | Global standard; basis for many national regulations [93]. |
| U.S. FDA | 20 ppm | Applies to all FDA-regulated foods, dietary supplements, fruits, vegetables, eggs, and fish; voluntary claim [92]. |
| USDA | Varies | Regulates meat, poultry, and certain egg products [92]. |
| TTB (U.S. Treasury) | Varies | Regulates most alcoholic beverages [92]. |
LFIA Development: Reagents, Materials, and Experimental Protocol
Research Reagent Solutions and Essential Materials
The following table details the core materials required for developing a gold nanoparticle-based LFIA for gliadin detection.
Table 2: Essential Research Reagents and Materials for Gold Nanoparticle-Based Gliadin LFIA
| Item | Function/Description | Critical Specifications & Examples |
|---|---|---|
| Anti-Gliadin Monoclonal Antibodies (mAbs) | Highly specific biorecognition elements for gliadin. | Must form a high-affinity pair for sandwich ELISA (e.g., mAb 7 as capture, mAb 6 as detection) [2]. |
| Gold Nanoparticles (AuNPs) | Signal reporters or labels. | 40 nm spherical AuNPs are common; surface functionalized for antibody conjugation [94]. |
| Lateral Flow Strip Components | Platform for the immunoassay. | Includes sample pad, conjugate pad, nitrocellulose membrane (test/control lines), absorbent pad [94]. |
| Gliadin Standard | Positive control and for calibration curve generation. | Purified gliadin for spiking experiments and determining assay sensitivity (LOD) and recovery [2]. |
| Blocking Buffers | Reduce non-specific binding. | Solutions containing proteins (e.g., BSA, gelatin) or surfactants to block unused sites on the membrane and AuNPs. |
| Conjugation Buffer | Medium for antibody-AuNP conjugation. | pH is critical for stability; optimal conjugation reported at pH 3, 5, and 7 [67]. |
Detailed Experimental Protocol for LFIA Construction and Validation
Production of Monoclonal Antibodies (mAbs) against Gliadin
- Immunization: Immunize mice with purified gliadin antigen emulsified in Freund's adjuvant (complete for primary, incomplete for boosters) [2].
- Cell Fusion & Screening: Fuse spleen cells from immunized mice with myeloma cells to generate hybridomas. Screen the resulting hybridoma supernatants for anti-gliadin antibody production using ELISA.
- Antibody Pairing: Identify high-affinity, non-competing antibody pairs suitable for a sandwich assay format. One study identified mAb 7 as the optimal capture antibody and HRP-labeled mAb 6 as the optimal detection antibody based on the highest P/N (Positive/Negative) value and lowest background signal [2].
- Antibody Purification: Purify selected monoclonal antibodies using a method such as saturated ammonium sulfate precipitation or affinity chromatography [2].
Synthesis and Characterization of Gold Nanoparticle-Antibody Conjugates
- AuNP Synthesis: Synthesize gold nanoparticles (~11-40 nm diameter) by reducing tetrachloroauric acid (HAuCl4) with citrate, resulting in a ruby red solution [67].
- Conjugation Optimization:
- Determine the optimal pH for conjugation. Studies indicate stable conjugation at pH 3, 5, and 7, with aggregation occurring at higher pH levels [67].
- Determine the minimal amount of antibody required to stabilize the AuNPs against salt-induced aggregation.
- Conjugate Characterization: Confirm successful conjugation using:
- UV-Vis Spectrophotometry: A redshift in the absorbance peak (e.g., from 520 nm to 523 nm) indicates successful antibody attachment [67].
- Dynamic Light Scattering (DLS) and Zeta Potential: To measure changes in hydrodynamic size and surface charge.
- X-ray Photoelectron Spectroscopy (XPS): Can detect the presence of nitrogen and carbon bonds characteristic of antibody proteins on the AuNP surface [67].
LFIA Strip Assembly and Test Line Configuration
- Strip Assembly: Overlap the sample pad, conjugate pad (containing the dried AuNP-mAb conjugate), nitrocellulose membrane, and absorbent pad on a backing card [94].
- Test and Control Line Coating:
- Sandwich Format Test Line (L Line): Dispense the capture anti-gliadin antibody (e.g., mouse anti-gliadin mAb 7) onto the nitrocellulose membrane to form the test line. This line will darken with increasing gliadin concentration [67].
- Competitive Format Test Line (E Line): Dispense purified gliadin directly onto the membrane. This line's signal decreases as gliadin concentration in the sample increases, acting as a competitive check [67].
- Control Line (O Line): Dispense an anti-species antibody (e.g., rabbit anti-mouse IgG) to capture the AuNP-mAb conjugate and validate assay functionality [67].
The following diagram illustrates the principle of a combined competitive and sandwich assay, a design used to enhance accuracy and detect high-concentration hook effects.
Sample Preparation and Extraction
- Extraction Solvent: Use a specialized extraction solution, such as an ionic liquid-based buffer, to efficiently solubilize hydrophobic gliadin proteins from solid food samples. This step is critical for achieving high detection sensitivity and can reduce total extraction and testing time to under 3 minutes [67].
- Extraction Protocol: Homogenize the food sample with the extraction buffer, then incubate with constant agitation. Centrifuge or filter to remove particulate matter before applying the supernatant to the LFIA strip.
Benchmarking and Validation Against the 20 ppm Standard
Establishing Analytical Figures of Merit
To validate that an LFIA meets the 20 ppm regulatory threshold, the following performance characteristics must be determined:
- Limit of Detection (LOD): The lowest concentration of gliadin that can be reliably distinguished from a blank. The LOD should be significantly below 20 ppm. For example, reported LODs for gliadin in milk are 60 ng/mL for ELISA and 6.56 ng/mL for LFIA [2]. The LEO system reports sensitivity below the FDA's 20 ppm threshold [67].
- Limit of Quantification (LOQ): The lowest concentration that can be quantified with acceptable precision and accuracy.
- Recovery: Assessed by spiking a known amount of gliadin into a gluten-free matrix and measuring the concentration detected. Recovery rates should be close to 100%. One study reported average recoveries of 99.16%–100.07% using a sandwich ELISA [2].
- Specificity/Cross-Reactivity: The assay should show minimal cross-reactivity with other common allergens or grain proteins (e.g., zein from corn) [2].
Advanced LFIA Systems: The LEO Code Quantifying Assay
Advanced systems like the LEO (Lateral flow Enhanced by Optical imaging) integrate a dual-format test line (competitive and sandwich) on a single strip to improve accuracy and detect the "hook effect" (a false negative at very high analyte concentrations) [67]. The system uses smartphone-based image analysis for quantification.
Table 3: Performance Benchmarking of Gliadin Detection Methods
| Method | Reported Sensitivity (LOD) | Key Advantages | Validation against 20 ppm |
|---|---|---|---|
| Sandwich ELISA | 60 ng/mL (in milk) [2] | High specificity, good quantitative reproducibility [2]. | Well-established reference method; recovery rates validate accuracy [2]. |
| Standard Gold LFIA | 6.56 ng/mL (in milk) [2] | Rapid, low-cost, simple operation, suitable for on-site use [2]. | LOD is well below 20 ppm, but must be validated in complex food matrices. |
| LEO LFIA System | < 20 ppm (in food) [67] | Dual-format lines prevent hook effect, smartphone quantification, ~3 min assay time [67]. | Designed specifically to detect below and above the 20 ppm threshold with >98% accuracy [67]. |
The following workflow diagram outlines the key stages for developing and validating an LFIA against international standards.
Gold nanoparticle-based lateral flow immunoassays represent a rapidly advancing field that bridges the need for rigorous, standards-compliant detection and practical, on-site analysis. By adhering to the detailed protocols for reagent preparation, strip configuration, and validation benchmarking outlined in this document, researchers can develop robust LFIA systems capable of reliably enforcing the Codex 20 ppm gluten-free threshold. The integration of innovative designs, such as dual-format test lines and smartphone-based readout, further enhances the utility of these assays, empowering both industry and regulatory bodies to ensure a safer food supply for individuals with celiac disease and gluten sensitivity.
Conclusion
The gold nanoparticle-based lateral flow immunoassay stands as a powerful, rapid, and cost-effective tool for the on-site detection of wheat allergens, perfectly aligning with the growing need for accessible food safety diagnostics. This synthesis of foundational knowledge, methodological detail, optimization strategies, and validation data confirms that a well-developed LFIA can achieve high sensitivity and specificity, with detection limits meeting international regulatory standards. Future directions point toward the integration of novel nanomaterials for multimodal detection, the application of computational tools like molecular dynamics for rational bioreceptor design, and the development of multiplexed platforms for simultaneous detection of multiple food allergens. These advancements will further solidify the role of LFIA in protecting public health and empowering both consumers and the food industry.
References
- 1. Celiac Disease and Gluten Free in the News Nov 2025 [https://nationalceliac.org/news/celiac-disease-and-gluten-free-in-the-news-nov-2025/?srsltid=AfmBOorzNkVThpZ9XaNKeWVBFqTHGWoYGjbVzc4iH_oA_-4Z0aQJp7Du]
- 2. Gold nanoparticle-based lateral flow immunoassay for the ... [https://www.sciencedirect.com/science/article/abs/pii/S2212429223000044]
- 3. Gold-based nanoplatform for a rapid lateral flow ... [https://pmc.ncbi.nlm.nih.gov/articles/PMC9121606/]
- 4. Molecular Diagnosis to IgE-mediated Wheat Allergy and ... [https://pmc.ncbi.nlm.nih.gov/articles/PMC12052925/]
- 5. Proteomic Profiling and Epitope Analysis of the Complex α- ... [https://www.frontiersin.org/journals/plant-science/articles/10.3389/fpls.2018.00818/full]
- 6. Lateral flow assays - PMC [https://pmc.ncbi.nlm.nih.gov/articles/PMC4986465/]
- 7. Lateral flow test engineering and lessons learned from ... [https://www.nature.com/articles/s44222-022-00007-3]
- 8. Lateral Flow Immunoassays [https://www.rapidmicrobiology.com/test-method/lateral-flow-immunoassays]
- 9. Lateral Flow Immunoassay Basics [https://www.jacksonimmuno.com/technical/products/applications/elisa/lateral-flow/immunoassays-introduction]
- 10. Lateral flow test [https://en.wikipedia.org/wiki/Lateral_flow_test]
- 11. Two-Color Lateral Flow Assay for Multiplex Detection ... [https://pmc.ncbi.nlm.nih.gov/articles/PMC5396465/]
- 12. An Optimized Colorimetric Readout Method for Lateral ... [https://www.mdpi.com/1424-8220/18/12/4084]
- 13. Beyond Spheres: Evaluating Gold Nano-Flowers and ... [https://pmc.ncbi.nlm.nih.gov/articles/PMC12384835/]
- 14. Advantages of Highly Spherical Gold Nanoparticles as ... [https://www.mdpi.com/1424-8220/20/12/3608]
- 15. Lateral flow immunoassay using plasmonic scattering [https://www.nature.com/articles/s41467-025-58663-z]
- 16. Emerging strategies for the formulation of antibody– ... [https://www.sciencedirect.com/science/article/pii/S1359029425000743]
- 17. Hierarchical Nanogold Labels to Improve the Sensitivity of ... [https://link.springer.com/article/10.1007/s40820-017-0180-2]
- 18. A rapid and sensitive lateral flow immunoassay (LFIA) for ... [https://pubmed.ncbi.nlm.nih.gov/33774225/]
- 19. Comparative Study of Four Coloured Nanoparticle Labels ... [https://pmc.ncbi.nlm.nih.gov/articles/PMC8708713/]
- 20. Gold nanoparticle-based lateral flow immunoassay for the ... [https://www.sciencedirect.com/science/article/pii/S2212429223000044]
- 21. A comprehensive review of competitive lateral flow assays ... [https://pubs.rsc.org/en/content/articlehtml/2025/lc/d4lc01075b]
- 22. Sandwich ELISA protocol [https://www.abcam.com/en-us/technical-resources/protocols/sandwich-elisa]
- 23. Construction of sandwich ELISA method for quantitative ... [https://www.sciencedirect.com/science/article/abs/pii/S0956713523002001]
- 24. 40nm Gold Nanoparticles: Properties, Uses & Research ... [https://www.torskal.com/practical-guide-to-40nm-gold-nanoparticles-what-researchers-and-developers-need-to-know-2025-2026/?srsltid=AfmBOoqw7cY1-j6SAtlZmz5H4oHX0Rud3uw2NSuha828gf3VxXDWcynt]
- 25. Autonomous phase mapping of gold nanoparticles ... [https://www.nature.com/articles/s41524-025-01822-z]
- 26. New Standard Supports Gold Nanoparticle Characterization [https://www.astm.org/news/press-releases/new-standard-supports-gold-nanoparticle-characterization]
- 27. Characterizations of a neutralizing antibody broadly reactive ... [https://pmc.ncbi.nlm.nih.gov/articles/PMC10746718/]
- 28. Monitoring of gluten-free diet compliance in celiac patients ... [https://www.sciencedirect.com/science/article/pii/S0002916523027077]
- 29. Gluten Free Test, Rapid Food Allergen Lateral Flow Test [https://hardydiagnostics.com/e1910]
- 30. Robust Rules for Optimal Colorimetric Sensing Based on Gold ... [https://pmc.ncbi.nlm.nih.gov/articles/PMC10152487/]
- 31. Lateral Flow Immunoassay Reader Technologies for ... [https://pmc.ncbi.nlm.nih.gov/articles/PMC9571991/]
- 32. AgraStrip ® LL Bulk Grain - TraitChek [https://www.romerlabs.com/en/shop/agrastrip-r-ll-bulk-grain-traitchek/]
- 33. Rapid Gluten Allergen Detection Using an Integrated ... [https://pmc.ncbi.nlm.nih.gov/articles/PMC11656241/]
- 34. Gold-based nanoplatform for a rapid lateral flow ... [https://bmcbiomedeng.biomedcentral.com/articles/10.1186/s42490-022-00062-2]
- 35. Electrical Characterization of Cellulose-Based Membranes ... [https://pmc.ncbi.nlm.nih.gov/articles/PMC7927109/]
- 36. Unisart® 0.45 µm Nitrocellulose Membrane [https://shop.sartorius.com/us/p/unisart-nitrocellulose-blotting-membrane-045-m-pore-size-1-roll-per-pack/Nitrocellulose-Membrane-0.45-Micro-Meter]
- 37. Controlling Capillary Flow Rate on Lateral Flow Test ... [https://pmc.ncbi.nlm.nih.gov/articles/PMC8156355/]
- 38. Capillary flow control in lateral flow assays via ... [https://pmc.ncbi.nlm.nih.gov/articles/PMC10938491/]
- 39. Gold nanoparticle conjugate‐based lateral flow immunoassay ... [https://pmc.ncbi.nlm.nih.gov/articles/PMC9877930/]
- 40. Lateral Flow Immunoassay Protocol [https://www.creative-diagnostics.com/lateral-flow-immunoassay-protocol.htm]
- 41. Towards Lateral Flow Quantitative Assays: Detection ... [https://pmc.ncbi.nlm.nih.gov/articles/PMC6784366/]
- 42. Development a stacking pad design for enhancing the ... [https://www.nature.com/articles/s41598-018-35694-9]
- 43. Reveal® 3-D for Gluten | Food Allergy Testing Kit [https://www.neogen.com/en/categories/allergens/reveal-3d-gluten/]
- 44. Modern Sample Preparation Methods for Food and ... [https://www.chromatographyonline.com/view/modern-sample-preparation-methods-food-and-environmental-laboratories]
- 45. Determining Matrix Effects in Complex Food Samples [https://www.waters.com/blog/understanding-sample-complexity-determining-matrix-effects-in-complex-food-samples/?srsltid=AfmBOopjEBwRnm-Vpn1XmAgnAXsDzpy2xgHrMpF1fpA7Dxdq5wVGHSpb]
- 46. Development of a novel quantitative lateral flow assay for ... [https://www.nature.com/articles/s41598-025-09145-1]
- 47. A Quantitative Detection Algorithm for Multi-Test Line ... [https://www.mdpi.com/1424-8220/23/14/6401]
- 48. BioReady 40 nm Bare Gold - Passive Conjugation Protocol [https://www.fortislife.com/protocols/nanomaterial-protocols/bioready-40-nm-bare-gold-passive-conjugation-protocol]
- 49. Latest Trends in Lateral Flow Immunoassay (LFIA) ... [https://www.frontiersin.org/journals/bioengineering-and-biotechnology/articles/10.3389/fbioe.2022.922772/full]
- 50. Antibody Conjugation Protocols: A Complete Step-by- ... [https://www.bocsci.com/research-area/a-step-by-step-guide-to-antibody-conjugation-protocols.html?srsltid=AfmBOorpK_-fsh6PRnREtCpr3IK9iFzRp5yxEUOIIAdRDQUivQBQdlgy]
- 51. Development of Lateral Flow Assay for Zearalenone [https://www.mdpi.com/2305-7084/9/3/54]
- 52. Development of a Multiplex Lateral Flow Immunoassay for ... [https://pmc.ncbi.nlm.nih.gov/articles/PMC12467014/]
- 53. Optimizing blocking of nonspecific bacterial attachment to ... [https://www.sciencedirect.com/science/article/pii/S2214180416300356]
- 54. Preparation of Nanoparticle-Immobilized Gold Surfaces for ... [https://pmc.ncbi.nlm.nih.gov/articles/PMC12191028/]
- 55. The importance of antibody orientation for enhancing ... [https://pubs.rsc.org/en/content/articlehtml/2024/sd/d4sd00206g]
- 56. Simultaneously targeting nitrocellulose and antibody by a ... [https://pubmed.ncbi.nlm.nih.gov/32971296/]
- 57. A colorimetric lateral flow immunoassay based on oriented ... [https://pmc.ncbi.nlm.nih.gov/articles/PMC9791791/]
- 58. Improvement in sensitivity for lateral flow immunoassay of ... [https://www.nature.com/articles/s41598-022-11732-5]
- 59. Tools to compare antibody gold nanoparticle conjugates ... [https://pmc.ncbi.nlm.nih.gov/articles/PMC9859872/]
- 60. Capture-Layer Lateral Flow Immunoassay - PubMed Central [https://pmc.ncbi.nlm.nih.gov/articles/PMC7226885/]
- 61. Thermometric lateral flow immunoassay with colored latex ... [https://www.nature.com/articles/s41598-022-07963-1]
- 62. Sensitive biomolecule detection in lateral flow assay with a ... [https://www.sciencedirect.com/science/article/abs/pii/S0956566315306588]
- 63. 7 Strategies for Lateral Flow Assays for Low-Resource ... [https://dcndx.com/insights/designing-lateral-flow-assays-for-low-resource/]
- 64. Lateral flow (immuno)assay: its strengths, weaknesses ... [https://link.springer.com/article/10.1007/s00216-008-2287-2]
- 65. Evaluation of Molecular Simulations and Deep Learning ... [https://pmc.ncbi.nlm.nih.gov/articles/PMC10525649/]
- 66. Enhancing antibody-antigen interaction prediction with atomic ... [https://pmc.ncbi.nlm.nih.gov/articles/PMC12530544/]
- 67. A Visible-Code Semiquantitative Lateral Flow System for ... [https://pmc.ncbi.nlm.nih.gov/articles/PMC12464975/]
- 68. Simulation-Based Analysis of Antibody-Antigen Interaction [https://www.eisai.com/innovation/research/digital/antibody-antigen_interaction/index.html]
- 69. Enhancing antibody-antigen interaction prediction with atomic ... [https://journals.plos.org/ploscompbiol/article?id=10.1371/journal.pcbi.1013576]
- 70. Determining LOD and LOQ Based on the Calibration Curve [https://www.sepscience.com/hplc-solutions-126-chromatographic-measurements-part-5-determining-lod-and-loq-based-on-the-calibration-curve-6959]
- 71. A Critical Comparison between Flow-through and Lateral ... [https://www.mdpi.com/2079-6374/9/4/143]
- 72. Lateral Flow Microimmunoassay (LFµIA) for the Reliable ... [https://pmc.ncbi.nlm.nih.gov/articles/PMC9688043/]
- 73. Comparison of approaches for assessing detection and ... [https://www.nature.com/articles/s41598-024-83474-5]
- 74. Development and Validation of a Lateral Flow ... [https://www.sciencedirect.com/science/article/pii/S0362028X22106101]
- 75. The Dual Face of Wheat and Cereal Reactivity [https://pubmed.ncbi.nlm.nih.gov/40960211/]
- 76. Wheat Allergy Facts, Symptoms, and Treatment [https://www.thermofisher.com/allergy/us/en/allergen-fact-sheets/wheat.html]
- 77. A comprehensive review on allergy mechanisms and ... [https://www.sciencedirect.com/science/article/pii/S2590157525007187]
- 78. Recent Advancements in Lateral Flow Assays for Food ... [https://pmc.ncbi.nlm.nih.gov/articles/PMC12298994/]
- 79. Research progress on detection methods for food allergens [https://www.sciencedirect.com/science/article/abs/pii/S0889157524009402]
- 80. Comparative analysis of LC-MS/MS and real-time PCR ... [https://www.sciencedirect.com/science/article/abs/pii/S0308814624004102]
- 81. Development of PCR Methods for Detecting Wheat and ... [https://www.mdpi.com/2673-6284/14/4/78]
- 82. Innovations shaping the future of food allergen testing [https://allergenbureau.net/innovations-shaping-the-future-of-food-allergen-testing/]
- 83. Lateral flow assay sensitivity and signal enhancement via ... [https://www.nature.com/articles/s41598-024-74407-3]
- 84. Lateral flow immunochromatographic assay for rapid ... [https://pubmed.ncbi.nlm.nih.gov/40538549/]
- 85. Lateral flow immunoassay and enzyme linked ... [https://pmc.ncbi.nlm.nih.gov/articles/PMC5738196/]
- 86. Multi-laboratory validation of the xMAP—Food Allergen ... [https://pmc.ncbi.nlm.nih.gov/articles/PMC7347184/]
- 87. A Fast and Sensitive Quantitative Lateral Flow ... [https://www.mdpi.com/1424-8220/12/9/11684]
- 88. Aptamer-Functionalized Gold Nanoparticle Assay for Rapid ... [https://pmc.ncbi.nlm.nih.gov/articles/PMC12190990/]
- 89. Process optimization for gold nanoparticles biosynthesis by ... [https://www.nature.com/articles/s41598-024-54698-2]
- 90. A two-colour multiplexed lateral flow immunoassay system ... [https://pmc.ncbi.nlm.nih.gov/articles/PMC6749696/]
- 91. Rainbow-inspired multicolor lateral flow immunoassay ... [https://www.sciencedirect.com/science/article/abs/pii/S1385894724065756]
- 92. Gluten and Food Labeling [https://www.fda.gov/food/nutrition-education-resources-materials/gluten-and-food-labeling]
- 93. Celiac Disease Foundation Champions Change through ... [https://celiac.org/2025/03/05/celiac-disease-foundation-champions-change-through-global-collaboration-on-food-policy/]
- 94. Introduction to Lateral Flow Rapid Test Diagnostics [https://nanocomposix.com/pages/introduction-to-lateral-flow-assays]