Developing Predictive Bioavailability Equations: A Framework Integrating Machine Learning and Clinical Translation
This article provides a comprehensive overview of modern approaches for developing predictive equations to estimate nutrient and drug bioavailability.
Developing Predictive Bioavailability Equations: A Framework Integrating Machine Learning and Clinical Translation
Abstract
This article provides a comprehensive overview of modern approaches for developing predictive equations to estimate nutrient and drug bioavailability. Aimed at researchers, scientists, and drug development professionals, it synthesizes current frameworks, machine learning methodologies, optimization techniques, and validation strategies. Covering foundational concepts to advanced applications, the content explores the transition from traditional regression to AI-driven models like LSTM networks and Gaussian Process Regression. It addresses critical challenges in model development, including data limitations and parameter optimization, while highlighting the significant potential of these predictive tools to enhance food formulation, drug design, nutritional recommendations, and personalized medicine.
Understanding Bioavailability Prediction: Core Concepts and Current Frameworks
Bioavailability is a critical pharmacokinetic parameter that measures the proportion of a substance that reaches systemic circulation in an active form to exert its biological effect. The definition varies slightly between fields but maintains the same fundamental principle.
In pharmacology, bioavailability is defined as the fraction of an administered drug that reaches the systemic circulation unaltered [1]. It is denoted by the letter F and expressed as a percentage, with intravenous administration providing 100% bioavailability by definition [2]. In nutritional science, bioavailability generally designates the quantity or fraction of an ingested nutrient that is absorbed and available for use or storage by the body [2]. This definition accounts for the additional complexity of nutritional status and physiological state on nutrient utilization.
A crucial distinction exists between bioavailability and absorption. Absorption refers specifically to the process of a substance moving from its site of administration into the bloodstream [3]. Bioavailability encompasses absorption but also includes subsequent processes that affect systemic availability, such as first-pass metabolism, binding to proteins, or excretion [3]. Therefore, while absorption is a prerequisite for bioavailability, it does not guarantee that the substance will reach systemic circulation in an active form.
Quantitative Foundations and Calculations
The gold standard for determining bioavailability involves calculating the Area Under the Curve (AUC) of drug concentration versus time, which represents total drug exposure in systemic circulation [1] [2].
Table 1: Key Bioavailability Equations and Calculations
| Bioavailability Type | Formula | Variables | Application |
|---|---|---|---|
| Absolute Bioavailability (Fabs) | F_abs = 100 * (AUC_po * D_iv) / (AUC_iv * D_po) |
AUC_po = AUC after oral doseD_iv = Intravenous doseAUC_iv = AUC after IV doseD_po = Oral dose |
Compares systemic exposure from a non-IV route (e.g., oral) to IV administration [2]. |
| Relative Bioavailability (Frel) | F_rel = 100 * (AUC_A * D_B) / (AUC_B * D_A) |
AUC_A = AUC for formulation AD_B = Dose for formulation BAUC_B = AUC for formulation BD_A = Dose for formulation A |
Compares bioavailability between two different formulations (e.g., generic vs. brand-name) [2]. |
| Fraction Absorbed (Basic) | F = Mass of drug delivered to plasma / Total mass of drug administered |
F = Bioavailability fraction |
A fundamental definition of the proportion of the administered dose that reaches the systemic circulation [1]. |
For regulatory approval of generic drugs, bioequivalence (BE) must be demonstrated by showing the 90% confidence interval for the ratio of the mean AUC and maximum concentration (Cmax) of the test product to the reference product falls within 80% to 125% [2].
Framework for Developing Predictive Bioavailability Equations
Weaver et al. (2025) propose a structured 4-step framework designed to guide researchers in developing predictive equations for nutrient absorption and bioavailability, which is also highly applicable to pharmaceutical research [4].
Diagram 1: Framework for Predictive Equation Development
This framework emphasizes a systematic approach to address data limitations, highlight evidence gaps, and enhance the accuracy of bioavailability estimates for both nutrients and drugs [4].
Key Factors Influencing Bioavailability
Multiple intrinsic and extrinsic factors significantly impact the rate and extent of bioavailability, which must be considered in predictive modeling and experimental design.
Table 2: Key Factors Influencing Bioavailability
| Category | Specific Factors | Impact on Bioavailability |
|---|---|---|
| Physiological Barriers | Intestinal epithelium absorption, First-pass metabolism, Gastric emptying rate, GI tract health | Reduces bioavailability for non-IV routes; subject to inter- and intra-individual variation [1] [2]. |
| Drug/Compound Properties | Hydrophobicity, pKa, solubility, particle size, chemical stability | Affects dissolution, permeability, and susceptibility to degradation [2]. |
| Formulation Factors | Dosage form (tablet, capsule, liquid), excipients, modified release (extended, delayed), manufacturing methods | Can enhance or hinder drug release and absorption; critical for generic vs. brand-name bioequivalence [5] [2]. |
| Metabolic Factors | Hepatic cytochrome P450 enzymes, enzyme induction/inhibition, genetic polymorphisms, transport proteins (e.g., P-glycoprotein) | Can inactivate a compound before it reaches systemic circulation; subject to drug-drug and drug-food interactions [1]. |
| Patient-Specific Factors | Age, gender, phenotypic differences, genetic makeup, disease states (hepatic/renal insufficiency), diet/fasting state | Causes significant inter-individual variability in drug response and bioavailability [1] [2]. |
| Concurrent Interactions | Food (e.g., grapefruit juice, high-fat meals), other drugs, herbal supplements (e.g., St. John's wort), alcohol, nicotine | Can inhibit or induce metabolic enzymes or transporters, altering bioavailability and risk of toxicity [1] [2]. |
Experimental Protocols for Assessing Bioavailability
In Vivo Pharmacokinetic Study Protocol
This protocol outlines the standard method for determining absolute bioavailability in humans or animal models.
- Objective: To determine the absolute bioavailability (Fabs) of a test formulation by comparing its systemic exposure to that of an intravenous reference.
- Materials:
- Test formulation (e.g., oral tablet, capsule)
- Reference intravenous (IV) formulation
- Validated analytical method (e.g., LC-MS/MS)
- Cannulation equipment for serial blood sampling
- Centrifuge and freezer (-80°C) for plasma storage
- Procedure:
- Study Design: A randomized, crossover study design is preferred, with a sufficient washout period between administrations.
- Dosing: Administer the test and reference formulations to subjects at therapeutic doses. The IV dose may be lower but must be dose-normalized in the calculation.
- Blood Sampling: Collect serial blood samples at pre-dose and at appropriate time points post-dose (e.g., 0.25, 0.5, 1, 2, 4, 8, 12, 24 hours) to fully characterize the concentration-time profile.
- Sample Processing: Centrifuge blood samples to obtain plasma and store frozen until analysis.
- Bioanalysis: Analyze plasma samples using a validated specific and sensitive analytical method to determine drug concentrations.
- Data Analysis: Calculate AUC0-t and AUC0-∞ for both the test and reference formulations. Apply Equation 1 (from Table 1) to calculate absolute bioavailability.
Combined In Vitro Dissolution/Permeability Protocol
This protocol, adapted from Sironi et al. (2021), combines two in vitro assays to predict in vivo performance and explain bioequivalence failures [5].
- Objective: To simultaneously evaluate the drug release and intestinal permeability of a formulation, providing insights into its absorption potential.
- Materials:
- USP apparatus for dissolution testing (e.g., Paddle apparatus)
- Parallel Artificial Membrane Permeability Assay (PAMPA) plates
- Dissolution medium (e.g., simulated gastric/intestinal fluid)
- Phospholipid solution for creating artificial membrane
- UV-Visible spectrophotometer or HPLC system for quantification
- Procedure:
- Dissolution Test: Place the test tablet in the dissolution vessel containing a suitable volume of medium, maintained at 37°C. Operate the apparatus as per pharmacopeial standards (e.g., 50-75 rpm paddle speed).
- Sample Withdrawal: At predetermined time intervals, withdraw aliquots from the dissolution vessel.
- PAMPA Assay: Immediately transfer the aliquots to the donor compartment of the PAMPA plate. The receiver compartment contains a suitable buffer. The plate has an artificial lipid membrane separating the compartments.
- Incubation: Incubate the PAMPA plate for a set period (e.g., several hours) to allow for passive diffusion.
- Analysis: Quantify the drug concentration in both the donor and receiver compartments after the incubation period.
- Data Analysis:
- Dissolution Profile: Plot % drug released vs. time.
- Apparent Permeability (Pe): Calculate using the formula:
P_e = -ln(1 - C_receiver / C_equilibrium) / (A * (1/V_donor + 1/V_receiver) * t), where A is the membrane area, V is volume, and t is time.
Diagram 2: Combined Dissolution/Permeability Workflow
The Scientist's Toolkit: Essential Reagents and Materials
Table 3: Key Research Reagent Solutions for Bioavailability Studies
| Reagent / Material | Function and Application | Key Considerations |
|---|---|---|
| Caco-2 Cell Line | A human colon adenocarcinoma cell line that differentiates into enterocyte-like cells. Used in in vitro models to study active and passive intestinal drug transport and metabolism [5]. | Long cultivation time (~21 days), expresses transporters and metabolic enzymes, more biologically relevant but higher variability [5]. |
| PAMPA Plates | Parallel Artificial Membrane Permeability Assay. Uses an artificial phospholipid membrane in a multi-well plate to assess passive transcellular permeability [5]. | High-throughput, low cost, reproducible, ideal for early-stage screening of passive permeability [5]. |
| Simulated Gastrointestinal Fluids | Biorelevant dissolution media (e.g., FaSSGF, FaSSIF) that mimic the pH, surface tension, and composition of human gastric and intestinal fluids for in vitro dissolution testing [5]. | Crucial for predicting in vivo dissolution, especially for poorly soluble drugs whose absorption is dissolution-rate limited [5]. |
| Stable Isotope Labels (e.g., ¹³C, ¹⁴C) | Used in absolute bioavailability studies. A low dose of an isotopically labelled IV dose is co-administered with a therapeutic oral dose, allowing simultaneous measurement of both PK profiles [2]. | Avoids the need for separate IV and oral studies and associated toxicity testing. ¹⁴C requires sensitive AMS (Accelerator Mass Spectrometry) for detection [2]. |
| Cytochrome P450 Isozyme Assays | Recombinant enzymes or human liver microsomes used to identify specific metabolic pathways, potential drug-drug interactions, and inhibitory/inductive effects of a new compound. | Critical for understanding first-pass metabolism and anticipating inter-individual variability due to genetic polymorphisms (e.g., CYP2D6, CYP2C19) [1]. |
| Liposomal Encapsulation Systems | A formulation technology where the active compound is enclosed within a phospholipid bilayer. Used to enhance the solubility, stability, and bioavailability of poorly absorbed drugs and nutrients [3]. | Protects the compound from degradation in the GI tract and can facilitate improved absorption through various mechanisms. |
The Critical Need for Predictive Equations in Nutrition and Pharmacology
Accurate prediction of bioavailability—the fraction of a substance that reaches systemic circulation and is available for biological activity—represents a critical frontier in both nutrition and pharmacology. Current nutrient intake recommendations and drug dosage determinations often rely on total content rather than bioavailable content, creating significant uncertainty in efficacy assessments. *Bioavailability prediction equations are essential computational tools that translate ingested amounts into biologically active doses, enabling more precise dietary planning and drug dosing. The development of these equations follows a structured scientific framework designed to identify key influencing factors, integrate high-quality human study data, construct mathematical models, and validate predictions against gold-standard measurements. This approach addresses fundamental limitations in both fields, where direct measurement of bioavailability in human subjects is often costly, ethically challenging, and impractical for routine application.
The consequences of inaccurate bioavailability estimates are substantial across these domains. In nutrition, overestimating bioavailability can lead to persistent nutrient deficiencies despite apparently adequate intake, while underestimation may drive unnecessary supplementation or food fortification. In pharmacology, inaccurate predictions directly impact therapeutic efficacy and safety, potentially resulting in treatment failure or adverse drug reactions. A unified framework for developing predictive equations across these disciplines enables more efficient resource allocation in research and product development while improving outcomes for end users. This document presents specialized protocols and application notes for researchers developing and applying these vital predictive tools.
Foundational Framework for Predictive Equation Development
Standardized Four-Step Development Methodology
A robust, structured framework guides the development of predictive bioavailability equations, ensuring scientific rigor and translational applicability [6] [4] [7]. This methodology provides a standardized approach applicable to both nutrient and drug bioavailability assessment.
Step 1: Identify Key Influencing Factors - Systematically identify intrinsic and extrinsic factors affecting bioavailability. For nutrients, this includes food matrix effects, chemical speciation, and nutrient-nutrient interactions. For drugs, this encompasses physicochemical properties, formulation characteristics, and administration routes. This step requires comprehensive analysis of compound-specific absorption, distribution, metabolism, and excretion (ADME) pathways.
Step 2: Conduct Comprehensive Literature Review - Perform systematic review of high-quality human studies investigating bioavailability. Prioritize research employing validated methods such as stable isotopes for nutrients or pharmacokinetic studies for drugs. Extract quantitative data on absorption parameters, variability measures, and covariate influences to inform equation structure and parameterization.
Step 3: Construct Predictive Equations - Develop mathematical models based on mechanistic understanding and empirical relationships identified in Step 2. Select appropriate statistical approaches (multiple linear regression, nonlinear mixed-effects modeling, machine learning) based on data structure and research question. Define equation parameters with measurable inputs for practical application.
Step 4: Validate and Translate Equations - Assess predictive performance against internal and external datasets. When feasible, conduct validation studies comparing equation predictions against gold-standard measurements (e.g., doubly labeled water for energy, pharmacokinetic studies for drugs). Establish precision, bias, and limits of agreement to define appropriate use contexts [8].
Table 1: Key Influencing Factors for Bioavailability Prediction
| Category | Nutrient-Specific Factors | Drug-Specific Factors |
|---|---|---|
| Compound Properties | Chemical form (e.g., heme vs. non-heme iron), solubility, stability | Lipophilicity, pKa, molecular size, crystal form |
| Host Factors | Age, health status, genetic polymorphisms in transporters, nutrient status | Genetic polymorphisms in metabolizing enzymes, disease states, age |
| Matrix Effects | Food composition, inhibitory/enhancing components (e.g., phytates, vitamin C) | Formulation excipients, dosage form, release characteristics |
| Luminal Factors | Digestive enzymes, pH conditions, gut microbiota | Gut metabolism, transporter interactions, luminal degradation |
Quantitative Assessment of Predictive Performance
Validated predictive equations demonstrate specific statistical performance characteristics that determine their appropriate application contexts. Comparison of measured versus predicted values employs standardized metrics including *coefficient of determination (R²), *root mean square error (RMSE), *mean bias, and *limits of agreement [9] [8].
Recent research demonstrates the advancement possible with targeted equation development. A new equation for predicting resting energy expenditure in patients with obesity achieved an R² of 0.923 with a root mean square error of 81.872 kcal/day, representing significant improvement over widely used models like Mifflin-St Jeor and Harris-Benedict that show errors exceeding 250-315 kcal/day in this population [9]. Similarly, equations for fat-free mass estimation developed specifically for Brazilian populations with overweight/obesity demonstrated concordance correlation coefficients of 0.982 with standard errors of estimate of 2.50 kg, substantially outperforming generalized equations [10].
Table 2: Performance Metrics for Recent Predictive Equations in Nutrition
| Equation Application | Population | Performance Metrics | Comparison to Standard Equations |
|---|---|---|---|
| Resting Energy Expenditure [9] | Hospitalized patients with obesity (n=89) | R² = 0.923, RMSE = 81.872 kcal/day, Mean bias = -0.054 kcal/day | Narrower limits of agreement (-156.8 to 156.7 kcal/day) vs. conventional equations |
| Fat-Free Mass Estimation [10] | Brazilian adults with overweight/obesity (n=269) | CCC = 0.982, SEE = 2.50 kg, LOA = -5.0 to 4.8 kg | Most existing equations invalid for this specific population |
| Energy Requirements [8] | Older adults (n=41) | RMSE% ≥ 10%, individual prediction accuracy varied (15-35% misclassification) | Both NASEM and Porter equations showed significant individual-level inaccuracies |
Application Note: Nutrient Bioavailability Prediction
Protocol for Nutrient Bioavailability Equation Development
Objective: Develop a predictive equation for iron bioavailability that incorporates key dietary factors influencing absorption.
Background: Iron bioavailability varies dramatically (3-20%) depending on dietary composition, with heme iron from animal sources demonstrating higher bioavailability than non-heme iron from plant sources. Accurate prediction requires accounting for enhancing and inhibiting factors present in the meal matrix.
Experimental Workflow:
Materials and Methods:
Study Population: Recruit healthy adults (n=40-60) with comprehensive exclusion criteria for conditions affecting iron metabolism. Stratify by iron status (ferritin levels) and genotype for relevant iron regulators.
Test Meals: Prepare standardized meals varying systematically in heme/non-heme iron ratio, ascorbic acid content, phytate content, calcium content, and polyphenol content using natural food sources.
Isotope Administration: Administer stable iron isotopes (⁵⁷Fe, ⁵⁸Fe) with test meals in fasted state. Use different isotopes for different meal components when investigating complex interactions.
Sample Collection: Draw blood samples at baseline, 2h, 4h, 6h, and 24h post-ingestion. Process serum and isolate erythrocytes for isotope ratio analysis.
Analytical Methods: Determine isotope ratios in erythrocytes using inductively coupled plasma mass spectrometry (ICP-MS) after 14 days to allow for erythrocyte incorporation.
Data Analysis: Calculate fractional absorption based on isotope incorporation using established models. Employ multiple linear regression with meal composition factors as independent variables and fractional absorption as dependent variable. Validate using leave-one-out cross-validation and external validation in independent cohort.
Key Research Reagents:
Table 3: Essential Research Reagents for Nutrient Bioavailability Studies
| Reagent/Category | Specific Examples | Function in Research Protocol |
|---|---|---|
| Stable Isotope Tracers | ⁵⁷Fe, ⁵⁸Fe, ⁴⁴Ca, ⁶⁷Zn, ²⁶Mg | Metabolic tracing without radioactivity, enabling human studies |
| Reference Standards | Certified IRMM/ NIST standards | Quality control for mass spectrometry analysis |
| Specialized Meals | Controlled composition meals with varying enhancers/inhibitors | Systematic evaluation of dietary factors on bioavailability |
| Sample Collection | EDTA tubes, trace-element-free collection tubes | Prevention of contamination during biological sampling |
| Analytical Instruments | ICP-MS, HPLC-MS | Precise quantification of tracer incorporation and analyte concentrations |
Application Note: Drug Bioavailability Prediction
Protocol for Gut-Liver Microphysiological System for Bioavailability Estimation
Objective: Utilize human-relevant in vitro models to predict human oral drug bioavailability by recreating combined intestinal permeability and first-pass metabolism.
Background: Traditional approaches to predicting human drug bioavailability rely heavily on animal models, which show poor correlation with human outcomes (R² = 0.34 for 184 drugs) due to interspecies differences in enzyme expression and physiology [11]. Microphysiological systems (MPS) incorporating gut and liver tissues offer a human-relevant alternative for more accurate preclinical estimation.
Experimental Workflow:
Materials and Methods:
System Setup: Utilize commercial gut-liver MPS platform (e.g., PhysioMimix) or assemble custom system. Establish human intestinal epithelial cells (primary RepliGut or Caco-2) in gut compartment and primary human hepatocytes or HepaRG cells in liver compartment. Maintain under physiological fluidic perfusion for 7-14 days to promote polarization and functionality.
Functional Validation: Confirm gut barrier integrity via transepithelial electrical resistance (TEER >300 Ω·cm²) and permeability markers. Verify liver metabolic competence through albumin production, urea synthesis, and cytochrome P450 activity (particularly CYP3A4).
Dosing Strategy: For oral route simulation, apply test compound to gut compartment apical side. For intravenous simulation, apply directly to liver compartment. Use physiologically-relevant concentrations based on anticipated human doses.
Sampling Protocol: Collect serial samples from liver compartment effluent at predetermined timepoints (e.g., 0, 0.5, 1, 2, 4, 6, 8, 24 hours). Immediately process samples for storage at -80°C until analysis.
Bioanalytical Methods: Quantify parent drug and major metabolites using validated LC-MS/MS methods. Generate concentration-time curves for both dosing routes.
Data Analysis and Modeling:
- Calculate area under the curve (AUC) for both oral and IV simulations
- Determine key ADME parameters: hepatic clearance (CLint,liver), gut permeability (Papp), efflux ratio
- Apply mechanistic mathematical modeling to estimate:
- Fraction absorbed (Fa)
- Fraction escaping gut metabolism (Fg)
- Fraction escaping hepatic metabolism (Fh)
- Calculate predicted oral bioavailability: F = Fa × Fg × Fh
- Compare predictions with clinical human data when available for validation
Key Research Reagents:
Table 4: Essential Research Reagents for Drug Bioavailability Assessment
| Reagent/Category | Specific Examples | Function in Research Protocol |
|---|---|---|
| Cell Systems | Primary human hepatocytes, RepliGut intestinal cells, Caco-2 cells | Recreate human-relevant absorption and metabolism interfaces |
| Microphysiological Hardware | Gut-liver chips, perfusion controllers, multi-well plates | Provide physiological fluid flow and organ interconnection |
| Bioanalytical Standards | Certified drug standards, stable isotope-labeled internal standards | Enable precise LC-MS/MS quantification |
| Functional Assay Kits | CYP450 activity assays, albumin/urea quantification kits, LDH cytotoxicity assays | Monitor tissue functionality and viability |
| Modeling Software | PBPK platforms (GastroPlus, Simcyp), mathematical modeling tools | Translate experimental data into human bioavailability predictions |
Integrated Data Analysis and Validation Approaches
Statistical Framework for Equation Validation
Robust validation of predictive bioavailability equations requires multiple complementary statistical approaches to assess different aspects of performance [9] [8] [10].
Correlation and Residual Analysis: Evaluate strength and direction of linear relationships between predictor variables and bioavailability outcomes using Pearson's correlation coefficient. Assess residual distributions for normality using Shapiro-Wilk test and graphical methods (Q-Q plots, histograms). Verify homoscedasticity by plotting residuals against predicted values.
Agreement Assessment: Apply Bland-Altman analysis to quantify agreement between measured and predicted values. Calculate mean bias (average difference between methods) and 95% limits of agreement (mean bias ± 1.96 × standard deviation of differences). Identify any relationship between differences and magnitude of measurement.
Individual Prediction Accuracy: Assess clinical relevance at individual level by calculating percentage of predictions falling within ±10% of measured values. This is particularly important for applications where individual dosing or recommendations are required.
Cross-Validation: Employ k-fold cross-validation or leave-one-out cross-validation to assess model performance on data not used in development. For larger datasets, hold out a random subset (typically 20-30%) for external validation.
Implementation Considerations and Limitations
Successful implementation of predictive bioavailability equations requires careful consideration of their inherent limitations and appropriate application boundaries. Even well-validated equations demonstrate variable performance at the individual level, as evidenced by studies showing 15-35% of individual predictions falling outside acceptable error ranges for energy expenditure equations [8]. This highlights the critical need for clinical judgment and periodic verification in applied settings.
Equation performance depends heavily on the representativeness of the development population. Equations developed for specific populations (e.g., Brazilian adults with obesity [10]) typically outperform generalized equations when applied to similar groups but may show reduced accuracy in divergent populations. Regular re-evaluation and potential refinement is necessary when applying equations to populations with different characteristics.
Emerging technologies continue to enhance predictive capabilities. Microphysiological systems that replicate human organ interactions show promise for improving drug bioavailability predictions while reducing reliance on animal models [11]. Similarly, standardized frameworks for nutrient bioavailability [6] [7] enable more systematic development of predictive tools that account for food matrix effects and host factors. Continued refinement of these approaches will further strengthen the scientific foundation for bioavailability prediction across nutrition and pharmacology.
A Standardized 4-Step Framework for Equation Development
The accurate prediction of nutrient and bioactive compound absorption is a critical challenge in nutritional science and pharmaceutical development. Current nutrient intake recommendations, nutritional assessments, and food labeling primarily rely on the estimated total nutrient content in foods and dietary supplements. However, the biological adequacy of any nutrient intake depends not only on the total amount consumed but also on the fraction that is ultimately absorbed and utilized by the body—a property known as bioavailability [6] [7]. This discrepancy between consumption and utilization highlights a significant gap in nutritional assessment methodologies.
Accurate assessments of nutrient bioavailability require robust predictive equations or algorithms that can translate food composition data into meaningful estimates of biological availability. A standardized framework for developing such equations is essential for enhancing the accuracy and precision of nutrient bioavailability estimates, addressing existing data limitations, and highlighting evidence gaps to inform future research and policy on nutrients and bioactive compounds [6]. This protocol details a standardized 4-step framework designed to guide researchers in developing predictive equations for estimating nutrient absorption and bioavailability, with specific application to the development of predictive bioavailability equations.
Theoretical Background
Bioavailability refers to the proportion of an ingested nutrient or compound that is absorbed from the gastrointestinal tract and becomes available for physiological functions or storage in the body. For orally administered substances, this encompasses the processes of liberation, absorption, distribution, metabolism, and elimination. The fundamental principle driving the need for predictive equations is that multiple factors beyond chemical structure influence these processes, including dietary matrix effects, host-related factors, and nutrient-nutrient interactions.
Quantitative Structure-Activity Relationship (QSAR) models represent one computational approach for predicting toxicokinetic properties like oral bioavailability. These models correlate the structural properties of molecules with their biological activity or absorption characteristics, allowing for the prediction of new compounds based on their similarity to previously studied molecules [12]. The framework described herein provides a standardized methodology for developing such models specifically for nutrient bioavailability prediction.
Materials and Reagents
Research Reagent Solutions for Bioavailability Research
Table 1: Essential Research Reagents and Computational Tools for Bioavailability Equation Development
| Item Category | Specific Examples | Function and Application |
|---|---|---|
| Data Sources | High-quality human studies, Animal model data, Epidemiologic datasets, Existing nutrient databases | Provides experimental evidence on absorption parameters; forms the foundation for variable identification and model training [6] [13]. |
| Computational Tools | QSAR Modeling Software, Machine Learning algorithms (e.g., R-CatBoost, R-RF), Statistical Analysis Packages, Mordred descriptor calculator | Used for descriptor calculation, model construction, variable selection, and statistical validation of predictive equations [12]. |
| Literature Review Databases | PubMed, Scopus, Web of Science, EMBASE, Specialist nutritional databases | Enable comprehensive literature review to identify influencing factors and existing evidence [6]. |
| Validation Datasets | Independent human clinical trials, Stable isotope studies, In vitro digestion models | Provide external data not used in model development to test predictive performance and generalizability [6] [12]. |
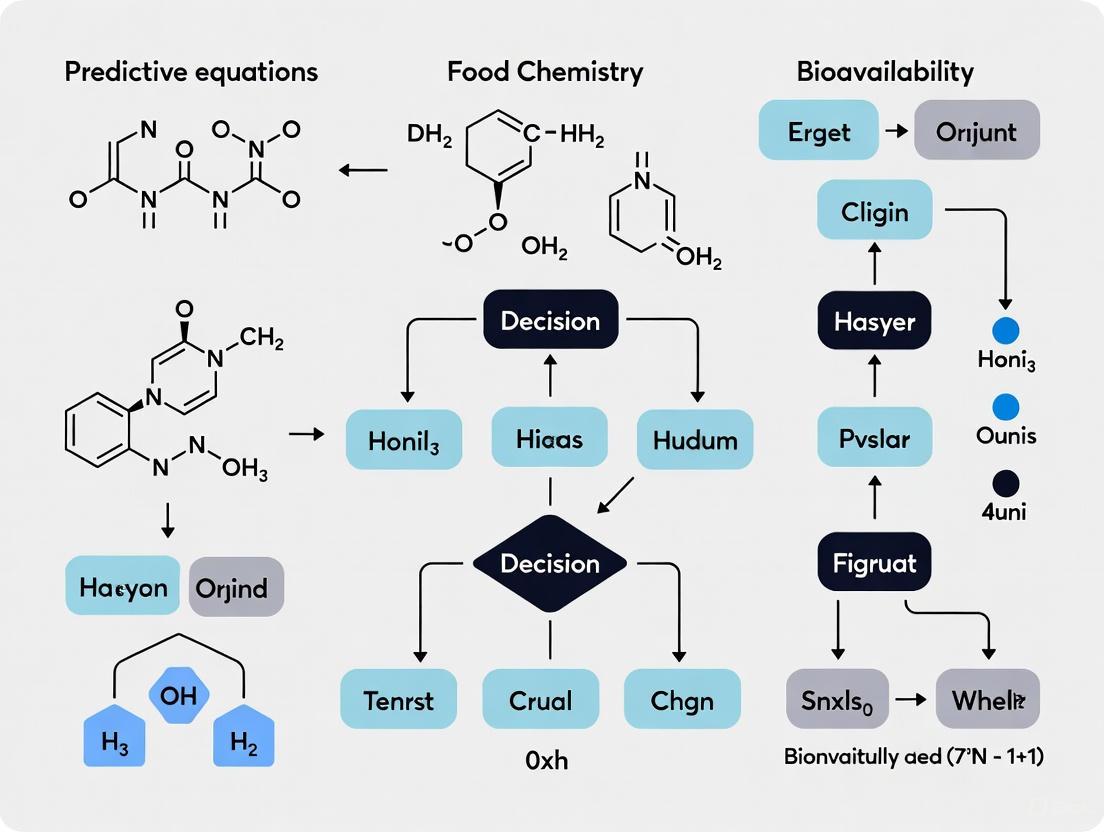
Standardized 4-Step Framework Protocol
This framework provides a systematic approach for developing robust, validated equations to predict nutrient bioavailability, enhancing the translation of research into improved dietary recommendations and product formulations.
Step 1: Identification of Influencing Factors
Objective: To systematically identify and categorize all known factors that influence the bioavailability of the target nutrient or bioactive compound.
Procedure:
- Define Compound Characteristics: Document the physicochemical properties of the target compound, including molecular weight, solubility, stability under different pH conditions, and chemical forms (e.g., different iron salts, vitamin E isomers) [13].
- Identify Dietary Factors: Catalog dietary components that may enhance or inhibit bioavailability. For minerals like iron and zinc, this includes:
- Enhancers: Ascorbic acid, meat or fish protein (the "MFP factor"), certain organic acids.
- Inhibitors: Phytic acid, polyphenols, tannins, calcium, certain dietary fibers [6].
- Document Host-Related Factors: Identify subject characteristics that modify absorption, such as:
- Physiological Status: Nutrient status (e.g., iron stores), life stage (e.g., pregnancy, infancy), health status.
- Genetic Factors: Variations in transporters or metabolic enzymes.
- Compile a Factor Inventory: Create a comprehensive table of all identified factors for reference during model development. This inventory ensures that potential predictor variables are not overlooked.
Troubleshooting Tip: If information on a specific factor is conflicting, note the discrepancy and prioritize factors with consistent evidence from high-quality human studies for initial model building.
Step 2: Comprehensive Literature Review
Objective: To gather, evaluate, and synthesize high-quality human data on the bioavailability of the target compound to inform variable selection and model structure.
Procedure:
- Develop a Review Protocol: Define specific inclusion and exclusion criteria a priori. Prioritize:
- Study Designs: Randomized controlled trials, stable isotope studies, and balance studies in human subjects.
- Data Richness: Studies that report absolute absorption values (e.g., Fractional Absorption - F%) rather than only relative differences.
- Population Relevance: Studies in populations relevant to the intended application of the final equation [6].
- Execute Systematic Search: Conduct a comprehensive search across multiple scientific databases using a predefined search strategy. Document the number of studies identified, included, and excluded.
- Data Extraction: Systematically extract key data from included studies into a standardized template. Essential data points include:
- Participant characteristics and sample size.
- Compound form and dosage.
- Dietary context and meal composition.
- Method used to assess bioavailability.
- Mean absorption values and measures of variance (SD, SEM).
- Quality Assessment: Evaluate each study for potential biases (e.g., selection bias, measurement bias) and overall quality. Tools like the GRADE approach can be adapted for this purpose [14].
Troubleshooting Tip: For data-poor nutrients, the review may need to be expanded to include high-quality animal studies, but these should be clearly flagged and their limitations acknowledged due to interspecies differences [13].
Step 3: Equation Construction
Objective: To develop one or more candidate mathematical equations that predict bioavailability based on the key variables identified in Steps 1 and 2.
Procedure:
- Dataset Curation: Compile a unified dataset from the literature review. Handle missing data appropriately (e.g., imputation or exclusion) and document all decisions.
- Variable Selection: Use statistical methods to select the most influential predictors from the factor inventory. Techniques include:
- VSURF Algorithm: For selecting the most relevant molecular descriptors from a large pool [12].
- Stepwise Regression: To iteratively add/remove variables based on statistical criteria.
- Domain Knowledge: Forcing critically important biological factors into the model even if statistical significance is marginal.
- Model Fitting: Apply appropriate modeling techniques to derive the equation.
- For Continuous Outcomes (e.g., F%): Use multiple linear regression or machine learning regression algorithms (Random Forest, CatBoost) [12].
- For Categorical Outcomes (e.g., Low/Medium/High): Use logistic regression or classification algorithms.
- Equation Specification: Document the final candidate equation(s) in standard mathematical form, including all coefficients and their standard errors. For example:
Predicted Iron Absorption (%) = β₀ + β₁*(Vitamin C intake) + β₂*(Phytic acid intake) + β₃*(Iron status).
Diagram 1: Workflow for equation construction and internal evaluation.
Step 4: Model Validation
Objective: To assess the predictive performance and generalizability of the developed equation using data not used in its construction.
Procedure:
- Internal Validation: Assess model performance on the training data using resampling techniques like bootstrapping or cross-validation. Calculate key performance metrics (see Table 2) [15].
- External Validation: This is the critical step for establishing model credibility.
- Obtain one or more independent datasets of human studies that were not used in model building.
- Apply the developed equation to this new data.
- Calculate validation metrics by comparing predicted versus observed bioavailability values.
- Performance Benchmarking: Compare the performance of the new equation against existing models or default assumptions (e.g., a fixed absorption percentage).
- Sensitivity Analysis: Explore how model predictions change with variations in key input parameters to identify the most sensitive drivers of bioavailability.
Table 2: Key Validation Metrics for Predictive Bioavailability Equations
| Metric | Formula/Description | Interpretation and Ideal Value | ||
|---|---|---|---|---|
| Q²F₃ (for Regression) | A metric for external validation prediction performance [12]. | Values closer to 1.0 indicate better predictive performance. A value of 0.34 was reported for a robust oral bioavailability QSAR model [12]. | ||
| Geometric Mean Fold Error (GMFE) | `GMFE = 10^(∑ | log10(Predicted/Observed) | / n)` | Measures central tendency of prediction error. Ideal value is 1.0, indicating no systematic over- or under-prediction. A value of 2.35 was achieved for a VDss model [12]. |
| Root Mean Square Error (RMSE) | RMSE = √[Σ(Predictedᵢ - Observedᵢ)² / n] |
Measures the average magnitude of prediction error. Lower values indicate better accuracy. Should be interpreted in the context of the absorption range. | ||
| Correlation Coefficient (R) | R = cov(P, O) / (σₚ σₒ) |
Measures the strength and direction of the linear relationship between predicted (P) and observed (O) values. Closer to 1.0 is better. |
Diagram 2: Model validation workflow illustrating the critical pathway from internal to external validation.
Applications and Implications
Successfully developed and validated equations have transformative applications across multiple fields. In public health and nutrition, they enable more accurate assessment of nutrient adequacy at the population level and refine dietary reference intakes by moving beyond total intake to consider utilizable nutrient levels [6] [7]. For the food and pharmaceutical industries, these algorithms are powerful tools for comparing products, enhancing formulations to maximize nutrient delivery, and reducing ingredient waste by optimizing inclusion levels [16]. Furthermore, they contribute to scientific research by providing a standardized method to estimate bioavailability when direct measurement is impractical, thereby supporting the evaluation of global food system sustainability [16].
The transdisciplinary nature of this framework bridges fields from computational chemistry and machine learning to clinical nutrition and regulatory science, fostering a more integrated and evidence-based approach to understanding nutrient utilization.
Identifying Key Factors Influencing Nutrient and Bioactive Compound Bioavailability
The bioavailability of a nutrient or bioactive compound—defined as the proportion that is absorbed from the diet and becomes available for physiological functions—is a critical determinant of its efficacy. Current nutrient intake recommendations, nutritional assessments, and food labeling primarily rely on the total nutrient content in foods, which does not account for variations in absorption and utilization [4] [6]. Accurately predicting bioavailability remains a significant challenge in both nutrition science and drug development. This application note outlines a structured framework and detailed protocols for identifying key factors influencing bioavailability and developing predictive equations, providing researchers with practical methodologies to advance this field.
Core Framework for Developing Predictive Bioavailability Equations
A recently proposed structured framework for developing predictive bioavailability equations consists of four sequential steps designed to enhance the accuracy and precision of nutrient bioavailability estimates [4] [6] [7].
Table 1: Four-Step Framework for Bioavailability Prediction Equation Development
| Step | Description | Key Activities | Primary Output |
|---|---|---|---|
| 1 | Identify Key Influencing Factors | Systematic analysis of food matrix, host, and nutrient-specific factors | Comprehensive list of critical bioavailability modulators |
| 2 | Conduct Literature Review | Gather data from high-quality human studies on absorption and utilization | Curated database of bioavailability measurements |
| 3 | Construct Predictive Equations | Apply statistical modeling and machine learning algorithms | Preliminary predictive equation or algorithm |
| 4 | Validate and Translate | Conduct validation studies to verify predictive accuracy | Validated, ready-to-use prediction model |
The following diagram illustrates the workflow and logical relationships between these steps:
Key Factors Influencing Bioavailability
Bioavailability is influenced by a complex interplay of factors that can be categorized into three primary domains: food matrix effects, host-related factors, and nutrient-specific characteristics.
Table 2: Key Factors Influencing Bioavailability of Nutrients and Bioactive Compounds
| Category | Specific Factors | Impact on Bioavailability |
|---|---|---|
| Food Matrix | Food composition and structure | The physical entrapment of nutrients within plant cell walls can limit their release during digestion [17]. |
| Presence of inhibitors/enhancers | Dietary components like phytates can inhibit mineral absorption, while lipids can enhance absorption of fat-soluble vitamins [18]. | |
| Food processing and preparation | Techniques like heating, grinding, or fermentation can break down cell walls and anti-nutritional factors, increasing bioavailability [17]. | |
| Host Factors | Gastrointestinal physiology | Age-dependent changes in gastric pH, intestinal surface area, and transit time significantly impact absorption [19]. |
| Genetic polymorphisms | Variations in genes encoding metabolizing enzymes (e.g., CYP450) and transport proteins (e.g., P-glycoprotein) affect nutrient and drug disposition [20]. | |
| Health status and microbiome | Gut microbiota can metabolize compounds into more or less bioavailable forms; inflammation or disease states can alter absorption [18]. | |
| Nutrient/Drug Properties | Chemical structure | Molecular size, lipophilicity, and solubility directly influence membrane permeability and absorption potential [20] [21]. |
| Interaction with transport systems | Affinity for efflux transporters like P-glycoprotein can significantly reduce systemic availability [20]. | |
| Metabolism by intestinal/hepatic enzymes | First-pass metabolism by enzymes like CYP3A4 is a major determinant of oral bioavailability for many compounds [20]. |
Experimental Protocols for Bioavailability Assessment
Protocol for Systematic Literature Review and Data Collection
Purpose: To gather high-quality human data for informing predictive equation development.
Materials:
- Electronic database access (e.g., PubMed, Scopus, Web of Science)
- Reference management software (e.g., EndNote, Zotero)
- Data extraction forms (electronic or paper-based)
Procedure:
- Define Inclusion/Exclusion Criteria: Establish specific criteria based on population (e.g., healthy adults, specific age groups), intervention (e.g., specific nutrient/compound), study design (e.g., randomized controlled trials, crossover studies), and outcomes (e.g., absorption measured by stable isotopes, plasma concentration).
- Develop Search Strategy: Create comprehensive search queries using relevant keywords and Medical Subject Headings (MeSH terms) related to the nutrient/compound of interest and "bioavailability," "absorption," or "pharmacokinetics."
- Screen Studies: Perform initial title/abstract screening followed by full-text review of potentially relevant studies. Use two independent reviewers to minimize bias.
- Extract Data: Systematically extract data using standardized forms, including study characteristics, participant demographics, intervention details, methodology, and outcome measures.
- Assess Quality: Evaluate study quality using appropriate tools (e.g., Cochrane Risk of Bias tool, Newcastle-Ottawa Scale).
- Synthesize Evidence: Tabulate and summarize findings, noting consistent patterns and evidence gaps.
Protocol for Computational Prediction of Oral Bioavailability
Purpose: To develop in silico models for predicting human oral bioavailability using molecular descriptors.
Materials:
- Chemical structures of compounds (in SMILES or SDF format)
- Molecular descriptor calculation software (e.g., Dragon, Mordred)
- Machine learning environment (e.g., Python with scikit-learn, R)
- Validated dataset of compounds with known bioavailability values
Procedure:
- Dataset Curation:
- Compile a dataset of compounds with experimentally measured oral bioavailability values.
- Divide the dataset into training (≈80%) and test (≈20%) sets, ensuring structural diversity.
Descriptor Calculation:
- Generate a comprehensive set of molecular descriptors (e.g., constitutional, topological, geometrical, quantum-chemical) for each compound.
- Pre-process descriptors by removing those with zero variance and high correlation.
Model Building:
- Select appropriate machine learning algorithms (e.g., Random Forest, Support Vector Machine, Multiple Linear Regression).
- Train models using the training set and selected descriptors.
- Optimize model hyperparameters via cross-validation.
Model Validation:
- Evaluate model performance on the held-out test set using metrics such as Accuracy, Sensitivity, Specificity, and Matthews Correlation Coefficient (MCC).
- Apply Y-randomization or external validation to test model robustness.
Model Interpretation:
- Use feature importance analysis (e.g., SHAP values) to identify molecular descriptors most critical for bioavailability prediction.
Table 3: Example Performance Metrics for a Random Forest Bioavailability Prediction Model (Based on [22])
| Model Type | Cutoff | Test Set Accuracy | Sensitivity | Specificity | AUC-ROC |
|---|---|---|---|---|---|
| Consensus Random Forest | 50% | 82.3% | 0.85 | 0.80 | 0.878 |
| Consensus Random Forest | 20% | 85.0% | 0.87 | 0.83 | 0.830 |
The computational workflow for this protocol is detailed below:
Protocol for Pediatric Bioavailability Prediction Using Allometric Scaling
Purpose: To predict absolute bioavailability in pediatric populations when only adult data are available.
Materials:
- Adult pharmacokinetic data (systemic and oral clearance values)
- Population data (body weights for different age groups)
- Statistical software for calculations
Procedure:
- Predict Pediatric Clearance:
- Apply the Age-Dependent Exponent (ADE) allometric model using equation:
- Use age-dependent exponents (b): 1.2 (preterm neonates ≤3 months), 1.1 (term neonates ≤3 months), 1.0 (>3 months to 2 years), 0.9 (>2-5 years), 0.75 (>5 years) [19].
Predict Absolute Bioavailability:
- Calculate predicted absolute bioavailability (F) using the ratio of predicted systemic clearance (CLiv) to predicted oral clearance (CLoral):
Validation:
- Compare predicted bioavailability with observed values when available.
- Acceptable prediction error is typically defined as within 0.5-1.5 fold (≤50% error) [19].
The Scientist's Toolkit: Essential Research Reagents and Materials
Table 4: Key Research Reagent Solutions for Bioavailability Studies
| Reagent/Material | Function/Application | Example Use Cases |
|---|---|---|
| Stable Isotopes | Safe tracers for studying mineral and vitamin absorption in humans without radioactivity. | Quantifying fractional absorption of iron, zinc, calcium using isotopic enrichment measurements in blood or urine [4]. |
| Caco-2 Cell Line | Human colon adenocarcinoma cell line that differentiates into enterocyte-like cells, forming a polarized monolayer. | In vitro model for predicting intestinal permeability and absorption of nutrients and drugs [21]. |
| Molecular Descriptor Software (e.g., Dragon, Mordred) | Computes theoretical molecular descriptors from chemical structure. | Generating 1,143+ 2D descriptors (constitutional, topological, etc.) for QSAR modeling of oral bioavailability [22]. |
| P-glycoprotein (P-gp) Assays | Assess interaction with key efflux transporter that limits intestinal absorption. | Determining substrate affinity for P-gp to predict potential bioavailability limitations due to active efflux [20]. |
| Cytochrome P450 Assay Kits | Evaluate metabolism by major drug/nutrient metabolizing enzymes (e.g., CYP3A4, CYP2D6). | Estimating first-pass metabolism potential, a critical factor determining oral bioavailability [20]. |
| Simulated Gastrointestinal Fluids | Standardized media mimicking gastric and intestinal conditions for in vitro digestion models. | Studying nutrient release from food matrices and stability during digestion in a controlled, reproducible system [17]. |
The accurate prediction of nutrient and bioactive compound bioavailability requires a multidisciplinary approach integrating food science, physiology, and computational modeling. The framework and protocols outlined in this document provide a structured pathway for developing robust predictive equations. Key success factors include the use of high-quality human data, consideration of critical modifying factors, application of appropriate computational methods, and rigorous validation. As research in this field advances, these methodologies will contribute significantly to the development of evidence-based dietary recommendations and more efficient drug development processes.
Current Limitations in Bioavailability Assessment and Data Gaps
Bioavailability, defined as the fraction of an administered dose that reaches systemic circulation unaltered, serves as a critical determinant of a drug's therapeutic efficacy and commercial viability [1]. Despite significant advancements in life sciences, accurate assessment of bioavailability remains challenging due to a complex interplay of physicochemical, biological, and technological factors [23] [24]. This application note examines the current limitations and data gaps in bioavailability assessment within the context of developing predictive bioavailability equations, providing researchers with structured experimental protocols to address these challenges.
Key Limitations in Bioavailability Assessment
Methodological and Technical Limitations
Table 1: Methodological Limitations in Bioavailability Assessment
| Limitation Category | Specific Challenge | Impact on Bioavailability Assessment |
|---|---|---|
| Traditional Model Systems | High cost and methodological rigidity of in vivo trials and in vitro digestion models [25] | Inability to fully simulate the physiological environment; limited predictive accuracy for human outcomes |
| Computational Gaps | Limited mechanistic interpretability of "black box" AI algorithms [25] | Hinders regulatory approval and scientific validation of predictive models |
| Data Quality Issues | Absence of high-quality standardized datasets representing biological complexity [25] | Leads to model overfitting and bias; reduces predictive reliability |
| Analytical Simplifications | Assumption of constant drug clearance and uniform distribution in AUC calculations [1] | Generates unreliable data when physiological conditions vary |
Biological Complexity and Variability
The journey of an active pharmaceutical ingredient from administration to target site involves navigating complex biological barriers that introduce significant variability in bioavailability assessment.
Biological factors such as genetic polymorphisms of intestinal transporters (e.g., P-glycoprotein), hepatic cytochrome P450 enzyme variations, and disease states that alter gastrointestinal physiology significantly impact bioavailability but are difficult to standardize in assessment models [1]. Additionally, the gut microbiota, food effects, and concurrent medications introduce further variability that is not fully captured in conventional study designs [1] [25].
Technological and Regulatory Gaps
The 2023 FDA Pilot Program for the Review of Innovation and Modernization of Excipients (PRIME) highlights regulatory recognition of bioavailability challenges, particularly for novel excipients [23]. However, a 2020 USP survey revealed that 84% of drug formulators reported limitations imposed by currently approved excipients, with 28% experiencing drug development discontinuation due to these limitations [23]. This underscores a critical technological gap in formulation tools for bioavailability enhancement.
Experimental Protocols for Addressing Data Gaps
Protocol for High-Throughput Formulation Screening
Objective: Systematically identify optimal formulation candidates for bioavailability enhancement of poorly soluble compounds.
Materials:
- Test Compound: API with known solubility limitations
- Polymer Library: Diverse set of pharmaceutical polymers (e.g., HPMC, PVP, PEG)
- Solubilizers: Surfactants and lipid-based excipients
- Equipment: Automated liquid handling system, dissolution apparatus, HPLC-MS system
Procedure:
- Formulation Design: Create a design of experiments (DoE) matrix varying polymer type, polymer:API ratio, and solubilizer concentration.
- Library Preparation: Utilize automated systems to prepare formulation libraries in 96-well plate format. Include control formulations for baseline comparison.
- Dissolution Testing: Conduct miniaturized dissolution studies using USP apparatus II adaptations with physiological relevant media (FaSSGF, FaSSIF, FeSSIF).
- Analytical Characterization: Sample at predetermined time points (5, 10, 15, 30, 45, 60, 90, 120 min) and analyze drug concentration using HPLC-MS with validated methods.
- Stability Assessment: Subject lead formulations to accelerated stability conditions (40°C/75% RH) for 4 weeks with weekly sampling.
- Data Integration: Calculate key parameters including dissolution efficiency (DE), mean dissolution time (MDT), and supersaturation maintenance.
Data Analysis: Apply multivariate analysis to identify critical formulation factors influencing dissolution performance. Select lead formulations based on a combined evaluation of dissolution rate, extent, and stability.
Protocol for Assessing Transporter-Mediated Absorption
Objective: Characterize the role of specific intestinal transporters in API absorption and identify potential drug-drug interactions.
Materials:
- Cell Models: Caco-2, MDCK, or transfected cell lines overexpressing specific transporters
- Test Compound: API with suspected transporter involvement
- Reference Compounds: Known substrates and inhibitors of relevant transporters
- Buffers: Transport buffers (pH 6.0-7.4) with and without inhibitors
Procedure:
- Cell Culture and Validation: Maintain cell monolayers on permeable supports. Validate monolayer integrity by measuring transepithelial electrical resistance (TEER) and lucifer yellow permeability.
- Bidirectional Transport Studies:
- A-to-B Direction: Apply test compound to apical chamber, sample from basolateral chamber
- B-to-A Direction: Apply test compound to basolateral chamber, sample from apical chamber
- Include control compounds with known transport characteristics
- Inhibition Studies: Repeat transport studies in presence of specific transporter inhibitors (e.g., verapamil for P-gp, Ko143 for BCRP)
- Concentration-Dependent Studies: Assess transport across a range of concentrations (typically 1-100 μM) to determine kinetic parameters
- Sample Analysis: Quantify compound concentrations using LC-MS/MS with stable isotope-labeled internal standards
Data Analysis: Calculate apparent permeability (Papp), efflux ratio, and determine kinetic parameters (Km, Vmax) for saturable processes. Significant reduction in efflux ratio with specific inhibitors indicates transporter involvement.
Protocol for In Vitro - In Vivo Correlation (IVIVC) Development
Objective: Establish predictive relationships between in vitro dissolution and in vivo bioavailability to support biowaivers and formulation development.
Materials:
- Formulations: Multiple formulations with different release rates (slow, medium, fast)
- In Vitro Data: Dissolution profiles in physiologically relevant media
- In Vivo Data: Plasma concentration-time profiles from human or animal studies
Procedure:
- In Vitro Dissolution: Characterize dissolution profiles of all formulations using appropriate apparatus and media simulating gastrointestinal conditions.
- In Vivo Pharmacokinetics: Obtain plasma concentration-time data for each formulation from clinical or preclinical studies with crossover design.
- Data Preprocessing: Calculate fraction dissolved in vitro and fraction absorbed in vivo using Wagner-Nelson or Loo-Riegelman methods.
- Model Development:
- Level A: Point-to-point correlation between fraction dissolved and fraction absorbed
- Level B: Correlation based on statistical moments (mean dissolution time vs mean residence time)
- Level C: Single point correlation (e.g., dissolution efficiency vs AUC)
- Model Validation: Evaluate predictive performance using internal validation (cross-validation) and external validation (with additional formulations).
Data Analysis: Develop linear or non-linear regression models correlating in vitro and in vivo parameters. Establish acceptance criteria for prediction errors (≤10% for Cmax and AUC) to demonstrate predictive capability.
The Scientist's Toolkit: Essential Research Reagents and Materials
Table 2: Key Research Reagent Solutions for Bioavailability Studies
| Reagent/Material | Function in Bioavailability Assessment | Application Examples |
|---|---|---|
| Amorphous Solid Dispersions (ASDs) | Enhance solubility and dissolution rate of poorly soluble compounds [23] | Formulation platform for BCS Class II and IV compounds [23] |
| Novel Excipients | Overcome limitations of traditional excipients in drug development [23] | Amphiphilic polymers for nanoparticle drug delivery [23] |
| PBPK Modeling Software | Mechanistic modeling of drug disposition incorporating physiology and drug properties [26] | Prediction of first-pass metabolism, food effects, and drug-drug interactions [26] |
| Caco-2 Cell Lines | In vitro model of intestinal permeability and transporter effects [24] | Assessment of passive and active transport mechanisms [24] |
| Biorelevant Media | Simulate gastrointestinal fluids for dissolution testing [24] | FaSSGF, FaSSIF, FeSSIF for predicting in vivo performance [24] |
| Stable Isotope Labels | Track drug absorption and metabolism without interference from endogenous compounds [4] | Human studies to quantify nutrient and drug bioavailability [4] |
The assessment of bioavailability remains constrained by methodological limitations, biological complexities, and technological gaps. The protocols and tools outlined in this application note provide a systematic approach to addressing critical data gaps, particularly in the realms of formulation screening, transporter interactions, and IVIVC development. As the field evolves, integrating artificial intelligence with high-quality experimental data presents a promising path toward more predictive bioavailability equations that can accelerate drug development and improve therapeutic outcomes [25].
Methodological Approaches: From Traditional Regression to Advanced Machine Learning
Multivariate Linear Regression for Nutritional Biomarker Prediction
The development of robust predictive equations is paramount for advancing the understanding of nutrient bioavailability, moving beyond the simplistic measurement of total nutrient content in foods to accurately estimating the fraction that is absorbed and utilized by the body [6] [4]. This shift is critical for refining nutrient intake recommendations, nutritional assessments, and food labeling practices. Within this context, multivariate linear regression serves as a foundational statistical methodology for modeling the relationship between multiple nutritional biomarkers and clinically relevant outcomes, such as bioactive compound absorption or disease risk. The core objective is to construct predictive models that can quantify these complex relationships, thereby enabling more precise and personalized dietary interventions and health management strategies [27] [28].
The application of these models extends into various domains of nutritional science. For instance, machine learning-based frameworks have been successfully implemented to predict Metabolic Syndrome (MetS) using serum liver function tests and high-sensitivity C-reactive protein (hs-CRP), demonstrating the power of combining multiple biomarkers for enhanced predictive accuracy [28]. Similarly, latent variable approaches like the multiMarker framework have been developed to model the relationship between food intake and multiple metabolomic biomarkers, providing a tool for objective food intake assessment that accounts for prediction uncertainty [29]. These approaches highlight the evolution from single-biomarker models to more sophisticated multi-biomarker strategies that offer greater specificity and sensitivity.
Core Predictive Equation Development Framework
A structured, multi-step framework is essential for developing valid and reliable predictive equations for nutrient bioavailability. The following table summarizes a standardized four-step process adapted for nutritional biomarker prediction [6] [4]:
Table 1: Framework for Developing Predictive Equations for Nutrient Bioavailability
| Step | Description | Key Activities | Application to Nutritional Biomarkers |
|---|---|---|---|
| 1. Identify Key Factors | Determine which factors influence the bioavailability of the nutrient or bioactive compound. | Systematic review of physiological mechanisms, food matrix effects, and host factors. | Identify relevant nutritional biomarkers (e.g., liver enzymes, inflammatory markers) and confounding variables (e.g., age, sex). |
| 2. Comprehensive Literature Review | Gather data from high-quality human studies to inform equation development. | Critically appraise intervention studies that measure biomarker responses to controlled nutrient intakes. | Collect data on biomarker levels across different intake levels and population subgroups to establish dose-response relationships. |
| 3. Construct Predictive Equations | Build the multivariate regression model using the identified biomarkers and factors. | Apply statistical modeling techniques, including variable selection and parameter estimation. | Develop an equation where a health outcome or nutrient status is predicted by a linear combination of multiple biomarker values. |
| 4. Validate the Equation | Assess the model's performance and generalizability to new populations. | Internal validation (e.g., cross-validation) and external validation in an independent cohort. | Quantify predictive performance using metrics like R², correlation coefficients, and error rates, and refine the model as needed. |
This framework ensures a systematic approach from conceptualization to validation. The construction phase (Step 3) often employs advanced regression techniques. For example, penalized regression methods like LASSO (Least Absolute Shrinkage and Selection Operator) and Elastic Net are particularly valuable for identifying the most relevant biomarkers from a larger set of potential predictors, thereby building a more parsimonious and interpretable model [27]. These methods prevent overfitting by applying a penalty to the regression coefficients, which can shrink insignificant coefficients to zero, effectively performing variable selection.
Validation (Step 4) is a critical final step. Techniques such as Monte Carlo cross-validation can be used to enhance the reliability of the feature selection process and provide a robust estimate of how the model will perform on unseen data [27]. In practice, a well-constructed model using top biomarker predictors can achieve high correlation between predicted and observed outcomes (e.g., correlations above 0.92) and significantly reduce prediction uncertainty [27].
Detailed Experimental Protocol for Model Development
Data Collection and Preprocessing
Begin by assembling a dataset from a controlled intervention study or a well-characterized cohort. The dataset should include precise measurements of food intake or nutrient administration and corresponding biomarker measurements from blood, urine, or other relevant biofluids [29]. The unit of measure for biomarkers should be consistent and documented. Key preprocessing steps include:
- Data Cleaning: Address missing values through appropriate imputation methods or exclusion criteria.
- Data Transformation: Apply transformations (e.g., log-transformation) to normalize skewed distributions of biomarker levels.
- Data Structuring: Format data into a matrix where each row represents an observation (e.g., a study participant) and columns represent the administered food quantity and the P biomarker measurements [29].
Model Fitting and Variable Selection
Using the preprocessed dataset, fit a multivariate linear regression model. The model can be represented as:
Outcome_i = β₀ + β₁*Biomarker₁i + β₂*Biomarker₂i + ... + βₚ*Biomarker_Pi + ε_i
where Outcome_i is the health outcome or nutrient status for individual i, β₀ is the intercept, β₁ to βₚ are the regression coefficients for each biomarker, and ε_i is the error term.
For high-dimensional data (many potential biomarkers), implement a penalized regression approach:
- LASSO Regression: Applies an L1 penalty that tends to force some coefficients to exactly zero, thus performing feature selection.
- Elastic Net Regression: Combines L1 and L2 penalties, which is particularly useful when biomarkers are highly correlated [27].
The model is fitted to maximize the goodness-of-fit, often using techniques like maximum likelihood estimation within a cross-validation framework to tune the penalty parameters.
Model Validation and Intake Prediction
Once the model is fitted and the parameters are estimated, it must be validated.
- Internal Validation: Use k-fold cross-validation or hold-out validation within the original dataset to assess performance metrics like R-squared, mean squared error, and the correlation between predicted and observed values [27] [28].
- External Validation: If possible, test the model on a completely independent dataset to evaluate its generalizability.
For predicting food intake or nutrient status from new biomarker data alone, the estimated model coefficients are applied to the new biomarker measurements. Software tools like the multiMarker R package can be used to generate predictions along with their associated uncertainty, often expressed as credible intervals [29].
Workflow Visualization
The following diagram illustrates the logical workflow for developing and applying a multivariate linear regression model for nutritional biomarker prediction.
The Scientist's Toolkit: Essential Research Reagents and Materials
The following table details key reagents, software, and methodological approaches essential for research in this field.
Table 2: Essential Research Reagents and Solutions for Nutritional Biomarker Prediction
| Category | Item / Technique | Specification / Function |
|---|---|---|
| Biomarker Assays | High-sensitivity C-reactive Protein (hs-CRP) | Quantifies systemic inflammation, a key predictor in metabolic syndrome models [28]. |
| Liver Function Tests (ALT, AST, Bilirubin) | Enzymes and metabolites indicating liver health, correlated with metabolic dysregulation [28]. | |
| Statistical Software | R Statistical Environment | Primary platform for data analysis, model fitting, and visualization. |
multiMarker R Package |
Specialized package for modeling food intake from multiple biomarkers using a Bayesian latent variable approach [29]. | |
ordinalNet, truncnorm |
Supporting R packages for ordinal regression and truncated normal distributions, used by multiMarker [29]. |
|
| Modeling Algorithms | Penalized Regression (LASSO, Elastic Net) | Advanced regression methods for feature selection and managing multicollinearity among biomarkers [27]. |
| Gradient Boosting (GB) | Machine learning algorithm known for high predictive accuracy in complex biological datasets [28]. | |
| Computational Methods | Monte Carlo Cross-Validation | Technique to assess model stability and the reliability of selected biomarkers [27]. |
| SHAP (SHapley Additive exPlanations) | Framework for interpreting complex machine learning models and identifying influential predictors [28]. |
The integration of multivariate linear regression and related machine learning techniques with carefully selected nutritional biomarkers provides a powerful approach for predicting nutrient bioavailability and associated health outcomes. By adhering to a structured development framework that emphasizes rigorous validation and uncertainty quantification, researchers can create robust tools that advance the field of precision nutrition. These models hold significant promise for improving dietary assessment, informing public health policy, and ultimately guiding personalized nutritional interventions.
QSAR Models for Predicting Oral Bioavailability and Volume of Distribution
Within the framework of a broader thesis on developing predictive bioavailability equations, the in silico estimation of toxicokinetic (TK) properties represents a critical pillar. TK profiles provide essential information on the fate of chemicals in the human body, namely absorption, distribution, metabolism, and excretion (ADME) [12]. In the context of drug discovery and chemical risk assessment, Quantitative Structure-Activity Relationship (QSAR) models are indispensable computational tools for predicting key TK parameters, thereby reducing reliance on costly and time-consuming in vivo experiments [30] [12]. This document details the application of newly developed QSAR models for two fundamental TK properties: oral bioavailability (F%) and volume of distribution at steady state (VDss). The focus is placed on their practical application, particularly for mapping the TK space of potential endocrine-disrupting chemicals (EDCs), which can pose significant risks to human health [30].
Data Presentation and Model Performance
The development of robust QSAR models relies on large, curated datasets. The following tables summarize the core data and performance metrics for the oral bioavailability and VDss models.
Table 1: Summary of Datasets for Model Development
| TK Endpoint | Dataset Purpose | Number of Chemicals | Key Data Characteristics |
|---|---|---|---|
| Oral Bioavailability (F%) | Regression Models | 1,712 | Values span 0% to 100%; peaks at 0% and 100% [12] |
| Classification Models (>50% threshold) | 1,307 | Binary classification based on a 50% bioavailability threshold [12] | |
| Multiclass Models | 1,244 | Utilized 30-60% thresholds for intermediate classes [12] | |
| Volume of Distribution (VDss) | Regression & Multiclass Models | 1,591 | Range: 0.035 L·kg⁻¹ to 700 L·kg⁻¹; values log-transformed (ln) for modeling [12] |
Table 2: Predictive Performance of Top Models
| TK Endpoint | Model Type | Best Algorithm | Performance Metric & Value |
|---|---|---|---|
| Oral Bioavailability | Regression | R-CatBoost | Q2F3 = 0.34 [30] [12] |
| Volume of Distribution (VDss) | Regression | R-Random Forest (R-RF) | GMFE = 2.35 [30] [12] |
The chemical space of the collected compounds was characterized using Uniform Manifold Approximation and Projection (UMAP), revealing a diverse landscape for both F% and VDss, supporting the use of machine learning to capture complex, non-linear patterns for prediction [12].
Experimental Protocols
Protocol 1: Developing a QSAR Model for Oral Bioavailability
Objective: To construct a regression QSAR model for predicting the oral bioavailability (F%) of new chemical entities.
Materials:
- A curated dataset of 1,712 chemicals with experimentally measured F% values [12].
- Molecular descriptor calculation software (e.g., Mordred) [12].
- Machine learning environment (e.g., Python with Scikit-learn, CatBoost).
Procedure:
- Data Curation and Preparation: Assemble the chemical dataset and corresponding F% values. Ensure chemical structures are standardized.
- Molecular Descriptor Calculation: Compute a comprehensive set of molecular descriptors (e.g., 1,826 descriptors via Mordred) for each chemical in the dataset [12].
- Descriptor Selection: Apply a feature selection algorithm (e.g., VSURF) to identify the most relevant and non-redundant descriptors, reducing the initial set to a manageable number (e.g., 66 descriptors) to improve model interpretability and avoid overfitting [12].
- Dataset Splitting: Divide the dataset into a training set (e.g., 1,213 chemicals) for model building and a hold-out validation set (e.g., 405 chemicals) for final performance evaluation [12].
- Model Training and Validation: Train multiple regression algorithms (e.g., CatBoost, Random Forest, Support Vector Machine) on the training set using the selected descriptors. Optimize model hyperparameters via cross-validation.
- Model Evaluation: Apply the trained model to the validation set. Assess performance using metrics such as Q2F3, which is a measure of external validation predictability [12].
Protocol 2: Predicting VDss and Mapping TK Space for EDCs
Objective: To apply validated QSAR models for VDss and F% to a list of potential Endocrine-Disrupting Chemicals (EDCs) to identify high-risk compounds.
Materials:
- Pre-trained QSAR models for VDss (R-RF) and oral bioavailability (R-CatBoost).
- A list of potential EDCs with defined chemical structures.
- Software for calculating molecular descriptors compatible with the pre-trained models.
Procedure:
- Chemical Input Preparation: Standardize the molecular structures of the target EDCs.
- Descriptor Generation: Calculate the same set of molecular descriptors used in the original model training for each EDC.
- Property Prediction: Input the calculated descriptors into the pre-trained VDss and oral bioavailability models to obtain predicted values.
- TK Space Mapping: Create a scatter plot or similar visualization with predicted VDss and oral bioavailability as the axes. Plot each EDC on this graph to map the collective "TK Space."
- Risk Identification: Identify EDCs that fall into high-risk quadrants, for instance, those with high predicted oral bioavailability (indicating efficient systemic absorption) and high predicted VDss (suggesting extensive tissue distribution and potential for accumulation) [30] [12]. These compounds should be prioritized for further experimental investigation.
The Scientist's Toolkit: Essential Research Reagents and Materials
Table 3: Key Resources for QSAR Modeling of TK Properties
| Item / Reagent | Function in Research |
|---|---|
| Curated Chemical Dataset | Provides the experimental (in vivo or in vitro) data on F% and VDss required for training and validating computational models. Serves as the ground truth [12]. |
| Molecular Descriptor Software (e.g., Mordred) | Generates quantitative numerical representations of chemical structures that serve as the input variables (features) for QSAR models [12]. |
| Feature Selection Algorithm (e.g., VSURF) | Identifies the most predictive and non-redundant molecular descriptors from a large initial pool, improving model performance, robustness, and interpretability [12]. |
| Machine Learning Algorithms (e.g., CatBoost, Random Forest) | The core computational engines that learn the complex mathematical relationships between molecular descriptors and the target TK endpoint [30] [12]. |
| Potential EDC List | A set of chemicals of regulatory or scientific interest to which the developed models are applied for risk assessment and prioritization [30] [12]. |
Workflow and Pathway Visualizations
The following diagrams, generated with Graphviz, illustrate the logical workflows and relationships described in the application notes.
QSAR Model Development Workflow
TK Risk Assessment for EDCs
Machine Learning in Pharmacokinetic Parameter Prediction for Drug Dosing
Accurate prediction of pharmacokinetic (PK) parameters is fundamental to developing safe and effective drug dosing regimens. Traditional methods often rely on simplified population averages, which fail to account for complex, non-linear relationships between patient factors and drug disposition. The integration of machine learning into pharmacokinetic modeling represents a paradigm shift, enabling the development of highly personalized and predictive models. This approach is particularly valuable for the overarching goal of developing predictive bioavailability equations, as it allows for the integration of multifaceted data—from in vitro assays and molecular descriptors to patient clinical characteristics—to build more accurate and clinically relevant models.
Key Machine Learning Applications in Pharmacokinetics
Machine learning techniques are being deployed across various facets of pharmacokinetic prediction. The table below summarizes the primary application areas and the corresponding ML methodologies as evidenced by recent research.
Table 1: Key Applications of Machine Learning in Pharmacokinetics
| Application Area | Description | Common ML Algorithms/Tools | Key Findings/Performance |
|---|---|---|---|
| Prediction of PK Parameters [31] | Utilizing inverse modeling with optimization algorithms to estimate patient-specific PK parameters (e.g., k12, k21, Vm) from observed concentration-time data. | Deep Neural Networks (DNN), Physics-Informed Neural Networks (PINN), DeepXDE | Accurately predicts parameters and generates concentration-time curves that closely match observed data across multiple dose levels [31]. |
| Oral Bioavailability (OB) Prediction [32] | Constructing models to predict the fraction of an orally administered drug that reaches the systemic circulation. | Random Forest, XGBoost, CatBoost, LightGBM | Random Forest performed best among tested models; predictions were particularly accurate for OB between 30% and 90% [32]. |
| Drug Clearance Prediction [33] | Predicting the rate of drug elimination from the body, a critical parameter for dosing interval determination. | Convolutional Neural Networks (CNN), Logistic Regression, Gradient Boosting | Achieved exceptional performance (R² > 0.96) with a large methotrexate dataset; performance was more modest (R² = 0.75) with a smaller remifentanil dataset, highlighting data size dependency [33]. |
| Brain Bioavailability Prediction [34] | Predicting the unbound brain-to-plasma partition coefficient (Kpuu,brain,ss), crucial for CNS drug development. | Extreme Gradient Boosting (XGBoost), Support Vector Machine (SVM), Random Forest, Deep Learning | The best model (XGBoost) achieved an accuracy of 85.1% in predicting high/low brain bioavailability in a prospective validation [34]. |
| Automated PopPK Model Development [35] | Automating the identification of optimal population PK model structures, reducing manual effort and timelines. | Bayesian Optimization with Random Forest surrogate, Exhaustive Local Search (via pyDarwin) | Reliably identified model structures comparable to expert-developed models in under 48 hours on average, evaluating fewer than 2.6% of the model search space [35]. |
| Bioequivalence Risk Assessment [36] | Categorizing the risk of generic drug formulations failing bioequivalence studies based on physicochemical and PK properties. | Random Forest, XGBoost, Logistic Regression, Naïve Bayes | An optimized Random Forest model achieved 84% accuracy in predicting bioequivalence risk on test data [36]. |
Detailed Experimental Protocols
Protocol 1: Machine Learning-Based Prediction of Individual Pharmacokinetic Parameters using an Inverse Problem Approach
This protocol details a data-driven method for estimating patient-specific PK parameters for a two-compartment model with oral absorption, a foundational step for individualized dosing [31].
Research Reagent Solutions & Essential Materials
Table 2: Essential Materials for Inverse PK Modeling
| Item | Function/Description |
|---|---|
| Clinical PK Dataset | Contains observed drug concentration-time data from patients, along with demographic and clinical covariates (e.g., weight, renal function). |
| DeepXDE Framework | A deep learning library used to solve differential equations and inverse problems. It facilitates the definition of neural networks and loss functions [31]. |
| Python Environment (v3.7+) | Programming environment with libraries including TensorFlow or PyTorch as backends for DeepXDE, plus NumPy and SciPy for data handling. |
| High-Performance Computing (HPC) Cluster | A computing environment with multiple CPUs/GPUs to handle the intensive computational demands of training deep neural networks. |
Step-by-Step Procedure
Data Curation and Compartmental Model Definition:
- Collect patient data, including medical history, administered doses, and observed plasma concentration-time measurements [31].
- Define the structural PK model using a system of Ordinary Differential Equations (ODEs). For a two-compartment model with oral absorption and Michaelis-Menten elimination, the ODE system is [31]:
dC1/dt = k21*C2 - k12*C1 + ka*C3 - (Vm*C1)/(V1*(Km + C1))dC2/dt = k12*C1 - k21*C2dC3/dt = -ka*C3 - Here,
C1,C2, andC3represent drug concentrations in the central, peripheral, and absorption compartments, respectively. Parameters to be estimated are:k12,k21,ka,Vm,V1, andKm.
Neural Network Architecture and Training Setup:
- Define a neural network
û(t, θ)wheret(time) is the input andθrepresents the network's trainable parameters (weights and biases) as well as the six PK parameters of interest, which are treated as external trainable variables [31]. - Configure training hyperparameters as exemplified in the referenced study: use a dynamic learning rate starting at 1e-3, a dropout rate of 0.05, and employ the Adam optimizer [31].
- Define a neural network
Inverse Problem Optimization:
- The core of the inverse problem is to optimize the neural network parameters
θto minimize the difference between the model's predictions and the observed data. - The loss function to be minimized is the L2 error norm between the predicted and true parameter vectors [31]:
L2_error = ||θ_pred - θ_true||₂ - Automatic differentiation is used to efficiently compute the gradients of this loss function with respect to
θ, guiding the optimization process [31].
- The core of the inverse problem is to optimize the neural network parameters
Model Validation and Forward Simulation:
- Validate the predicted parameters (
θ_pred) by comparing the simulated concentration-time profile generated using these parameters against a hold-out validation dataset. - Once validated, use the estimated parameters in the forward ODE system to simulate concentration-time profiles for various proposed dose levels, enabling dose individualization [31].
- Validate the predicted parameters (
The following workflow diagram illustrates the complete process from data collection to clinical application.
Diagram 1: Inverse Modeling Workflow for PK Parameter Estimation.
Protocol 2: Development of a Machine Learning Model for Oral Bioavailability Prediction
This protocol outlines the construction of a predictive model for oral bioavailability, a critical parameter in the development of predictive bioavailability equations [32].
Research Reagent Solutions & Essential Materials
Table 3: Essential Materials for Oral Bioavailability Modeling
| Item | Function/Description |
|---|---|
| Curated OB Database | A database of drugs with experimentally determined oral bioavailability values and associated ADME characteristics. The referenced study used a database of 386 drugs [32]. |
| Chemoinformatics Software (e.g., ChemAxon) | Software used to standardize molecular structures (e.g., strip salts, aromatize) and calculate molecular descriptors or fingerprints [34]. |
| Morgan Fingerprints | A type of circular fingerprint that encodes the structure of a molecule into a bit string, serving as a numerical input for ML models [32]. |
| ML Software Environment (e.g., Python/R) | An environment with ML libraries such as scikit-learn, XGBoost, and CatBoost for model training and evaluation. |
Step-by-Step Procedure
Dataset Compilation and Preprocessing:
- Compile a dataset of compounds with known human oral bioavailability values from literature and in-house studies.
- Standardize molecular structures to ensure consistency. Generate molecular descriptors, with Morgan fingerprints being a common and effective choice for capturing structural features relevant to absorption [32].
Feature and Model Selection:
- Analyze the relationship between ADME characteristics (e.g., Molecular Weight, number of Rotatable Bonds) and OB. The referenced study found that smaller molecular weight and a higher number of rotatable bonds (ten or less) could potentially lead to higher OB [32].
- Split the dataset into training and test sets (e.g., 80/20 split).
- Train and compare multiple ML algorithms. The study by Yang et al. compared Random Forest, XGBoost, CatBoost, and LightGBM, finding that Random Forest performed the best based on metrics like Mean Squared Error (MSE) and R² score [32].
Model Application for Molecular Modification:
- To improve the OB of a lead compound, use chemical drawing software (e.g., ChemDraw) to generate structurally modified analogs (e.g., mono- or di-substituted derivatives).
- Convert the modified structures into the same format as the training set (e.g., Morgan fingerprints).
- Use the trained OB prediction model to screen these virtual compounds and prioritize those with predicted higher OB for synthesis and testing [32].
Quantitative Results from Literature
The following table summarizes quantitative performance metrics reported in recent studies for various ML-based PK prediction tasks.
Table 4: Performance Metrics of Machine Learning Models in Pharmacokinetics
| Prediction Task | Best-Performing Model | Performance Metric | Result | Key Influencing Features |
|---|---|---|---|---|
| Drug Clearance [33] | Gradient Boosting / CNN | R² (Accuracy) | > 0.96 | Identified via SHAP analysis; varies by drug. |
| Drug Clearance (Small Dataset) [33] | Multiple ML Models | R² | 0.75 | Age, weight (confirmed in pediatric-adult study). |
| Oral Bioavailability [32] | Random Forest | Accurate Prediction Range | 30% - 90% OB | Molecular Weight, Number of Rotatable Bonds. |
| Brain Bioavailability (Kpuu,brain,ss) [34] | Extreme Gradient Boosting (XGBoost) | Accuracy | 85.1% | Molecular structure descriptors. |
| Bioequivalence Risk [36] | Random Forest | Accuracy | 84% | Dose number at pH 3, tmax, effective permeability, bioavailability. |
Visualization of the AI-Assisted PopPK Modeling Workflow
Automated population PK (PopPK) modeling represents a significant advancement enabled by ML. The diagram below illustrates the automated workflow for identifying an optimal PopPK model structure.
Diagram 2: Automated PopPK Model Structure Identification.
The integration of machine learning into pharmacokinetics is transforming the field, moving it from traditional, population-averaged models towards dynamic, data-driven, and highly personalized approaches. Protocols for inverse parameter estimation, oral and brain bioavailability prediction, and automated PopPK modeling demonstrate the practical utility of ML in capturing complex relationships for improved prediction accuracy. These advancements directly support the development of more robust predictive bioavailability equations by enabling the integration of high-dimensional data, from molecular structure to patient physiology. As these techniques mature and are validated across broader chemical and patient spaces, they hold the promise of significantly accelerating drug development and optimizing therapeutic outcomes through precision dosing.
Hybrid LSTM Models for Bioactive Compound Extraction and Activity Prediction
The integration of advanced artificial intelligence with green extraction technologies represents a paradigm shift in the field of bioactive compound research. This approach is particularly relevant for developing predictive bioavailability equations, as the initial extraction efficiency and accurate activity prediction are foundational for understanding subsequent absorption and metabolism. Hybrid Long Short-Term Memory (LSTM) models have emerged as powerful tools for optimizing extraction parameters and predicting the multi-functional activities of bioactive compounds, enabling more efficient and targeted research aligned with the principles of green chemistry [37] [38]. These models help bridge the gap between raw material extraction and the forecasting of biological activity, which is a critical step in rational drug design and development.
Application Notes: Hybrid LSTM Model Architectures and Performance
LSTM-Based Models for Extraction Optimization
In the context of microwave-assisted extraction (MAE) using Natural Deep Eutectic Solvents (NADES), three hybrid LSTM models were recently developed and compared for predicting bioactive compound yields from carrots [37].
Table 1: Performance of Hybrid LSTM Models in Bioactive Compound Extraction Prediction
| Hybrid Model Name | Predicted Variables | Key Performance (R²) | Dominant Extraction Parameter |
|---|---|---|---|
| LSTM-Box Behnken | Total Phenolic Content (TPC), Total Flavonoid Content (TFC), DPPH● Scavenging Activity | > 0.99 [37] | Microwave Power (TPC), Temperature (TFC), Sample Mass (Antioxidant) |
| LSTM-Bayesian RSM (LSTM-BRSM) | TPC, TFC, DPPH● Scavenging Activity | Not explicitly stated | Sensitivity analysis reveals parameter dominance |
| LSTM-Response Surface Methodology (LSTM-RSM) | TPC, TFC, DPPH● Scavenging Activity | Not explicitly stated | Sensitivity analysis reveals parameter dominance |
The LSTM-Box Behnken model demonstrated superior predictive capability, achieving a coefficient of determination (R²) exceeding 0.99. A sensitivity analysis on the extraction parameters revealed that microwave power was the most influential factor for phenolic content, temperature was dominant for flavonoid extraction, and sample mass had the greatest effect on antioxidant activity [37]. This high modeling accuracy is critical for building reliable bioavailability prediction pipelines, as the initial concentration and profile of extracted compounds directly influence downstream absorption potential.
LSTM-Based Models for Bioactive Peptide Activity Prediction
For predicting the biological activities of bioactive peptides, a multi-task deep learning model called MPMABP was developed. This model stacks multiple Convolutional Neural Networks (CNNs) at different scales with a Bidirectional LSTM (Bi-LSTM) architecture [39].
Table 2: MPMABP Model for Multi-Activity Bioactive Peptide Prediction
| Model Component | Architecture/Function | Benefit |
|---|---|---|
| Multi-branch CNNs | Five parallel CNNs of different scales | Captures local sequence patterns and features of varying complexity [39] |
| Residual Network | Connections that bypass one or more layers | Preserves original sequence information and prevents information loss in deep networks [39] |
| Bidirectional LSTM (Bi-LSTM) | Processes peptide sequences in forward and reverse directions | Captures long-range dependencies and contextual information from both ends of the sequence [39] |
| Multi-label Output | Predicts multiple activities simultaneously | Recognizes that a single peptide can have multiple biological functions (e.g., anti-cancer and anti-hypertensive) [39] |
This hybrid CNN-Bi-LSTM approach has been shown to be superior to previous state-of-the-art methods, providing a more accurate tool for recognizing multi-functional peptides, which is essential for understanding their complex roles in metabolic processes and their potential therapeutic applications [39].
Experimental Protocols
Protocol: Optimization of MAE with NADES using LSTM-Box Behnken Modeling
Application: This protocol describes the procedure for extracting bioactive compounds from plant materials (e.g., carrots) using a synergistic combination of Microwave-Assisted Extraction (MAE) and Natural Deep Eutectic Solvents (NADES), with optimization via a hybrid LSTM-Box Behnken model [37].
Principle: NADES are green, biodegradable solvents that enhance the extraction of bioactive compounds. MAE uses microwave energy to rapidly heat the sample and solvent, increasing extraction efficiency and reducing time. The LSTM-Box Behnken hybrid model integrates the pattern-learning capability of neural networks with the structured experimental design of statistics to accurately predict optimal extraction conditions [37] [38].
Materials:
- Plant Material: Fresh or dried, finely ground carrot (Daucus carota) powder.
- NADES Components: Lactic acid, and other constituents like choline chloride, sugars, or organic acid (e.g., in a 1:2 molar ratio of ChCl to LA).
- Equipment: Microwave-assisted extraction system, analytical balance, centrifuge, vacuum filtration setup, spectrophotometer or HPLC for analysis.
- Reagents: Folin-Ciocalteu reagent (for TPC), Aluminum chloride (for TFC), DPPH● (1,1-diphenyl-2-picrylhydrazyl) radical solution (for antioxidant activity), Gallic acid, Quercetin, Trolox for standard curves.
Procedure:
- NADES Preparation: Prepare the NADES, for example, by mixing lactic acid with a hydrogen bond donor like glucose in a specific molar ratio (e.g., 1:2 lactic acid to glucose). Heat the mixture at 80°C with continuous stirring until a clear, homogeneous liquid forms [37].
- Experimental Design:
- Define the five independent variables and their ranges based on the Box-Behnken design: Microwave Power (400–600 W), Temperature (50–70 °C), Extraction Time (10–40 min), Sample Mass (0.5–1.0 g), and Lactic Acid Concentration in NADES (1–2 mol/L) [37].
- Perform the 40 experimental runs as per the design matrix.
- MAE Extraction:
- Accurately weigh the specified mass of carrot powder into the MAE vessel.
- Add the appropriate volume of the prepared NADES.
- Set the microwave power, temperature, and extraction time according to the experimental design.
- Conduct the extraction.
- Sample Work-up: After extraction, cool the mixture rapidly. Centrifuge the extracts and collect the supernatant. Filter the supernatant through a 0.45 μm membrane filter prior to analysis.
- Bioactive Compound Analysis:
- Total Phenolic Content (TPC): Use the Folin-Ciocalteu method. Express results as mg Gallic Acid Equivalents (GAE) per g dry weight [37].
- Total Flavonoid Content (TFC): Use the aluminum chloride colorimetric method. Express results as mg Quercetin Equivalents (QE) per g dry weight [37].
- Antioxidant Activity (DPPH● Assay): Measure the reduction of the DPPH● radical at 517 nm. Express results as % scavenging activity or mg Trolox Equivalents (TE) per g dry weight [37].
- Model Development and Optimization:
- Input the experimental data (5 parameters as inputs, TPC/TFC/DPPH as outputs) into the LSTM-Box Behnken hybrid model.
- Train the model to learn the complex non-linear relationships between process parameters and outputs.
- Use the trained model to predict the global optimum extraction conditions for maximizing the yield of target bioactive compounds.
Protocol: Predicting Multi-Activities of Bioactive Peptides using MPMABP (CNN-Bi-LSTM)
Application: This protocol outlines the use of the MPMABP deep learning model for predicting the multiple biological activities of bioactive peptides from their amino acid sequences [39].
Principle: The method leverages a combination of CNNs to extract local sequence patterns and motifs, and a Bi-LSTM to understand contextual, long-range dependencies within the peptide sequence. This hybrid architecture is particularly suited for sequence-based prediction tasks and outperforms models using single-type networks [39].
Materials:
- Data: Curated datasets of bioactive peptides with known activities from public databases such as BioPepDB, SATPdb, CancerPPD, AHTPDB, etc. [39].
- Software/Hardware: Python programming environment (e.g., TensorFlow or PyTorch deep learning frameworks), standard libraries for data processing (NumPy, Pandas). Access to a GPU is recommended for accelerated model training.
Procedure:
- Data Collection and Preprocessing:
- Collect peptide sequences and their corresponding multi-activity labels (e.g., Anti-cancer, Anti-diabetic, Anti-hypertensive, Anti-inflammatory).
- Clean the data by removing duplicates and sequences with ambiguous amino acids.
- Split the data into training, validation, and independent test sets (e.g., 80%, 10%, 10%).
- Feature Encoding:
- Convert the amino acid sequences into a numerical format that the model can process. Common methods include one-hot encoding or embedding layers.
- Model Construction (MPMABP Architecture):
- Input Layer: Configure for the input of peptide sequences.
- Multi-branch CNN Module: Construct five parallel CNN branches with different kernel sizes (e.g., 3, 5, 7, 9, 11) to capture features at multiple scales.
- Residual Connections: Integrate skip connections from the input of the CNN blocks to their outputs to preserve information and mitigate vanishing gradients.
- Bidirectional LSTM Layer: Feed the concatenated features from the CNNs into a Bi-LSTM layer to capture temporal dependencies in both forward and reverse directions of the sequence.
- Output Layer: Use a dense layer with a sigmoid activation function for each activity node to perform multi-label prediction.
- Model Training:
- Compile the model with a suitable optimizer (e.g., Adam) and a multi-label loss function (e.g., binary cross-entropy).
- Train the model on the training set, using the validation set to monitor for overfitting. Implement early stopping if the validation performance plateaus.
- Model Evaluation:
- Evaluate the trained model on the held-out test set.
- Use metrics appropriate for multi-label classification, such as accuracy, precision, recall, F1-score, and Hamming loss.
- Activity Prediction and Analysis:
- Use the trained model to predict the activities of novel peptide sequences.
- Analyze the model's attention or feature maps to potentially interpret which sequence regions contribute to specific activities.
The Scientist's Toolkit: Research Reagent Solutions
Table 3: Essential Reagents and Computational Tools for Bioactive Compound Research
| Item Name | Type/Class | Function and Application in Research |
|---|---|---|
| Natural Deep Eutectic Solvents (NADES) | Green Solvent | Eco-friendly alternative to organic solvents; enhances extraction efficiency and stability of bioactive compounds from natural sources [37]. |
| Lactic Acid-based NADES | Specific NADES Formulation | Serves as a hydrogen bond donor in NADES; effective for extracting phenolic compounds and flavonoids, as used in the carrot MAE study [37]. |
| DPPH● (1,1-diphenyl-2-picrylhydrazyl) | Chemical Reagent | Stable free radical used in spectrophotometric assays to evaluate the antioxidant activity of plant extracts and pure compounds [37]. |
| Folin-Ciocalteu Reagent | Chemical Reagent | Used in colorimetric assays for the quantification of total phenolic content in plant extracts and other samples [37]. |
| Bioactive Peptide Databases (e.g., BioPepDB, SATPdb) | Computational Data Resource | Curated repositories of known bioactive peptides; provide essential data for training and validating predictive machine learning models [39]. |
| Hybrid LSTM Models (e.g., LSTM-Box Behnken) | Computational Model | Combines neural networks with statistical design to model and optimize complex, non-linear extraction processes with high predictive accuracy [37]. |
| CNN-Bi-LSTM Architecture (e.g., MPMABP) | Computational Model | Deep learning framework for sequence-based prediction; ideal for multi-task learning like predicting multiple biological activities of peptides from their sequence [39]. |
Application Notes
Supercritical Fluid Technology in Pharmaceutical Processing
Supercritical fluid technology, particularly using supercritical carbon dioxide (scCO₂), presents an innovative and sustainable approach for pharmaceutical manufacturing. scCO₂ serves as a green alternative to conventional organic solvents due to its favorable properties: it is non-toxic, non-flammable, recyclable, and operates under mild critical conditions (31 °C, 73 bar). The unique combination of gas-like diffusivity and low viscosity with liquid-like solvent power allows for precise control over particle formation and drug delivery system design through simple adjustments in temperature and pressure [40] [41]. These characteristics make scCO₂ exceptionally suitable for processing thermolabile pharmaceutical compounds and have led to diverse applications across drug extraction, purification, crystal formation, and advanced drug delivery systems [42] [43].
The integration of scCO₂ processes with nanomedicine development addresses critical challenges in drug bioavailability, particularly for poorly water-soluble drugs (BCS class II and IV). By enabling the production of drug-loaded nanocarriers with enhanced solubility profiles and targeted release capabilities, supercritical fluid technology directly contributes to improved therapeutic outcomes. Furthermore, the compatibility of scCO₂ with bioavailability prediction models creates opportunities for rational design of nanomedicines with optimized absorption characteristics [43] [40].
Key Supercritical Processing Techniques for Nanomedicine
Table 1: Supercritical Fluid Techniques for Pharmaceutical Applications
| Technique | Role of scCO₂ | Mechanism | Key Applications | References |
|---|---|---|---|---|
| RESS (Rapid Expansion of Supercritical Solutions) | Solvent | Drug dissolution in scCO₂ followed by rapid depressurization through nozzle causing supersaturation and particle precipitation | Production of pure drug nanoparticles; "liquid" cisplatin formulation with enhanced solubility | [40] |
| SAS (Supercritical Antisolvent) | Antisolvent | Reduction of solvent power for pharmaceutical solutes dissolved in organic solvent upon scCO₂ contact, causing precipitation | Telmisartan nanoparticles; Drug-polymer composite particles (e.g., icariin/VCL, curcumin/PVP or β-CD) | [40] |
| SFEE (Supercritical Fluid Extraction of Emulsions) | Extraction solvent | Extraction of organic solvent from W/O/W emulsion containing pharmaceutical compounds, forming particle suspension | Protein encapsulation in PLGA microspheres (e.g., BSA) | [40] |
| SAA (Supercritical-Assisted Atomization) | Co-solute & pneumatic agent | scCO₂ dissolved in drug solution acts as spraying agent during atomization, forming fine particles | Drug-cyclodextrin complexes (e.g., Beclomethasone dipropionate/γ-CD) with leucine | [40] |
Advancing Bioavailability Prediction Through Supercritical Engineering
The development of predictive bioavailability equations for nanomedicines requires comprehensive understanding of critical material and process parameters. Supercritical fluid processing provides unique opportunities for precise control over these parameters, enabling systematic investigation of bioavailability determinants. Key factors influencing bioavailability that can be engineered through scCO₂ processes include:
- Particle size and morphology: Significantly impact dissolution rates, cellular uptake, and biodistribution [44] [40]
- Solid state and crystallinity: Affect stability and dissolution behavior; scCO₂ can produce amorphous or polymorphic forms [40]
- Drug-carrier interactions: Molecular dispersion within polymeric matrices or complexation with cyclodextrins [40]
- Surface properties: Hydrophobicity and charge influencing mucosal adhesion and cellular interactions [44]
Machine learning approaches are increasingly employed to predict drug solubility in scCO₂, which is fundamental to process design. The XGBoost algorithm has demonstrated exceptional performance in predicting drug solubility in scCO₂ (R² = 0.9984, RMSE = 0.0605), utilizing input parameters including temperature, pressure, critical properties, acentric factor, molecular weight, and melting point [43]. This predictive capability facilitates the rational design of supercritical processes for enhanced bioavailability.
Experimental Protocols
Protocol: Supercritical Antisolvent (SAS) Precipitation of Telmisartan Nanoparticles
Objective
To produce telmisartan nanoparticles with enhanced dissolution rate and oral bioavailability through supercritical antisolvent precipitation using mixed solvents [40].
Research Reagent Solutions
Table 2: Essential Materials for SAS Precipitation
| Category | Item | Specifications | Function | Rationale |
|---|---|---|---|---|
| Pharmaceutical | Telmisartan | Pharmaceutical grade | Active pharmaceutical ingredient | Model antihypertensive drug with solubility limitations |
| Solvents | Dichloromethane (DCM) | HPLC grade | Primary organic solvent | Good drug solubility, miscible with scCO₂ |
| Methanol | HPLC grade | Co-solvent | Modifies solvent power, controls particle morphology | |
| Supercritical Fluid | Carbon dioxide | Technical grade (>99.5%) | Antisolvent | Green processing medium, induces precipitation |
| Equipment | SAS apparatus | High-pressure vessel with nozzle, CO₂ pump, solution pump, back-pressure regulator | Process equipment | Maintains supercritical conditions, controls precipitation environment |
Methodology
Step 1: Preparation of Drug Solution
- Prepare telmisartan solution in DCM:methanol mixture (typical concentration: 10-50 mg/mL)
- Optimize solvent ratio (e.g., 70:30 to 90:10 DCM:methanol) to balance drug dissolution and precipitation kinetics
- Filter solution through 0.45 μm membrane to remove undissolved particles
Step 2: SAS Apparatus Setup
- Pre-heat SAS precipitation vessel to operational temperature (40-60°C)
- Pressurize vessel with scCO₂ to desired operational pressure (80-150 bar) using high-pressure pump
- Stabilize scCO₂ flow rate (typically 10-30 g/min) to maintain constant conditions
- Set back-pressure regulator to maintain system pressure
Step 3: Precipitation Process
- Pump drug solution through coaxial nozzle into precipitation vessel (typical flow rate: 1-5 mL/min)
- Maintain scCO₂-to-solution flow rate ratio >10:1 to ensure sufficient antisolvent power
- Allow particle collection for predetermined time (typically 30-120 minutes)
- Continue scCO₂ flow for 30-60 minutes after solution feeding to remove residual solvent
Step 4: Product Recovery
- Depressurize vessel slowly (1-5 bar/min) to prevent particle disruption
- Collect precipitated powder from vessel filter and walls
- Transfer product to desiccator for further drying if needed
Step 5: Characterization
- Analyze particle size and morphology by SEM/TEM
- Determine solid state by XRD and DSC
- Evaluate dissolution rate in physiologically relevant media
- Assess in vivo oral bioavailability in animal models
Protocol: Machine Learning-Assisted Solubility Prediction for scCO₂ Process Design
Objective
To develop machine learning models for predicting drug solubility in scCO₂ to guide supercritical process development and bioavailability enhancement [43].
Research Reagent Solutions
Table 3: Essential Components for Solubility Prediction
| Category | Item | Specifications | Function | Rationale |
|---|---|---|---|---|
| Data Sources | Experimental solubility data | 68 drugs, 1726 data points from literature | Training and validation dataset | Provides ground truth for model development |
| Software | Python/R environment | With scikit-learn, XGBoost, CatBoost, LightGBM libraries | ML algorithm implementation | Access to advanced machine learning capabilities |
| Computational Resources | Workstation/Server | Multi-core CPU, adequate RAM | Model training and validation | Handles computational intensity of ML algorithms |
Methodology
Step 1: Data Collection and Curation
- Compile experimental solubility data from high-quality literature sources
- Include key input features: temperature (T), pressure (P), critical temperature (Tc), critical pressure (Pc), density (ρ), acentric factor (ω), molecular weight (MW), and melting point (Tm)
- Perform data cleaning to handle missing values and outliers
- Apply statistical analysis to understand data distribution (min, max, mean, median, skewness, kurtosis)
Step 2: Data Preprocessing
- Split dataset into training (70-80%) and testing (20-30%) subsets
- Normalize or standardize features as required by specific algorithms
- Implement 10-fold cross-validation strategy for robust model evaluation
Step 3: Model Selection and Training
- Select appropriate ML algorithms: XGBoost, CatBoost, LightGBM, Random Forest
- Implement hyperparameter tuning using mean square error (MSE) minimization
- Train multiple models with identical training/test splits for fair comparison
- Monitor training progress to prevent overfitting
Step 4: Model Validation and Evaluation
- Calculate performance metrics: RMSE, R², AARD (Average Absolute Relative Deviation)
- Generate graphical analyses: predicted vs. experimental values, residual plots
- Define applicability domain using William's plot to identify outliers
- Select best-performing model based on comprehensive statistical assessment
Step 5: Implementation for Bioavailability Prediction
- Integrate solubility predictions with bioavailability assessment framework
- Correlate scCO₂ processing conditions with in vitro dissolution performance
- Develop predictive equations linking process parameters to bioavailability metrics
Analytical Framework for Bioavailability Prediction
Characterization Methods for Nanocarrier Bioavailability Assessment
Table 4: Key Characterization Techniques for Nanocarrier Bioavailability
| Characterization Category | Specific Techniques | Parameters Measured | Relevance to Bioavailability | References |
|---|---|---|---|---|
| Physicochemical Properties | Dynamic Light Scattering (DLS) | Particle size, PDI | Predicts biodistribution, cellular uptake, dissolution | [44] |
| Atomic Force Microscopy (AFM) | Particle morphology, surface topography | Influences tissue adhesion, cellular internalization | [44] | |
| Zeta potential measurement | Surface charge | Affects stability, mucoadhesion, and cellular interactions | [44] | |
| Solid State Characterization | X-ray Diffraction (XRD) | Crystallinity, polymorphism | Determines dissolution rate and physical stability | [40] |
| Differential Scanning Calorimetry (DSC) | Thermal properties, glass transition | Impacts storage stability and release characteristics | [40] | |
| In Vitro Performance | Dissolution testing | Drug release kinetics | Direct indicator of potential in vivo absorption | [40] |
| Cell culture models | Permeability, cytotoxicity | Predicts biological behavior and safety | [45] |
Integration with Bioavailability Prediction Framework
The development of predictive bioavailability equations for nanomedicines follows a structured framework adapted from nutrient bioavailability research [6] [4] [7]:
Step 1: Identify Critical Bioavailability Factors
- Determine key parameters influencing nanocarrier performance: particle size, surface properties, solid state, dissolution behavior
- Establish hierarchy of factor importance through preliminary experiments
- Define measurable indicators for each critical factor
Step 2: Literature Review and Data Synthesis
- Compile high-quality in vitro-in vivo correlation data from literature
- Identify consistent relationships between material properties and biological performance
- Establish preliminary mathematical relationships for bioavailability prediction
Step 3: Construct Predictive Equations
- Develop multivariate equations incorporating critical material and process parameters
- Integrate machine learning approaches for complex relationship modeling
- Validate equation consistency with established biological principles
Step 4: Experimental Validation
- Design targeted experiments to test prediction accuracy
- Refine equations based on validation results
- Establish applicability domains for robust implementation
This systematic approach enables researchers to transform supercritical processing parameters into predictive tools for bioavailability optimization, creating a rational framework for nanomedicine development that connects material science with pharmacological performance.
Optimization Strategies and Addressing Computational Challenges
Feature Selection and Hyperparameter Tuning with Advanced Algorithms
The development of robust predictive equations for nutrient bioavailability represents a significant challenge in nutritional science and drug development. The accuracy of these models hinges on two critical computational processes: feature selection, which identifies the most relevant biochemical and dietary factors affecting absorption, and hyperparameter tuning, which optimizes the algorithmic models used for prediction. Within high-dimensional biological datasets, where the number of potential predictors often vastly exceeds sample sizes, employing advanced methodologies for these processes is paramount for developing interpretable and accurate predictive equations that can inform nutritional recommendations and pharmaceutical development.
The Critical Role of Feature Selection in Bioavailability Prediction
Feature selection techniques are essential for managing high-dimensional data, which is ubiquitous in bioavailability research where numerous factors—from nutrient forms to host genetics—can influence absorption. These techniques enhance model interpretability, improve computational efficiency, and minimize overfitting by removing redundant or irrelevant features [46].
Comparative Performance of Feature Selection Methods
Experimental comparisons of feature selection methods provide crucial guidance for selecting appropriate techniques for bioavailability studies. The table below summarizes findings from a comprehensive evaluation of feature selection methods on two-class biomedical datasets:
Table 1: Comparison of Feature Selection Method Performance on Biomedical Data
| Feature Selection Method | Stability | Prediction Performance | Key Characteristics |
|---|---|---|---|
| Entropy-Based FS | Highest | Moderate | Excellent stability with data variations [47] |
| Minimum Redundancy Maximum Relevance (MRMR) | Moderate | Highest | Balances feature relevance and redundancy [47] |
| Bhattacharyya Distance | Moderate | Highest | Effective for two-class problems [47] |
| Univariate Methods | High | Good (HD data) | Simple, fast, outperform multivariate for high-dimensional data [47] |
| Multivariate Methods | Moderate | Good (complex data) | Slightly better for complex, smaller datasets [47] |
| Deep Learning & Graph-Based | N/A | 1.5% accuracy improvement | Captures complex feature relationships [46] |
A recent benchmark study on single-cell RNA sequencing data further emphasizes that feature selection methods significantly affect integration and querying performance, with highly variable feature selection proving particularly effective [48]. This has direct parallels to bioavailability research where identifying the most biologically informative features from high-dimensional omics data is crucial.
Advanced Feature Selection Protocol for Bioavailability Research
The following protocol outlines a structured approach for implementing advanced feature selection in bioavailability prediction studies:
Table 2: Protocol for Feature Selection in Bioavailability Prediction
| Step | Procedure | Technical Specifications | Bioavailability Application |
|---|---|---|---|
| 1. Problem Formulation | Define prediction target and feature space | Identify outcome variables (e.g., absorption fraction) and candidate features | Specify target nutrient, biological matrix, and host factors [6] |
| 2. Data Preprocessing | Clean and normalize dataset | Handle missing values, remove outliers, standardize distributions | Apply log transformation to skewed absorption data [49] |
| 3. Graph Representation | Model features as graph nodes | Calculate deep similarity measures between features | Represent nutrient-nutrient and nutrient-host interactions [46] |
| 4. Feature Clustering | Apply community detection | Use node centrality measures for cluster identification | Group biologically correlated features (e.g., co-factor dependencies) [46] |
| 5. Representative Selection | Select influential features | Choose central feature from each cluster using node centrality | Identify key biomarkers for absorption prediction [46] |
| 6. Validation | Assess selected feature subset | Use stability measures and prediction performance metrics | Validate with held-out human study data or external datasets [6] |
This protocol incorporates a novel deep learning-based approach that automatically determines both the number of clusters and the selected features, eliminating the need for manual parameter setting that plagues traditional methods [46].
Figure 1: Advanced Feature Selection Workflow. This diagram illustrates the integrated process for selecting biologically relevant features in bioavailability prediction.
Hyperparameter Optimization for Robust Predictive Models
Hyperparameters are configuration variables that control the behavior of machine learning algorithms, and their optimal selection determines the effectiveness of predictive models [50]. In bioavailability prediction, proper hyperparameter tuning ensures models generalize well to new nutrient compounds and population groups.
Hyperparameter Optimization Techniques
The three primary strategies for hyperparameter optimization each offer distinct advantages:
Table 3: Comparison of Hyperparameter Optimization Methods
| Method | Mechanism | Advantages | Limitations | Best for Bioavailability Applications |
|---|---|---|---|---|
| GridSearchCV | Exhaustive search over specified parameter values [51] | Guaranteed to find best combination in parameter space | Computationally expensive for large parameter spaces [51] | Small models with few hyperparameters |
| RandomizedSearchCV | Random sampling of parameter combinations [51] | More efficient for large parameter spaces; faster convergence | May miss optimal combinations in sparse regions [51] | Initial exploration of complex model spaces |
| Bayesian Optimization | Builds probabilistic model of parameter-performance relationship [51] | Learns from previous evaluations; more informed search | Complex implementation; requires careful setup [51] | Resource-intensive final model tuning |
Bayesian optimization approaches hyperparameter tuning as a mathematical optimization problem, building a probabilistic model (surrogate function) that predicts performance based on hyperparameters, then updating this model after each evaluation to choose the next promising parameter set [51].
Integrated Hyperparameter Tuning Protocol
This protocol provides a systematic approach to hyperparameter optimization for bioavailability prediction models:
Table 4: Protocol for Hyperparameter Tuning in Bioavailability Modeling
| Step | Procedure | Technical Specifications | Bioavailability Application Example |
|---|---|---|---|
| 1. Define Search Space | Identify critical hyperparameters and ranges | Based on algorithm requirements and prior knowledge | For random forest: nestimators, maxdepth, minsamplesleaf [51] |
| 2. Select Optimization Method | Choose appropriate search strategy | Consider computational resources and parameter space size | Start with RandomizedSearchCV for initial exploration [51] |
| 3. Implement Cross-Validation | Establish robust validation scheme | Use k-fold cross-validation (typically k=5 or k=10) | Stratified k-fold to maintain class balance in absorption categories [51] |
| 4. Execute Search | Run optimization procedure | Set appropriate number of iterations or convergence criteria | 100-500 iterations for complex models [51] |
| 5. Validate Performance | Assess best parameters on held-out test set | Compute multiple performance metrics beyond accuracy | Use R², MAE, and RMSE for continuous absorption predictions [6] |
| 6. Final Model Training | Train production model with optimized parameters | Use entire training set with best hyperparameters | Develop final bioavailability prediction equation [6] |
Figure 2: Hyperparameter Optimization Process. This workflow outlines the systematic approach to optimizing model parameters for bioavailability prediction.
Integrated Framework for Bioavailability Equation Development
Combining advanced feature selection and hyperparameter tuning creates a robust framework for developing predictive bioavailability equations. This integrated approach aligns with the structured methodology outlined in recent nutritional science research, which emphasizes identifying key influencing factors, comprehensive literature reviews, equation construction, and validation [6].
Case Study: Experimental Validation of Integrated Approach
Experimental research demonstrates the effectiveness of combining feature selection with model optimization. One study on logistic regression with L1 and L2 regularization showed that synthesizing findings from both approaches—selecting only features identified by both methods—achieved comparable accuracy with decision trees and random forests despite a 72% reduction in feature set size [49]. This efficiency is particularly valuable in bioavailability research where data collection is often costly and time-consuming.
Table 5: Research Reagent Solutions for Computational Bioavailability Research
| Tool/Resource | Function | Application in Bioavailability Research |
|---|---|---|
| Deep Similarity Measures | Calculate complex feature relationships [46] | Identify nutrient interactions affecting absorption |
| Community Detection Algorithms | Group features into functional clusters [46] | Discover biologically related factor groups |
| Node Centrality Measures | Identify influential features within clusters [46] | Select key predictors for bioavailability equations |
| Cross-Validation Frameworks | Validate model performance robustly [51] | Ensure generalizable absorption predictions |
| Bayesian Optimization | Efficient hyperparameter search [51] | Optimize complex bioavailability models |
| Stability Metrics | Assess feature selection consistency [47] | Verify reliability of selected nutrient factors |
The integration of advanced feature selection and hyperparameter tuning methodologies provides a powerful foundation for developing accurate predictive equations for nutrient bioavailability. The structured protocols and comparative analyses presented here offer researchers a clear pathway for implementing these techniques in their bioavailability research. As the field progresses, future work should focus on adapting emerging graph neural networks and temporal modeling approaches to better capture the dynamic nature of nutrient absorption and utilization [46]. By systematically applying these advanced computational methods, researchers can develop more reliable, interpretable predictive models that ultimately enhance nutritional recommendations and pharmaceutical development.
Addressing Data Limitations and Skewed Distributions in Bioavailability Datasets
The development of robust predictive equations for nutrient and drug bioavailability is fundamentally constrained by the quality and characteristics of the underlying experimental data. Research consistently demonstrates that data heterogeneity, distributional misalignments, and skewed parameter distributions pose critical challenges for machine learning models and quantitative structure-activity relationship (QSAR) approaches, often compromising predictive accuracy and generalizability [52]. In bioavailability research, these limitations are particularly pronounced due to variations in experimental conditions, biological systems, and methodological approaches across studies.
The integration of publicly available datasets offers the potential to increase sample sizes and expand chemical space coverage, potentially enhancing predictive accuracy and model generalizability [52]. However, systematic analysis of public absorption, distribution, metabolism, and excretion (ADME) datasets has uncovered substantial distributional misalignments and annotation discrepancies between benchmark and gold-standard sources [52]. These dataset discrepancies, arising from differences in experimental conditions, chemical space coverage, and biological variability, introduce noise that ultimately degrades model performance, highlighting the necessity of rigorous data consistency assessment prior to modeling.
Quantitative Characterization of Bioavailability Data Distributions
Table 1: Common Data Challenges in Bioavailability and Pharmacokinetic Datasets
| Data Challenge | Manifestation in Bioavailability Data | Impact on Predictive Modeling |
|---|---|---|
| Distribution Skewness | Oral bioavailability (F%) values often cluster at 0% and 100% with fewer intermediate values [12] | Models may correctly predict majority classes while displaying poor performance for intermediate values |
| Data Heterogeneity | Significant misalignments between gold-standard and benchmark sources [52] | Introduces noise and decreases predictive performance when datasets are aggregated |
| Value Range Issues | Volume of distribution (VDss) values spanning from 0.035 L·kg⁻¹ to 700 L·kg⁻¹ [12] | Requires logarithmic transformation to address skewness and facilitate model convergence |
| Experimental Discrepancies | Inconsistent property annotations between data sources [52] | Undermines model reliability and generalizability to new chemical entities |
Table 2: Statistical Characteristics of Oral Bioavailability Datasets
| Parameter | Typical Range | Data Transformation Requirements | Modeling Considerations |
|---|---|---|---|
| Value Range | 0% to 100% [12] | Often requires classification approaches with thresholds (e.g., 50% for binary classification) | Regression models struggle with clustered values at extremes |
| Distribution Pattern | Peaks at 0% and 100% bioavailability with sparse intermediate values [12] | Multiclass classification with 30-60% thresholds for intermediate values | Bias toward correct prediction of majority classes |
| Dataset Size | 1,200-1,700 compounds in curated sets [12] | Sufficient for model training but requires careful validation | Expanded chemical space coverage improves model generalizability |
Experimental Protocols for Data Quality Assessment
Protocol 1: Systematic Data Consistency Assessment
Purpose: To identify distributional misalignments, outliers, and inconsistencies across multiple bioavailability data sources prior to model development.
Materials and Equipment:
- AssayInspector software package (Python-based)
- Multiple bioavailability datasets (e.g., Obach et al., Lombardo et al., Fan et al.)
- Computational resources for chemical descriptor calculation (RDKit)
- Statistical analysis environment (SciPy, Python)
Procedure:
- Data Compilation: Gather bioavailability data from at least three independent sources with documented experimental methodologies.
- Descriptor Calculation: Compute traditional chemical descriptors (ECFP4 fingerprints, 1D/2D descriptors) using RDKit v2022.09.5 or equivalent.
- Statistical Comparison: Perform pairwise two-sample Kolmogorov-Smirnov tests for regression tasks and Chi-square tests for classification tasks to identify significantly different endpoint distributions.
- Similarity Analysis: Calculate within- and between-source feature similarity values in a one-vs-other setting using Tanimoto Coefficient for fingerprints and standardized Euclidean distance for descriptors.
- Visualization Generation: Create property distribution plots, chemical space visualizations using UMAP, and dataset intersection diagrams.
- Diagnostic Reporting: Generate an insight report identifying dissimilar datasets, conflicting annotations, divergent datasets with low molecular overlap, and redundant datasets with high proportions of shared molecules.
Quality Control: Validate identified discrepancies against original experimental methodologies and conditions. Apply consistent data cleaning protocols across all datasets.
Protocol 2: Handling Skewed Distributions in Bioavailability Parameters
Purpose: To address the inherent skewness in bioavailability and pharmacokinetic parameters through appropriate data transformation and modeling strategies.
Materials and Equipment:
- Curated dataset of bioavailability measurements
- Statistical software package (R, Python with SciPy/pandas)
- Machine learning frameworks (scikit-learn, CatBoost, Random Forest)
Procedure:
- Distribution Analysis:
- Plot frequency distributions for all bioavailability parameters
- Calculate skewness and kurtosis statistics
- Identify natural clustering patterns (e.g., peaks at 0% and 100% for F%)
Data Transformation:
- For volume of distribution (VDss): Apply natural logarithmic transformation to address positive skewness
- For oral bioavailability (F%): Implement classification approaches with appropriate thresholds (20%/50%/80% or 30%/60% for multiclass)
- For continuous F% prediction: Apply specialized regression techniques robust to bimodal distributions
Model Selection and Training:
- For regression tasks: Evaluate CatBoost, Random Forest, and neural network architectures
- For classification tasks: Implement binary (50% threshold) and multiclass (30-60% thresholds) approaches
- Apply rigorous validation using hold-out test sets and cross-validation
Performance Evaluation:
- For regression: Use Q2F3, geometric mean fold error (GMFE), and correlation coefficients
- For classification: Assess accuracy, precision, recall, and F1-score across classes
- Specifically evaluate performance on intermediate bioavailability values (20-80%)
Data Transformation Workflow for Skewed Bioavailability Parameters
Visualization Framework for Data Quality Assessment
Data Consistency Assessment Workflow
Research Reagent Solutions for Bioavailability Studies
Table 3: Essential Research Materials and Computational Tools for Bioavailability Data Analysis
| Research Reagent/Tool | Function/Purpose | Application Context |
|---|---|---|
| AssayInspector Package | Data consistency assessment, outlier detection, batch effect identification [52] | Systematic evaluation of multiple bioavailability datasets prior to aggregation |
| RDKit (v2022.09.5) | Chemical descriptor calculation (ECFP4 fingerprints, 1D/2D descriptors) [52] | Molecular representation for similarity analysis and chemical space visualization |
| UMAP Algorithm | Dimensionality reduction for chemical space visualization [52] | Assessment of dataset coverage and applicability domain in property space |
| ColorBrewer Palettes | Accessible color schemes for data visualization [53] | Creation of inclusive visualizations compliant with WCAG contrast standards |
| Grape Seed Proanthocyanidin Extract (GSPE) | Standardized bioactive compound for bioavailability studies [54] | Experimental investigation of factors affecting phenolic compound bioavailability |
| Fischer 344 Rats | In vivo model for bioavailability and pharmacokinetic studies [54] | Controlled assessment of circannual rhythms and dietary effects on bioavailability |
| VSURF Algorithm | Variable selection for QSAR modeling [12] | Identification of most relevant molecular descriptors from large feature sets |
Implementation Framework for Predictive Modeling
The integration of systematic data assessment protocols enables more reliable development of predictive bioavailability equations. Research demonstrates that naive integration of heterogeneous datasets often degrades model performance despite increased sample sizes, emphasizing the critical importance of the pre-modeling data quality assessment phase [52]. The application of this comprehensive framework supports the creation of more robust, generalizable predictive models for nutrient and drug bioavailability.
Successful implementation requires domain-specific adaptations, particularly regarding threshold selection for classification approaches and transformation methods for specific bioavailability parameters. For oral bioavailability, the inherent clustering at extreme values (0% and 100%) may necessitate specialized modeling approaches that account for this bimodal distribution pattern, while volume of distribution parameters typically benefit from logarithmic transformation due to their positive skewness [12]. Through rigorous application of these protocols, researchers can develop predictive equations that more accurately reflect the complex biological processes governing bioavailability.
Ensemble Methods and Hybrid Modeling for Enhanced Predictive Performance
The accurate prediction of bioavailability remains a critical challenge in drug discovery and nutritional sciences. Ensemble methods and hybrid modeling represent two powerful computational paradigms that significantly enhance predictive performance by integrating multiple models or combining mechanistic with data-driven approaches. These techniques mitigate the limitations of individual models, leading to more robust, accurate, and generalizable predictions for complex biological properties like oral bioavailability and volume of distribution. This document provides application notes and detailed protocols for implementing these advanced modeling strategies within the context of developing predictive bioavailability equations.
Recent advances in machine learning have established a new benchmark for predicting pharmacokinetic (PK) parameters. The table below summarizes the performance of various modeling approaches as reported in recent literature, providing a baseline for expected outcomes.
Table 1: Performance Metrics of Advanced Predictive Modeling Approaches for Pharmacokinetic Parameters
| Modeling Approach | Reported Metric | Performance Value | Application Context | Reference |
|---|---|---|---|---|
| Stacking Ensemble | R² | 0.92 | General PK Parameter Prediction | [55] |
| Stacking Ensemble | MAE | 0.062 | General PK Parameter Prediction | [55] |
| Graph Neural Network (GNN) | R² | 0.90 | General PK Parameter Prediction | [55] |
| Transformer Model | R² | 0.89 | General PK Parameter Prediction | [55] |
| R-CatBoost (Regression) | Q²F₃ | 0.34 | Oral Bioavailability (F%) | [56] |
| R-RF (Regression) | GMFE | 2.35 | Volume of Distribution (VDss) | [56] |
| AdaBoost KNN | High R², Low RMSE | Notable Performance | Nanoparticle Biodistribution | [57] |
Protocol 1: Developing a Stacking Ensemble for Bioavailability Prediction
This protocol outlines the steps for creating a stacking ensemble model to predict oral bioavailability (F%), leveraging insights from high-performing AI models in pharmacokinetics [55].
Reagent and Computational Solutions
Table 2: Essential Research Reagents and Computational Tools
| Item Name | Specification / Function | Application Note |
|---|---|---|
| Chemical Dataset | Curated set of ~1,700 chemicals with experimental F% [56]. | Ensure structural diversity and a wide range of F% values for robust training. |
| Mordred Descriptor Calculator | Open-source software for calculating 1,826+ 2D and 3D molecular descriptors. | Used for featurization of chemical structures. |
| VSURF Algorithm | Variable Selection Using Random Forests for identifying the most relevant molecular descriptors. | Improves model interpretability and reduces overfitting. |
| Base Learners (Heterogeneous) | Random Forest, XGBoost, Support Vector Machines, Neural Networks. | Use diverse algorithms to capture different patterns in the data. |
| Meta-Learner | A linear model (e.g., Logistic Regression) or another simple, robust algorithm. | Learns to optimally combine the predictions of the base learners. |
| Bayesian Optimization Framework | Automated hyperparameter tuning for both base learners and the meta-learner. | Crucial for achieving reported high-performance metrics (e.g., R² of 0.92) [55]. |
Experimental Workflow and Methodology
The following diagram illustrates the sequential workflow for building the stacking ensemble model.
Procedure Details:
- Data Curation: Collect and curate a dataset of chemicals with experimentally measured oral bioavailability (F%). A large, diverse dataset (e.g., n > 1,700) is critical for success [56]. Split the data into training, validation, and hold-out test sets (e.g., 70/15/15).
- Molecular Featurization: For each chemical structure (provided as SMILES strings), calculate a comprehensive set of molecular descriptors (e.g., using Mordred) and/or generate molecular fingerprints [56].
- Feature Selection: Apply the VSURF algorithm or similar feature selection techniques to the training set to identify the most predictive molecular descriptors. This step reduces dimensionality and mitigates overfitting, resulting in a more robust model [56].
- Train Base Learners: On the training set, train multiple, heterogeneous machine learning algorithms (e.g., Random Forest, XGBoost) as base learners. Use Bayesian optimization to tune the hyperparameters of each model independently [55].
- Generate Level-1 Predictions: Use the trained base learners to generate predictions (Level-1 data) for the validation set. It is critical that this data was not used to train the base learners.
- Train Meta-Learner: The Level-1 predictions from the base learners now become the input features (meta-features) for training the meta-learner. The true target values (F%) from the validation set are used as the output for this step.
- Final Ensemble Model: The combination of the trained base learners and the trained meta-learner constitutes the final stacking ensemble model.
- Validation & Deployment: Evaluate the final model's performance on the hold-out test set using relevant metrics (Q²F₃, GMFE, R², MAE). Deploy the model for the prediction of new chemical entities.
Protocol 2: Implementing a Hybrid Mechanistic-AI Model for Tissue Distribution
This protocol describes a hybrid approach that integrates a machine learning-optimized parameter with a mechanistic physiological model to predict tissue-plasma partition coefficients (Kp) and volume of distribution at steady state (VDss) [58].
Reagent and Computational Solutions
Table 3: Essential Research Reagents and Computational Tools for Hybrid Modeling
| Item Name | Specification / Function | Application Note |
|---|---|---|
| PBPK Modeling Platform | Software capable of mechanistic, physiologically-based pharmacokinetic modeling (e.g., MATLAB, Simbiology, PK-Sim). | Provides the mechanistic framework for the hybrid model. |
| Rodgers & Rowland / Poulin & Theil Equations | Mechanistic equations predicting Kp values based on compound lipophilicity (logP) and plasma protein binding. | Core of the distribution model; can be directly optimized or used as a prior. |
| In Vivo PK Dataset | Plasma concentration-time profiles and, if available, tissue concentration data for diverse compounds. | Used for training and validating the ML optimizer. |
| Cloud Computing Platform (e.g., AWS) | For parallelizing thousands of optimization simulations in a feasible time (e.g., <5 hours) [58]. | Essential for practical implementation of the computational workflow. |
| Gradient-Based Optimizer or Bayesian Optimizer | An algorithm designed to find the parameter value that minimizes the error between model output and experimental data. | The "AI" component that refines the mechanistic parameter. |
Experimental Workflow and Methodology
The hybrid modeling approach integrates a machine learning optimizer directly into a mechanistic simulation framework to enhance its predictive power for tissue distribution.
Procedure Details:
- Define Mechanistic Model: Construct a PBPK model that includes mechanistic equations (e.g., Rodgers & Rowland) to calculate tissue-plasma partition coefficients (Kp) based on a compound's physicochemical properties [58].
- Identify Target Parameter: Select a key physicochemical parameter within the mechanistic equations, such as the lipophilicity descriptor (logP), as the target for machine learning optimization. The in vivo relevance of this parameter is often uncertain [58].
- Set Up Optimizer: Configure a gradient-based or Bayesian optimizer. Its objective is to find the value for the target parameter (e.g., logP) that, when used in the PBPK model, results in simulated PK outputs (e.g., VDss, plasma concentration profile) that best match experimental in vivo data.
- Run Parallel Simulations: Execute the PBPK model thousands of times with different values of the target parameter proposed by the optimizer. This is computationally intensive and requires cloud parallelization for efficiency [58].
- Compare Simulation Output: For each simulation, calculate the error (e.g., geometric mean fold-error) between the simulated PK outputs and the actual in vivo data.
- Iterate Optimization: The optimizer uses the error signal to intelligently propose a new value for the target parameter, aiming to minimize the error in the next iteration.
- Check for Convergence: The loop (steps 4-6) continues until the error is minimized and cannot be improved further, indicating convergence.
- Final Hybrid Model: The result is a hybrid model where a key mechanistic parameter has been "corrected" by ML optimization against in vivo data, leading to highly accurate predictions of compound distribution (e.g., GMFE of 1.50-1.63 for PK outputs) [58]. This optimized model can then be applied to predict the behavior of new compounds.
Application Notes and Data Interpretation
Critical Success Factors
- Data Quality and Curation: The performance of both ensemble and hybrid models is profoundly dependent on the quality, size, and chemical diversity of the training data. The use of large, well-curated datasets (n > 1,000 compounds) is a common factor in high-performing models [56] [55].
- Hyperparameter Optimization: The superior performance of stacking ensembles (R² of 0.92) is achieved through rigorous Bayesian optimization of hyperparameters. This step should not be overlooked [55].
- Interpretability vs. Performance Trade-off: While hybrid models offer greater mechanistic interpretability, pure AI ensembles may achieve higher predictive accuracy for specific endpoints. The choice depends on the research goal: molecular insight versus predictive power.
Application to Endocrine-Disrupting Chemicals (EDCs)
These protocols can be directly applied to prioritize chemicals for risk assessment. For example, the best QSAR models for oral bioavailability and VDss can be used to screen potential EDCs, highlighting chemicals with a high probability of high bioavailability and extensive tissue distribution, which may pose a greater risk to human health [56].
Optimizing Extraction and Formulation Parameters for Maximum Bioavailability
Bioavailability, defined as the proportion of an administered active substance that reaches systemic circulation unaltered and becomes available at the target site, serves as a critical pharmacokinetic property determining therapeutic efficacy [59]. For any active pharmaceutical ingredient (API) or bioactive compound, achieving sufficient bioavailability is essential for producing the desired pharmacological effect, as a drug can only produce the expected outcome if proper concentration levels are achieved at the desired point in the body [59]. The complex interplay between extraction methodologies, formulation strategies, and physiological factors ultimately dictates the success of drug development and nutraceutical applications.
The challenges in bioavailability optimization are particularly pronounced in contemporary drug development, where more than 80% of new chemical entities (NCEs) belong to BCS Class II and IV, characterized by poor solubility and/or permeability [60]. This comprehensive protocol outlines a systematic approach to optimizing extraction and formulation parameters, framed within the context of developing predictive bioavailability equations as part of advanced pharmaceutical and nutraceutical research.
Theoretical Framework and Predictive Modeling
Foundational Concepts in Bioavailability Assessment
Bioavailability measurements provide essential parameters for assessing absorption efficiency and developing predictive models. Absolute bioavailability determines the percentage of an active substance entering the bloodstream after administration compared to an intravenous dose, while relative bioavailability compares the bioavailability between different dosage forms of the same drug [59]. Key parameters include the time to reach maximum concentration (tmax), which affects the rate of drug action, and the area under the curve (AUC), which measures total exposure of the body to an active substance over time [59].
The ADME processes (Absorption, Distribution, Metabolism, and Elimination) fundamentally govern drug bioavailability [59]. Absorption involves the passage of a drug from the administration site into the bloodstream, influenced by dosage form, presence of food, environmental pH, and interactions with other substances [59]. Distribution encompasses the spread of active compounds throughout the body, affected by vascular resistance, distribution volume, drug-protein binding, and tissue barrier permeability [59].
Framework for Predictive Bioavailability Equations
Developing accurate predictive equations for bioavailability requires a structured methodology. A proposed four-step framework provides a systematic approach [6] [4]:
- Step 1: Identify key factors influencing nutrient or bioactive compound bioavailability
- Step 2: Conduct comprehensive literature reviews of high-quality human studies
- Step 3: Construct predictive equations based on these insights
- Step 4: Validate equations to facilitate translation and application
This framework emphasizes the importance of moving beyond total nutrient content estimates to incorporate the fraction absorbed and utilized by the body, addressing significant data limitations and evidence gaps in current bioavailability prediction models [6] [4].
Table 1: Key Parameters for Bioavailability Assessment
| Parameter | Symbol | Definition | Significance in Prediction Models |
|---|---|---|---|
| Absolute Bioavailability | F | Percentage of active substance reaching systemic circulation compared to IV dose | Measures absorption efficiency |
| Relative Bioavailability | Frel | Ratio comparing bioavailability of two dosage forms | Formulation optimization |
| Time to Maximum Concentration | tmax | Time for active ingredient to reach highest blood concentration | Impacts onset of action |
| Area Under the Curve | AUC | Total exposure to active substance over time | Measures total absorption |
| Elimination Half-Life | t½ | Time for drug concentration to reduce by half | Determines dosing frequency |
Extraction Optimization Protocols
Systematic Optimization Using Response Surface Methodology
Extraction optimization represents the foundational step in ensuring sufficient bioactive compound yield for subsequent formulation. Response Surface Methodology (RSM) has emerged as a powerful statistical tool for optimizing extraction conditions while minimizing resource use [61]. By modeling variables such as temperature, time, and solvent concentration simultaneously, RSM provides valuable insights into the factor interactions critical for efficient extraction [61].
A recent study on antioxidant extraction from seaweeds demonstrated the application of RSM for solid-liquid extraction (SLE) optimization, focusing on three key parameters: temperature, biomass-to-solvent ratio, and time [61]. This approach allowed identification of optimal conditions and establishment of predictive models applicable to industrial-scale extraction processes [61]. The robustness of RSM stems from its ability to reduce experimental trials while ensuring reliable outcomes through systematic evaluation of variable effects [61].
Advanced Extraction Techniques
While conventional methods like SLE remain valuable for their simplicity, advanced extraction techniques offer improved efficiency and yield for challenging compounds [61]. Subcritical water extraction (SWE) operates at elevated temperatures (140-190°C), utilizing water's enhanced solubilization properties under pressure to extract compounds with higher efficiency, as demonstrated by SWE at 190°C achieving an antioxidant potency composite index (APCI) of 46.27% for E. bicyclis seaweed [61].
Ultrasound-assisted extraction (UAE) applies high-frequency sound waves to disrupt cell walls, enhancing compound release with extraction times typically ranging from 10-20 minutes [61]. Notably, UAE has been recognized as the most sustainable method in recent assessments, achieving the highest AGREEprep score (0.69) for environmental sustainability [61].
For compounds with particular sensitivity to traditional methods, supercritical fluid extraction (SFE) utilizing carbon dioxide offers an eco-friendly alternative with fewer toxic by-products, though challenges remain in scaling these processes for industrial applications [62]. Similarly, pressurized liquid extraction (PLE) has demonstrated superior yields of phenolic content and antioxidant activity compared to conventional methods [61].
Table 2: Comparison of Extraction Techniques for Bioactive Compounds
| Extraction Method | Optimal Conditions | Extraction Time | Relative Yield | Sustainability Score |
|---|---|---|---|---|
| Solid-Liquid Extraction (SLE) | Optimized via RSM for each compound | 30 min - 24 hours | Baseline | 0.45 |
| Ultrasound-Assisted Extraction (UAE) | 10-20 minutes | 10-20 minutes | 1.2-1.5x SLE | 0.69 |
| Subcritical Water Extraction (SWE) | 140-190°C | 15-30 minutes | 1.5-2.0x SLE | 0.52 |
| Supercritical Fluid Extraction (SFE) | CO₂, 30-50°C, high pressure | 30-90 minutes | 1.3-1.8x SLE | 0.61 |
| Pressurized Liquid Extraction (PLE) | High pressure, elevated temperature | 15-45 minutes | 1.4-1.9x SLE | 0.58 |
Case Study: Xanthone Extraction Optimization
Xanthones, a class of polyphenolic bioactive compounds with demonstrated anticancer, anti-inflammatory, and antioxidant effects, present particular extraction challenges due to their poor aqueous solubility and limited bioavailability [62]. These compounds are classified into six subtypes: simple oxygenated xanthones, prenylated xanthones (e.g., α-mangostin, gambogic acid), xanthone glycosides (e.g., mangiferin), bisxanthones, xanthonolignoids, and miscellaneous xanthones, each with distinct physicochemical properties affecting extraction behavior [62].
Traditional solvent extraction methods for xanthones are often time-consuming and require large amounts of organic solvents, producing significant waste with negative environmental impacts [62]. Advanced techniques like supercritical CO₂ extraction have demonstrated superior performance for xanthone recovery from plant sources such as mangosteen pericarp, while aligning with green chemistry principles [62]. The optimization of extraction parameters for specific xanthone subtypes enables researchers to establish predictive models for yield optimization, forming the foundation for subsequent bioavailability enhancement.
Formulation Strategies for Enhanced Bioavailability
Nanotechnology-Based Delivery Systems
Nanotechnology has revolutionized bioavailability enhancement for poorly soluble compounds through the development of advanced nanoscale carriers. Lipid nanoparticles, polymeric nanoparticles, nanoemulsions, and nanomicelles have demonstrated significant improvements in solubility, stability, and cellular uptake of challenging bioactive compounds [62]. In the case of xanthones, formulations such as α-mangostin nanomicelles and mangiferin-loaded nanoemulsions have shown potent anticancer activity in preclinical models by dramatically improving compound bioavailability [62].
The manufacturing processes for these systems have advanced considerably, with techniques like microfluidic mixing platforms enabling fine control of particle size and drug encapsulation while providing a seamless path to scaling up production for lipid nanoparticles [63]. These advances allow nanomedicine therapies to be produced in high volumes without compromising quality, addressing previous challenges in reproducible, large-scale nanoparticle formulation [63].
Advanced Controlled-Release and Delivery Systems
Advanced controlled-release systems, including long-acting injectables and implantable drug depots, maintain therapeutic drug levels over extended periods (weeks or months), significantly improving patient adherence and outcomes [63]. These technologies are particularly valuable for chronic conditions, ensuring consistent treatment with minimal patient intervention [63]. The manufacturing complexity of these formulations requires sophisticated processes to ensure reliability and scalability, with industry teams continuously developing next-generation production methods [63].
Self-Emulsifying Drug Delivery Systems (SEDDS) have emerged as a promising strategy for overcoming solubility challenges with lipophilic drugs [64]. These systems incorporate drug molecules into mixtures of oils, surfactants, and cosolvents, maintaining drugs in solubilized form within gastrointestinal fluids and protecting peptide drugs from enzymatic degradation [64]. Their ability to facilitate formation of stable emulsions at the target site enhances drug absorption, with additional applications in traversing the blood-brain barrier for neurological disorders [64].
Amorphous Solid Dispersions and Lipid-Based Systems
Amorphous Solid Dispersions (ASD) have become a primary approach for addressing solubility issues with poorly soluble APIs, particularly for compounds limited by their solubility (DCS IIa) [60]. The selection of appropriate polymer and lipid combinations is critical for achieving high rates of success in API miscibility [60]. Systematic approaches using platforms like Solution Engine 2.0 calculate solubility parameters for APIs and compare them to ASD polymers and lipids to identify combinations with the highest predicted miscibility, requiring only 100-200mg of API for screening [60].
For compounds with permeability issues (BCS Class III), lipid-based formulations including lipid solutions, suspensions, emulsions, and particles can significantly improve permeability [60]. When poor bioavailability results from both solubility and permeability issues (Class IV), combined strategies are necessary, while physiological barriers such as first-pass metabolism may require lymphatic delivery and/or metabolic enzyme inhibitors [60].
Diagram 1: Formulation Strategies for Bioavailability Enhancement. This workflow illustrates the relationship between formulation approaches and their mechanisms for improving bioavailability.
Integrated Experimental Protocols
Protocol 1: Systematic Extraction Optimization Using RSM
Objective: To optimize extraction parameters for maximum yield of bioactive compounds from natural sources.
Materials and Equipment:
- Raw plant material (e.g., mangosteen pericarp for xanthones)
- Extraction solvents (ethanol, methanol, water, supercritical CO₂)
- Extraction apparatus (Soxhlet, ultrasound bath, supercritical fluid extractor)
- Temperature-controlled agitation system
- Filtration and concentration equipment
- Analytical instruments (HPLC, spectrophotometer)
Procedure:
- Experimental Design: Implement a Box-Behnken or central composite design with three key factors: temperature (X₁), biomass-to-solvent ratio (X₂), and extraction time (X₃).
- Sample Preparation: Dry and grind raw material to uniform particle size (e.g., 0.5-1.0mm).
- Extraction Trials: Conduct extractions according to experimental design matrix.
- Filtration and Concentration: Filter extracts and remove solvents under reduced pressure.
- Yield Determination: Precisely weigh extracted compounds and calculate percentage yield.
- Bioactivity Assessment: Analyze antioxidant activity (FRAP, ABTS) and total phenolic content.
- Data Analysis: Fit experimental data to second-order polynomial model and generate response surfaces.
- Validation: Confirm optimal parameters through verification experiments.
Data Interpretation:
- Construct 3D response surface plots to visualize factor interactions
- Establish predictive models for extraction yield based on parameter optimization
- Determine optimal conditions maximizing both yield and bioactivity
Protocol 2: Nanoformulation Development and Characterization
Objective: To develop and characterize nanoformulations for enhanced bioavailability of poorly soluble compounds.
Materials and Equipment:
- Active compound (e.g., α-mangostin, gambogic acid)
- Biocompatible polymers (PLGA, chitosan)
- Lipids (Phospholipids, triglycerides)
- Surfactants (Polysorbates, poloxamers)
- High-pressure homogenizer or sonicator
- Dynamic light scattering apparatus
- Transmission electron microscope
- Dialysis membrane for release studies
Procedure:
- Preformulation Studies: Determine solubility parameters and logP of active compound.
- Formulation Screening: Prepare multiple prototype formulations varying composition ratios.
- Particle Size Optimization: Utilize microfluidics or high-pressure homogenization to achieve target size (50-200nm).
- Characterization:
- Measure particle size, PDI, and zeta potential by DLS
- Examine morphology by TEM/SEM
- Determine encapsulation efficiency by HPLC/UPLC
- In Vitro Release Studies: Conduct dialysis membrane release studies in simulated physiological fluids.
- Stability Assessment: Monitor physical and chemical stability under accelerated conditions.
- Cell Culture Studies: Evaluate cellular uptake and cytotoxicity in relevant cell lines.
Data Interpretation:
- Correlate formulation parameters with particle characteristics
- Establish in vitro-in vivo correlation using dissolution profiles
- Select lead formulations based on comprehensive characterization data
Table 3: Key Characterization Parameters for Nanoformulations
| Parameter | Analytical Method | Target Range | Significance for Bioavailability |
|---|---|---|---|
| Particle Size | Dynamic Light Scattering | 50-200 nm | Affects tissue penetration and cellular uptake |
| Polydispersity Index | Dynamic Light Scattering | <0.3 | Indicates formulation homogeneity |
| Zeta Potential | Electrophoretic Mobility | ±30 mV | Predicts physical stability |
| Encapsulation Efficiency | HPLC/UV Analysis | >90% | Determines drug loading capacity |
| Drug Release Profile | Dialysis Membrane Method | Sustained release over 12-24 hours | Predicts in vivo release behavior |
| Morphology | Transmission Electron Microscopy | Uniform spherical particles | Affects biological behavior and stability |
The Scientist's Toolkit: Essential Research Reagents and Materials
Table 4: Essential Research Reagent Solutions for Bioavailability Optimization
| Reagent Category | Specific Examples | Function in Research | Application Notes |
|---|---|---|---|
| Extraction Solvents | Supercritical CO₂, Deep Eutectic Solvents, Ethanol-Water Mixtures | Compound liberation from natural matrices | Select based on compound polarity and environmental impact |
| Polymeric Carriers | PLGA, Chitosan, HPMC, PVP, Poloxamers | Formation of amorphous solid dispersions and nanoparticles | Choose based on solubility parameters matching API |
| Lipid Excipients | Medium-chain Triglycerides, Phospholipids, Glyceryl Monostearate | Lipid-based formulation development | Critical for SEDDS and lymphatic targeting |
| Surfactants | Polysorbate 80, Span 80, Tween 80, Solutol HS15 | Stabilization of nanoemulsions and micelles | Balance emulsification efficiency with biocompatibility |
| Analytical Standards | USP/EP reference standards, Stable isotope-labeled compounds | Bioanalytical method development and validation | Essential for accurate quantification in complex matrices |
| In Vitro Absorption Models | Caco-2 cells, PAMPA membranes, Artificial biomimetic membranes | Permeability screening and absorption prediction | Provide preliminary absorption data before animal studies |
| Metabolic Enzyme Systems | Liver microsomes, S9 fractions, Recombinant CYP enzymes | Metabolic stability assessment | Identify metabolic hot spots and guide structural modification |
The optimization of extraction and formulation parameters for maximum bioavailability represents an integrated scientific discipline requiring systematic approaches across multiple domains. The development of accurate predictive bioavailability equations demands comprehensive data generation through well-designed experimental protocols that account for the complex interplay between compound properties, formulation characteristics, and physiological factors.
Future advancements in this field will likely focus on artificial intelligence-driven formulation optimization, enhanced targeted delivery systems with improved specificity, and the development of sophisticated in vitro-in vivo correlation models that better predict human absorption patterns [62]. The integration of green chemistry principles throughout extraction and formulation processes will also become increasingly important, balancing therapeutic efficacy with environmental sustainability [61].
As the pharmaceutical and nutraceutical industries continue to grapple with increasingly challenging molecules, the systematic optimization of extraction and formulation parameters outlined in these application notes provides a robust framework for enhancing bioavailability and achieving therapeutic success.
Handling Non-linear Relationships and Complex Bioavailability Patterns
Bioavailability, defined as the fraction of a nutrient or drug that is absorbed and utilized by the body, represents a critical determinant of therapeutic and nutritional efficacy. Accurate prediction of bioavailability remains a formidable challenge in pharmaceutical and nutritional sciences due to the complex, non-linear interplay of physiological, biochemical, and physicochemical factors. Traditional linear models often fail to capture the dynamic relationships between a compound's properties and its absorption profile, leading to inaccurate predictions and suboptimal development outcomes. The emergence of sophisticated artificial intelligence (AI) and Model-Informed Drug Development (MIDD) approaches now provides unprecedented capabilities to model these complex, non-linear relationships, thereby enhancing the accuracy of bioavailability estimation and accelerating the development of effective therapeutic and nutritional interventions [26] [6] [4].
The inherent complexity stems from multiple interacting variables, including a compound's solubility, permeability, metabolic stability, and the influence of transporters, alongside host factors such as gastrointestinal physiology, genetics, and disease state. These elements do not interact in a simple additive manner; rather, they form a complex network of relationships where the effect of one variable often depends on the state of several others. Consequently, the development of robust predictive equations requires a methodological shift from traditional statistical approaches to more advanced, data-driven modeling techniques capable of learning these intricate patterns directly from experimental and clinical data [6] [65].
Key Quantitative Approaches for Modeling Bioavailability
A range of quantitative modeling approaches is employed to tackle the challenge of predicting bioavailability, each with distinct strengths and applications across the development lifecycle. The selection of a "fit-for-purpose" model is paramount and depends on the specific question of interest, the available data, and the stage of development [26].
Table 1: Summary of Key Modeling Approaches for Bioavailability Prediction
| Modeling Approach | Primary Application in Bioavailability | Key Strength | Data Requirements |
|---|---|---|---|
| Physiologically Based Pharmacokinetic (PBPK) | Mechanistic prediction of absorption, distribution, and metabolism [26] | Incorporates real physiological parameters and drug product quality [26] | High (System-specific physiology & API properties) |
| Quantitative Structure-Activity Relationship (QSAR) | Prediction of biological activity and ADMET properties from chemical structure [26] | High-throughput virtual screening early in development [26] | Medium (Chemical structures & activity data) |
| Population PK (PPK) & Exposure-Response (ER) | Characterizing inter-individual variability and linking drug exposure to efficacy/safety [26] | Quantifies and explains population variability [26] | High (Rich clinical PK/PD data from a population) |
| AI/Machine Learning (ML) | De novo molecular design, virtual screening, and ADMET prediction [66] [67] [65] | Captures complex, non-linear relationships in high-dimensional data [65] [68] | Very High (Large, curated datasets for training) |
| Semi-Mechanistic PK/PD | Hybrid modeling combining empirical and mechanistic elements [26] | Balances physiological insight with data-driven flexibility [26] | Medium to High |
These methodologies are not mutually exclusive. A powerful modern strategy involves integrating mechanistic modeling with AI-based data analysis. For instance, PBPK models can provide a physiological structure, while ML algorithms can be used to refine specific sub-models or predict key input parameters, thereby enhancing the overall predictive accuracy of the integrated framework [26] [65].
A Framework for Developing Predictive Bioavailability Equations
The development of robust, predictive equations for nutrient and drug bioavailability requires a systematic and structured framework. The following four-step methodology provides a scaffold for researchers to construct and validate such equations, with a particular emphasis on handling non-linearities and complex patterns [6] [4].
Step 1: Identify Key Influencing Factors
The initial step involves a comprehensive identification of all factors that can influence the bioavailability of the compound of interest. This extends beyond simple physicochemical properties to include a systems-level view.
- Compound-Specific Factors: Solubility, permeability (e.g., log P), chemical stability, crystal form, and dosage form characteristics [65].
- Host-Dependent Factors: Gastrointestinal pH and motility, expression and activity of metabolic enzymes (e.g., CYPs) and transporters (e.g., P-gp), gut microbiome composition, and systemic physiology [26].
- Dietary & Environmental Factors: Food effects, interactions with other compounds, and the matrix of the consumed product [6] [4]. AI-powered analysis of multi-omics data (genomics, transcriptomics, proteomics) can be particularly valuable at this stage to uncover novel or underappreciated factors that contribute to variability in absorption [67] [68].
Step 2: Conduct a Comprehensive Literature Review
A systematic review of high-quality human studies is conducted to build a robust dataset for model development.
- Data Collection: Extract quantitative data on absorption parameters (e.g., C~max~, AUC, T~max~, fractional absorption) alongside the factors identified in Step 1.
- Data Curation: Assemble data into a structured, machine-readable format. This includes handling missing data, standardizing units, and annotating experimental conditions. The quality and breadth of this dataset are critical for the subsequent development of a generalizable model. This curated dataset serves as the foundation for training AI/ML models [6] [4].
Step 3: Construct Predictive Equations via Model Training
This is the core analytical phase where mathematical relationships are established between the input variables (identified factors) and the output (bioavailability).
- Algorithm Selection: Choose appropriate AI/ML algorithms based on the data structure and the suspected complexity of relationships. For non-linear, high-dimensional data, ensemble methods like Random Forests or Gradient Boosting Machines (XGBoost), and Deep Neural Networks are highly effective [67] [65] [68].
- Model Training: The selected algorithms are trained on the curated dataset to learn the mapping function from inputs to bioavailability. Techniques like cross-validation are used during training to avoid overfitting.
- Feature Importance Analysis: AI models can rank the relative contribution of each input variable, providing valuable biological insight and potentially guiding further experimental work [66] [68].
Step 4: Validate the Predictive Equation
Validation is essential to ensure the model's predictive performance is reliable and applicable to new, unseen data.
- Internal Validation: Assess performance using hold-out test sets or through rigorous cross-validation within the original dataset.
- External Validation: The gold standard for validation is to test the model's predictions against a completely independent dataset from new clinical studies or published literature [6] [4].
- Performance Metrics: Evaluate the model using metrics such as R-squared, Root Mean Square Error (RMSE), and Mean Absolute Error (MAE). A successful model will demonstrate high predictive accuracy and robustness across diverse populations and conditions, confirming its utility for decision-making [6].
Experimental Protocols for Key Assays
Integrating robust experimental data is crucial for developing and validating predictive equations. The following protocols outline key assays for generating high-quality input data.
Protocol: Parallel Artificial Membrane Permeability Assay (PAMPA)
Purpose: To predict passive transcellular permeability, a key determinant of intestinal absorption [65]. Workflow:
- Membrane Preparation: Create an artificial lipid membrane (e.g., with phosphatidylcholine) in a multi-well filter plate to mimic the intestinal epithelial barrier.
- Compound Incubation: Add a solution of the test compound to the donor plate. The receiver plate contains a buffer solution at physiological pH.
- Assay Execution: Sandwich the donor and receiver plates and incubate for a predetermined time (e.g., 4-18 hours) under controlled agitation to minimize unstirred water layers.
- Sample Analysis: Quantify the concentration of the test compound in both the donor and receiver compartments at the end of the incubation period using a validated analytical method (e.g., HPLC-UV, LC-MS/MS).
- Data Calculation: Calculate the apparent permeability (P~app~) using the formula:
P_app = (V_D / (Area * Time)) * (C_R / C_D_initial), where V~D~ is the donor volume, Area is the membrane surface area, Time is the incubation time, and C~R~ is the receiver concentration.
Protocol: Thermodynamic Solubility Measurement
Purpose: To determine the equilibrium solubility of a compound, which directly influences dissolution and absorption [65]. Workflow:
- Sample Preparation: Add an excess of the solid test compound to a relevant biorelevant buffer (e.g., FaSSIF, FeSSIF) in a sealed vial.
- Equilibration: Agitate the suspension at a constant temperature (e.g., 37°C) for a sufficient time (typically 24-72 hours) to reach solid-liquid equilibrium.
- Phase Separation: Separate the saturated solution from the undissolved solid by centrifugation followed by filtration using a compatible filter (e.g., 0.45 µm PVDF).
- Quantification: Dilute the clear supernatant appropriately and analyze the compound concentration using a validated HPLC-UV or LC-MS/MS method.
- Data Recording: Report the solubility as the concentration in the supernatant (e.g., µg/mL or µM). The protocol should specify the buffer composition, pH, and temperature.
Protocol: Metabolic Stability in Liver Microsomes
Purpose: To assess the susceptibility of a compound to hepatic metabolism, a major factor influencing oral bioavailability. Workflow:
- Incubation Mixture: Prepare a mixture containing liver microsomes (human or relevant species), test compound, and an NADPH-regenerating system in a potassium phosphate buffer.
- Initiation & Incubation: Start the reaction by adding the NADPH-regenerating system. Incubate at 37°C with shaking. Include control incubations without NADPH to account for non-enzymatic degradation.
- Termination: At predetermined time points (e.g., 0, 5, 15, 30, 60 minutes), withdraw aliquots and quench the reaction with an equal volume of ice-cold acetonitrile containing an internal standard.
- Sample Processing: Centrifuge the quenched samples to precipitate proteins and collect the clear supernatant for analysis.
- Data Analysis: Measure the peak area of the parent compound remaining at each time point via LC-MS/MS. Calculate the in vitro half-life and intrinsic clearance.
The Scientist's Toolkit: Research Reagent Solutions
Table 2: Essential Research Reagents and Materials for Bioavailability Studies
| Reagent/Material | Function & Application | Key Considerations |
|---|---|---|
| Biorelevant Media (FaSSIF, FeSSIF) | Simulates fasted and fed state intestinal fluids for dissolution and solubility testing [65]. | Critical for predicting in vivo performance; composition must be carefully controlled. |
| Caco-2 Cell Line | In vitro model of human intestinal permeability; assesses passive and active transport [65]. | Requires long culture time (21 days) to differentiate; results can correlate with human absorption. |
| Human Liver Microsomes / Hepatocytes | To study Phase I and Phase II metabolic pathways and estimate hepatic clearance [26]. | Source (donor pool) quality and activity are crucial for reproducible results. |
| Specific Chemical Inhibitors/Activators | Used in transport and metabolism studies to identify involvement of specific enzymes (e.g., Ketoconazole for CYP3A4) or transporters (e.g., Verapamil for P-gp). | Requires careful experimental design to ensure specificity and interpretability of results. |
| AI/ML Software Platforms (Python with Scikit-learn, TensorFlow, PyTorch) | To build, train, and validate predictive models for bioavailability and ADMET properties [66] [67] [68]. | Requires expertise in data science and computational biology; dependent on high-quality, curated input data. |
| PBPK Software (GastroPlus, Simcyp) | Mechanistic, whole-body modeling and simulation of pharmacokinetics and bioavailability [26]. | Integrates in vitro and in silico data to predict in vivo outcomes; supports "fit-for-purpose" development. |
Visualization of AI-Enhanced Predictive Workflow
The integration of AI into the predictive modeling workflow fundamentally transforms the ability to handle complex bioavailability patterns, as illustrated below.
This diagram illustrates how diverse data sources feed into an AI/ML engine. The model learns the complex, non-linear mappings between the input variables and the measured bioavailability outcome. Once trained, this engine can accurately predict the bioavailability of new chemical entities based solely on their characterized properties, significantly accelerating the screening and optimization process [66] [67] [65].
Model Validation, Performance Assessment, and Comparative Analysis
In the field of predictive bioavailability research, the development of robust mathematical models is paramount for anticipating drug behavior, such as Food Effects (FE), which can significantly alter a drug's bioavailability [69]. However, a model's accuracy is not determined by its performance on the data from which it was built, but by its ability to make reliable predictions for new, unseen data. Validation methodologies are the critical processes that test this generalizability. They form a spectrum of rigor, progressing from internal techniques like train-test splits that provide an initial performance check, to external validation on entirely independent datasets, which is the ultimate test of a model's real-world utility [70]. Without proper validation, predictive models risk being overfit—tailored to the idiosyncrasies of the development data—and can yield misleading results, potentially derailing drug development decisions [70]. This document outlines standardized protocols for these validation methodologies, framed within the context of developing predictive bioavailability equations.
Core Concepts and Definitions
- Prediction Model: A mathematical equation that calculates an individual's risk or outcome probability based on specific predictor variables [70].
- Overfitting: A scenario where a model corresponds too closely to the development dataset, capturing its random noise rather than the underlying relationship, leading to poor performance on new data [70].
- Internal Validation: The process of testing a model's performance using the same data from which it was derived, providing an initial estimate of overfitting [70].
- External Validation: The action of testing the original prediction model in a set of new, independent patients to determine its reproducibility and generalizability [70].
- Reproducibility (Validity): The model's performance when applied to new individuals similar to the original development population [70].
- Generalizability (Transportability): The model's performance when applied to a separate population with different characteristics, settings, or outcome incidences [70].
Hierarchy of Validation Methodologies
The following diagram illustrates the relationship between different validation types, from internal checks to full external assessment.
Detailed Experimental Protocols
Protocol for Internal Validation Methods
4.1.1. Split-Sample Validation
- Objective: To obtain an initial, unbiased estimate of model performance by holding out a portion of the development data.
- Procedure:
- Randomly partition the entire available dataset into two subsets: a development/training set (typically 2/3 or 70-80% of the data) and a validation/testing set (the remaining 1/3 or 20-30%).
- Develop the predictive bioavailability equation (e.g., using ANN or SVM) using only the development set.
- Apply the finalized model from step 2 to the validation set. Calculate performance metrics (see Section 6) without any further model tweaking.
- Report performance metrics from both the development and validation sets.
- Considerations: This method is inefficient in small datasets as it reduces the data available for both model development and testing [70].
4.1.2. k-Fold Cross-Validation
- Objective: To provide a robust estimate of model performance by leveraging all available data for both training and validation.
- Procedure:
- Randomly split the entire dataset into k equally sized folds (common choices are k=5 or k=10).
- For each of the k iterations:
- Retain one fold as the validation set.
- Use the remaining k-1 folds as the training set to develop the model.
- Validate the model on the retained fold and compute performance metrics.
- Pool the results from the k iterations (e.g., by averaging the performance metrics) to obtain a final internal performance estimate.
- Considerations: This method provides a more stable performance estimate than a single split-sample validation, especially with limited data.
4.1.3. Bootstrapping
- Objective: To estimate model performance and optimism (the degree of overfitting) through resampling.
- Procedure:
- Draw a large number (e.g., 200 or more) of bootstrap samples from the original dataset. Each sample is the same size as the original dataset, obtained by sampling with replacement.
- For each bootstrap sample:
- Develop a model.
- Calculate the model's performance on the bootstrap sample.
- Calculate the model's performance on the original dataset.
- Calculate the optimism as the performance on the bootstrap sample minus the performance on the original dataset.
- Average the optimism over all bootstrap iterations. Subtract this average optimism from the performance of the model developed on the original dataset to obtain an optimism-corrected performance estimate.
Protocol for External Validation
4.2.1. Objective: To assess the reproducibility and generalizability of a finalized predictive bioavailability model in an entirely independent patient cohort, assembled separately from the development population [70]. This is a crucial step before clinical implementation.
4.2.2. Pre-Validation Checklist:
- The model development is complete, and the final prediction equation is fixed.
- An appropriate external validation cohort has been identified. This cohort should be sourced from a different time period, geographic location, or clinical setting [70].
- Data for all predictor variables in the final model and the outcome variable are available in the validation cohort.
4.2.3. Step-by-Step Procedure:
- Cohut Sourcing: Assemble the validation cohort. This should be done independently from the development process, ideally by different researchers [70]. For bioavailability research, this could involve data from a different clinical trial site or a separate pharmacokinetic study.
- Data Preparation: Extract and pre-process the predictor variables and outcome data in the validation cohort exactly as defined in the original model. Impute missing data using methods pre-specified during model development, if necessary.
- Risk Calculation: For each individual in the validation cohort, calculate the predicted risk or outcome using the original model's formula. No refitting of the model is allowed [70].
- Performance Assessment: Compare the predicted values to the observed outcomes in the validation cohort using a suite of performance metrics (see Section 6).
- Reporting: Document the performance metrics and compare them to the model's performance in the development cohort. Discuss reasons for any observed degradation in performance (e.g., differences in patient population, outcome incidence, or clinical practice).
Application in Bioavailability Research: A Case Study on Food Effect Prediction
The following workflow applies the validation methodology to a specific bioavailability problem: predicting the effect of food on drug absorption.
Case Study Summary: A study aimed to predict human food effect (FE) using machine learning. The model was developed on drugs licensed from 2016-2020, using over 250 predicted drug properties. Key predictors included the Octanol Water Partition Coefficient (S+logP), Number of Hydrogen Bond Donors (HBD), Topological Polar Surface Area (T_PSA), and Dose (mg) [69]. An Artificial Neural Network (ANN) model demonstrated superior performance (82% accuracy) upon internal validation compared to a Support Vector Machine (SVM) [69]. Following the principles in this protocol, the final ANN model would then require external validation on a subsequent set of drugs to confirm its 72% testing accuracy before it could be reliably used in pre-clinical development [69].
Performance Metrics and Data Presentation
To standardize reporting, the following performance metrics should be calculated for both internal and external validation cohorts. The table below summarizes key metrics for classification models (e.g., predicting positive/no/negative food effect) and regression models (e.g., predicting AUC or C~max~).
Table 1: Key Performance Metrics for Predictive Model Validation
| Metric Category | Metric Name | Formula / Definition | Interpretation in Bioavailability Context |
|---|---|---|---|
| Discrimination | Accuracy | (True Positives + True Negatives) / Total Predictions | Overall proportion of correct FE classifications. |
| Area Under the ROC Curve (AUC) | Area under the Receiver Operating Characteristic curve | Ability to distinguish between drugs with and without a FE. | |
| Calibration | Hosmer-Lemeshow Test | X^2^ test comparing observed vs. predicted event rates | Agreement between predicted probability of FE and observed frequency. A non-significant p-value is desired. |
| Calibration Slope | Slope of the line in the calibration plot. Ideal value is 1. | Indicates if model predictions are too extreme (>1) or too modest (<1). | |
| Overall Performance | Brier Score | Mean squared difference between predicted probabilities and actual outcomes (0 or 1). | Overall measure of predictive accuracy. Ranges from 0 (perfect) to 1 (worst). |
| R-Squared (R²) | Proportion of variance in the outcome explained by the model. | For regression models (e.g., predicting AUC). Higher is better. | |
| Mean Squared Error (MSE) | Average of the squares of the errors between predicted and actual values. | For regression models. Lower is better. |
Table 2: Comparison of Validation Methodologies
| Methodology | Key Characteristic | Key Advantage | Key Limitation | Recommended Use |
|---|---|---|---|---|
| Split-Sample | Single random partition of data. | Simple to implement and understand. | Inefficient use of data; high variance in estimate. | Initial exploratory analysis with very large datasets. |
| Cross-Validation | Multiple partitions; each data point used for training and validation. | More robust and stable performance estimate. | Computationally intensive. | Standard for internal validation during model development. |
| Bootstrapping | Repeated sampling with replacement. | Provides optimism-corrected performance estimates. | Complex implementation and interpretation. | Preferred method for small-to-moderate sized datasets. |
| Temporal Validation | Validation cohort from a different time period. | More realistic than internal methods; tests model stability over time. | May not assess generalizability to different populations. | Crucial step before model deployment in a stable setting. |
| Geographic Validation | Validation cohort from a different location or site. | Begins to assess generalizability to new populations. | Performance can be confounded by other site-specific differences. | Important for multi-center models or implementation. |
| Fully Independent Validation | Validation by independent researchers on a distinctly different cohort. | Gold standard for assessing generalizability and combating research waste [70]. | Can be challenging and costly to organize. | Mandatory before clinical implementation or publication of a definitive model. |
The Scientist's Toolkit: Essential Research Reagents and Materials
Table 3: Essential Research Reagents and Computational Tools for Predictive Bioavailability Research
| Item / Reagent | Function / Application | Specification / Notes |
|---|---|---|
| Curated Drug Database | Provides structured data for model development and validation. | Should include drug identifiers, pharmacokinetic data (AUC, C~max~), and key molecular properties. Sources: licensed drug databases (e.g., 2016-2020 dataset [69]). |
| Molecular Descriptor Software | Predicts physicochemical properties of drug molecules for use as model predictors. | Used to calculate key features like S+logP, HBD, T_PSA, and solubility [69]. Examples: ADMET Predictor, Schrodinger Suite. |
| Machine Learning Framework | Provides algorithms (ANN, SVM, Random Forest) for building predictive models. | Open-source (e.g., scikit-learn, TensorFlow, XGBoost) or commercial platforms. Must support internal validation methods (cross-validation). |
| Statistical Software | For data management, statistical analysis, and performance metric calculation. | R, Python (with pandas/statsmodels), SAS, or SPSS. Essential for conducting external validation analyses [70]. |
| PBPK Modeling Software | A complementary in silico tool for mechanistic understanding of bioavailability. | Platforms like GastroPlus or Simcyp Simulator can be used to generate virtual patient data or to compare with ML model predictions. |
| High-Performance Computing (HPC) Cluster | For computationally intensive tasks like hyperparameter tuning, bootstrapping, or large-scale ANN training. | Necessary for processing large datasets (>250 features) and complex models in a time-efficient manner [69]. |
Comparative Performance Metrics for Regression and Classification Models
Within the framework of developing predictive bioavailability equations, the selection and interpretation of appropriate performance metrics is a critical step. Bioavailability, a key pharmacokinetic parameter, determines the fraction of a drug that reaches systemic circulation unchanged. Accurate prediction of this property via in silico models can significantly reduce late-stage attrition in drug development [22]. These predictive models generally fall into two categories: regression models that forecast continuous bioavailability values (e.g., percentage absorbed), and classification models that categorize compounds into discrete classes (e.g., high vs. low bioavailability) [71]. This document provides detailed application notes and protocols for the evaluation metrics essential for validating both types of models, specifically contextualized for bioavailability research.
The evaluation of machine learning models requires distinct metrics tailored to the nature of the model's output. The following sections and summary table delineate the fundamental metrics for regression and classification tasks.
Table 1: Core Performance Metrics for Regression and Classification Models
| Model Type | Metric | Formula (Simplified) | Interpretation | Application in Bioavailability Prediction |
|---|---|---|---|---|
| Regression | Mean Squared Error (MSE) [72] [73] | MSE = (1/n) * Σ(Actual - Predicted)² |
Lower values indicate better fit; penalizes large errors. | Quantifies average magnitude of prediction error for continuous bioavailability percentage. |
| Root Mean Squared Error (RMSE) [72] [74] | RMSE = √MSE |
Lower values are better; in same units as target variable. | Interpretable measure of average prediction error in bioavailability percentage units. | |
| Mean Absolute Error (MAE) [72] [75] | MAE = (1/n) * Σ|Actual - Predicted| |
Lower values are better; robust to outliers. | Provides a robust estimate of average error in bioavailability. | |
| R-squared (R²) [72] [73] | R² = 1 - (SS_residual / SS_total) |
Proportion of variance explained; 0-1, higher is better. | Indicates how well molecular descriptors explain variability in bioavailability. | |
| Classification | Accuracy [72] [75] | (TP + TN) / (TP + TN + FP + FN) |
Proportion of correct predictions. | Overall success rate in classifying compounds into correct bioavailability class (e.g., High/Low). |
| Precision [72] [75] | TP / (TP + FP) |
Proportion of positive identifications that are correct. | Measures reliability in identifying true high-bioavailability compounds. | |
| Recall (Sensitivity) [72] [75] | TP / (TP + FN) |
Proportion of actual positives correctly identified. | Ability to correctly identify all truly high-bioavailability compounds. | |
| F1-Score [72] [76] | 2 * (Precision * Recall) / (Precision + Recall) |
Harmonic mean of precision and recall. | Balanced metric for imbalanced datasets where both false positives and false negatives are critical. | |
| AUC-ROC [72] [75] | Area under ROC curve | Model's ability to distinguish between classes; 0.5-1, higher is better. | Assesses model's ranking performance, crucial for prioritizing candidate compounds. |
Experimental Protocols for Model Evaluation
Protocol for Evaluating a Regression Model (Continuous Bioavailability Prediction)
This protocol outlines the steps to train a regression model and calculate key performance metrics using Python, relevant for predicting a continuous bioavailability value.
Workflow Overview:
Step-by-Step Methodology:
- Dataset Preparation & Feature Calculation: Curate a dataset of molecules with experimentally measured bioavailability values. For each molecule, calculate relevant molecular descriptors (e.g., topological polar surface area, logP, molecular weight) using software like Mordred [22].
- Data Splitting: Partition the data into training and testing sets to ensure unbiased evaluation. A typical split is 80:20.
- Model Training: Train a regression algorithm (e.g., Random Forest, as it demonstrated high performance in bioavailability prediction [77]) on the training set.
- Prediction & Evaluation: Use the trained model to make predictions on the held-out test set and compute regression metrics.
Protocol for Evaluating a Classification Model (Categorical Bioavailability)
This protocol is used when the goal is to categorize compounds into classes (e.g., using a 20% or 50% cutoff for high/low bioavailability [22]).
Workflow Overview:
Step-by-Step Methodology:
- Dataset Preparation & Labeling: Start with a dataset of molecules with known bioavailability. Apply a predefined cutoff (e.g., HOB ≥ 50% = Positive Class; HOB < 50% = Negative Class) to create binary labels [22].
- Data Splitting: Split the feature set and the new binary labels into training and test sets.
- Model Training: Train a classification algorithm. A consensus of multiple Random Forest classifiers has been shown to yield excellent accuracy in HOB prediction [22].
- Prediction & Evaluation: Generate predictions and compute a suite of classification metrics to evaluate different aspects of performance.
The Scientist's Toolkit: Essential Research Reagents & Software
The following table details key computational tools and their functions, as employed in state-of-the-art predictive bioavailability modeling [22] [77].
Table 2: Essential Tools and Reagents for Predictive Bioavailability Modeling
| Tool / Reagent | Type | Function in Research | Example Use in Bioavailability Prediction |
|---|---|---|---|
| KNIME Analytics Platform [77] | Software Platform | Provides a visual, workflow-based environment for data blending, ML, and reporting. | Creating automated, end-to-end workflows for bioavailability prediction from raw data to model deployment. |
| Mordred [22] | Software Library | Calculates a comprehensive set (>>1000) of molecular descriptors from chemical structure. | Generating 2D molecular descriptors that serve as input features for ML models. |
| RDKit [22] | Software Library | A toolkit for cheminformatics and machine learning. | Handling chemical data, generating 3D molecular structures, and calculating molecular fingerprints. |
| Scikit-learn [73] [74] | Software Library | Provides efficient tools for machine learning and statistical modeling in Python. | Implementing Random Forest, Logistic Regression, and other algorithms, and calculating all performance metrics. |
| SHAP (SHapley Additive exPlanations) [22] | Software Library | Explains the output of any ML model by quantifying the contribution of each feature. | Interpreting bioavailability models to identify which molecular descriptors most influence the prediction. |
| Random Forest Algorithm [22] [77] | Machine Learning Algorithm | An ensemble learning method that operates by constructing multiple decision trees. | Serves as the core predictive model for both regression and classification tasks, often providing high accuracy. |
Accurate estimation of sodium intake is crucial for cardiovascular disease research and the development of predictive bioavailability equations. The gold standard method, 24-hour urine collection, is cumbersome and impractical for large-scale studies and clinical routines [78] [79]. This case study evaluates the development and validation of novel prediction equations that estimate 24-hour sodium excretion from spot urine samples, a critical advancement for pharmacological and nutritional research.
Comparative Analysis of Prediction Equations
Research demonstrates significant variability in the performance of different predictive formulae across populations. The search results reveal consistent efforts to develop and validate more accurate, population-specific equations.
Table 1: Performance Comparison of Sodium Excretion Prediction Equations
| Equation Name | Population Origin | Key Input Variables | Reported Bias | Key Limitations |
|---|---|---|---|---|
| Swiss Anthropometric Model [78] [79] | Swiss adult population | Age, sex, anthropometry, spot Na, Cr | -5.5 mmol/24h | Requires population-specific calibration |
| Swiss Model with Urea [78] [79] | Swiss adult population | Adds urea and potassium to anthropometric model | -2.86 mmol/24h | Increased analytical complexity |
| INTERSALT [80] [81] | International (Western) | Spot Na, Cr, K, age, sex, BMI | -165 mg (Morning spot) | Underestimates intake in South African populations [81] |
| Tanaka [80] [81] | Japanese | Spot Na, Cr, predicted 24h Cr | -23 mg (Overnight spot) [80] | Overestimates at low intake, underestimates at high intake [78] |
| Kawasaki [80] [81] | Japanese | Spot Na, Cr, predicted 24h Cr | Bias up to 1300 mg [80] | Poor performance in South African and Malaysian populations [81] [82] |
| Malaysian New Equation [82] | Malaysian | Sex, weight, height, age, spot K, Cr, Na | -0.35 mg/day | Newly developed, requires external validation |
Table 2: Validation Metrics from Recent Studies
| Study & Equation | Correlation Coefficient (r) | Mean Bias | 95% Limits of Agreement | Sample Size (n) |
|---|---|---|---|---|
| Swiss Anthropometric Model [78] | Not specified | -5.5 mmol/24h | Not specified | 811 |
| NaRYC Model (Hospital Patients) [83] | 0.613 (Pearson) | 24.85 mmol/24h | 17.06 to 32.63 mmol/24h | 513 (Dev + Val) |
| Singapore New Equation [84] | 0.50 | -3.5 mmol | -14.8 to 7.8 mmol | 144 |
| Malaysian New Equation [82] | 0.50 | -0.35 mg/day | -72.26 to 71.56 mg/day | 768 |
Experimental Protocols for Equation Validation
Urine Collection and Biobanking Protocol
The following standardized protocol, derived from the TEST study [85] [79] and other validation studies [83] [82], ensures high-quality data for developing and validating prediction equations.
- Participant Preparation: Obtain written informed consent. Exclude individuals with conditions affecting renal sodium handling (e.g., pregnancy, chronic kidney disease, use of loop diuretics) [80].
- 24-Hour Urine Collection:
- Start: Participants discard first morning void. Note the precise time [85] [81].
- Collection: All subsequent urine voids, including the first morning void of the next day, are collected in a pre-labeled container. A urine collection diary is used to record the time of each void and any missed collections or spills [85] [79].
- Preservation: Containers should contain 1 g of thymol as a preservative and be kept cold (on ice or in a refrigerator) throughout the collection period [81].
- Completion Criteria: Defined as a recorded collection time of ≥20 hours, total volume ≥500 mL, and no more than one missed void [80]. Completeness can be further verified by evaluating creatinine excretion (e.g., >4 mmol/day for women, >6 mmol/day for men) [81] [82].
- Spot Urine Collection: The optimal specimen is the first morning urine (the first void after the longest sleep period) [78] [83]. This sample is collected separately and aliquoted immediately [81].
- Sample Processing and Storage: Upon return, total 24-hour volume is recorded. A composite 24-hour sample is created by taking a proportional aliquot from each void. All aliquots (composite and spot) are stored frozen at -80°C until analysis [80].
Biochemical Analysis Workflow
The analytical workflow for determining key urinary biomarkers is as follows.
Data Analysis and Model Validation Protocol
- Equation Application: Apply existing (e.g., INTERSALT, Tanaka) and newly developed equations to the spot urine sodium, creatinine, and anthropometric data.
- Statistical Comparison:
- Use Bland-Altman plots to assess the mean bias and 95% limits of agreement between measured and predicted 24-hour sodium excretion [81] [82].
- Calculate correlation coefficients (e.g., Pearson's r) to evaluate the strength of the linear relationship [83] [82].
- Evaluate classification accuracy using metrics like the Area Under the Curve (AUC) for clinically relevant sodium intake thresholds [78] [83].
- Model Development: For new equations, use multiple linear regression with measured 24-hour sodium excretion as the dependent variable. Candidate predictors include age, sex, weight, height, and spot urine sodium, potassium, and creatinine [82].
- Validation: Split the dataset randomly into a development cohort (~70%) and a validation cohort (~30%). Perform double cross-validation to ensure model stability and prevent overfitting [78] [82].
The Scientist's Toolkit
Table 3: Essential Research Reagents and Materials
| Item | Specification / Example | Primary Function in Protocol |
|---|---|---|
| Urine Collection Container | 2-5 L, wide-mouth, with sealable lid [85] [81] | Safe and secure collection of 24-hour urine output. |
| Preservative | Thymol (1 g) [81] | Inhibits microbial growth, preserving analyte integrity during collection. |
| Portioning Device | Plastic beaker or graduated cylinder [85] | Hygienic transfer of urine from collection vessel to storage container. |
| Spot Urine Container | 15 mL Porvair tubes [81] | Collection and storage of single void samples. |
| Aliquot Tubes | Cryogenic vials (1-2 mL) | Long-term storage of urine samples in frozen state. |
| Biochemical Analyzer | Clinical Analyzer (e.g., Hitachi Modular P, Architect C) [80] [82] | High-throughput, precise measurement of sodium, potassium, and creatinine. |
| Ion-Selective Electrode | Cobas ISE/Na+, K+, Cl− assay [80] | Specifically for accurate sodium and potassium concentration measurement. |
| Creatinine Assay Kit | Enzymatic or Jaffe method kit [81] [82] | For quantification of urinary creatinine, essential for normalization. |
| Cold Chain Equipment | Ice packs, -80°C Freezer [80] [81] | Maintains sample stability from collection to analysis. |
The preliminary validation of new, population-specific equations represents a significant step forward in the accurate and feasible estimation of population sodium intake. The move towards incorporating anthropometric data and using first morning urine samples addresses key physiological variabilities. For the broader thesis on predictive bioavailability, these methodologies underscore the critical importance of rigorous biomarker collection protocols and population-specific calibration in model development. Future research should focus on the external validation of these new equations across diverse populations and their integration into clinical and public health practice for monitoring sodium intake and cardiovascular risk.
Assessing Model Robustness and Generalizability Across Different Populations
The development of predictive models for nutrient and drug bioavailability represents a significant advancement in nutritional science and clinical pharmacology. However, a model's predictive performance in the population in which it was developed does not guarantee its accuracy when applied to new, diverse populations. Assessing model robustness and generalizability is therefore paramount, especially for high-impact decisions in drug development and clinical dosing guidance [6] [86]. Robustness refers to a model's ability to maintain stable performance despite variations in input data or underlying assumptions, while generalizability is its capacity to perform accurately on data from independent patient cohorts that were not used during the development process [87]. This protocol outlines a structured framework and detailed methodologies for rigorously evaluating these critical properties, specifically within the context of predictive bioavailability equations.
The foundation for developing predictive equations, as described by the Framework for Developing Prediction Equations for Estimating the Absorption and Bioavailability of Nutrients from Foods, involves a structured 4-step process: (1) identifying key factors influencing bioavailability; (2) conducting a comprehensive literature review of high-quality human studies; (3) constructing predictive equations; and (4) validating the equations to facilitate translation [6]. The assessment of robustness and generalizability forms the core of the crucial fourth step, ensuring that the models are not only mathematically sound but also clinically applicable across the intended populations.
Foundational Methodologies for Model Validation
Model Selection Based on Target Population
The first critical step in ensuring generalizability is the informed selection of an appropriate pre-existing model or the development of a new one with the target population in mind. An ideal model for application in precision dosing or nutritional assessment is one that was developed in a population demographically and clinically similar to the one in which it will be applied [88]. Key factors to consider during model selection are detailed in the table below.
Table 1: Key Considerations for Model Selection to Enhance Generalizability
| Consideration Factor | Description | Impact on Generalizability |
|---|---|---|
| Age Distribution | Physiological differences (organ maturation in pediatrics, declining function in elderly) significantly affect PK/PD. | Models may fail if age-related physiological changes (e.g., ontogeny) are not accounted for via allometry or maturation functions [88]. |
| Ethnicity and Race | Consideration of genetic polymorphisms that can alter a drug's metabolism or a nutrient's absorption. | A model that does not include covariate effects for prevalent genetic polymorphisms in the target population may be inaccurate [88]. |
| Clinical Condition | Specific disease states (e.g., renal impairment, obesity) and comorbidities can alter bioavailability. | A model derived from healthy volunteers may not generalize to critically ill patients, and vice versa [88]. |
| Dosing Regimen | The route of administration, dose amount, and frequency. | A model developed for intravenous dosing may not be valid for oral administration, which involves absorption processes [88]. |
Statistical Validation Using Confidence Intervals for Bioequivalence
A robust method for validating model performance against a new clinical dataset is to adopt a statistical approach similar to bioequivalence (BE) testing. This method moves beyond simple point estimates, such as the commonly used twofold criterion, by incorporating the inherent variability of the observed data [86].
The general concept involves constructing a 90% confidence interval (CI) for the predicted-to-observed geometric mean ratio (GMR) of key pharmacokinetic parameters, such as Area Under the Curve (AUC), maximum concentration (Cmax), and half-life (t~1/2~). The model's predictive performance is considered acceptable if the entire CI for each parameter falls within pre-defined acceptance boundaries [86]. The standard BE boundaries of [0.8, 1.25] are often recommended, as they account for a 20% clinical variation deemed not clinically relevant [86].
Table 2: Methods for Constructing the Confidence Interval for the Geometric Mean Ratio
| Method | Data Requirements | Statistical Approach | Advantages and Limitations |
|---|---|---|---|
| Individual-Level Approach | Individual patient data from the clinical comparator study. | A CI is constructed using the paired differences between the individual predictions and observations. | This is the preferred method. It reduces inter-individual variability, akin to a cross-over BE study, and requires a smaller sample size for the same statistical power [86]. |
| Group-Level Approach | Only aggregate data (Geometric Mean and its variability) from the literature. | A CI is constructed using the group-level summary statistics, treating the model prediction as a fixed value. | Useful for post-marketing validation where individual data is unavailable. It suffers from both intra- and inter-individual variance, thus requiring a larger number of clinical observations [86]. |
The workflow for this validation is as follows: after running matched simulations against the comparator dataset, the GMR and its 90% CI are calculated for each PK parameter. The model is accepted if all CIs fall entirely within [0.8, 1.25]. If any CI falls completely outside this range, the model is rejected for that population. If a CI is too wide and straddles the boundary, the dataset is deemed to have an insufficient number of subjects to draw a definitive conclusion [86].
Advanced Techniques for Assessing and Improving Generalizability
Customization of Ready-Made Models
When a ready-made model does not perform adequately on a new target population, several customization techniques can be employed to improve its generalizability. These are particularly valuable when it is impractical for a research site to develop a model completely from scratch due to data, computational, or technical constraints [87].
The three primary methods for adopting a ready-made model are [87]:
- Apply "As-Is": Directly applying the model without any modifications. This is the baseline approach but often suffers from performance degradation if the source and target populations differ significantly.
- Decision Threshold Readjustment: Using the source model's output but recalculating the decision threshold (e.g., the cut-off for a classification task) using a small amount of site-specific data. This is a low-resource method to better align the model with the new population's characteristics.
- Transfer Learning (Finetuning): A subset of the pre-trained model is retrained or "finetuned" on data from the target population. This allows the model to adapt its parameters to the new data distribution without requiring training from scratch, often yielding the best performance among ready-made approaches [87].
These methods should be compared against a Combined-Site approach (training a model on data from multiple sites from the outset) and a Single-Site baseline (a model developed solely on the target population's data) to fully contextualize the achieved level of generalizability.
Visualization and Quantitative Assessment Tools
Effective data visualization is critical for comparing model performance across different populations and identifying potential reasons for a lack of generalizability.
Table 3: Key Visualization Tools for Model Assessment
| Visualization Type | Primary Use Case in Model Assessment | Key Insight Provided |
|---|---|---|
| Bar Chart | Comparing the performance metrics (e.g., AUC, prediction error) of a single model across different populations, or comparing multiple models within one population. | Provides a clear, simple comparison of categorical data (populations/models) against a numerical scale (performance metric) [89]. |
| Line Chart | Summarizing the trend of a model's prediction error or performance over time, or across a continuous variable like age. | Illustrates positive or negative trends and fluctuations, helping to identify systematic bias related to a covariate [89]. |
| Histogram | Visualizing the distribution of a specific population covariate (e.g., weight, renal function) or the distribution of model prediction errors. | Shows the frequency of data points within intervals, revealing whether the test population's characteristics match the training population [89]. |
| Scatter Plot | Analyzing the relationship between predicted and observed values, or between prediction error and a specific patient covariate. | Helps identify the strength of correlation and patterns of bias (e.g., under-prediction in high values) [90]. |
Experimental Protocol for a Multi-Population Model Validation Study
This protocol provides a step-by-step guide for assessing the robustness and generalizability of a predictive bioavailability equation.
Research Reagent Solutions and Computational Tools
Table 4: Essential Reagents and Tools for Model Validation
| Item / Tool | Function / Description | Application in Protocol |
|---|---|---|
| Population PK/PD Modeling Software | Software for nonlinear mixed-effects modeling (e.g., NONMEM, Monolix) used for model development and refinement. | Used in Step 2 for covariate model building and in Step 5 for model refinement [88]. |
| Precision Dosing Software | Clinical software platforms (e.g., MwPharm++, InsightRX) that implement models with Bayesian forecasting for MIPD. | Used in Step 6 for clinical simulation and dose optimization in the target population [88]. |
| Statistical Computing Tool | Tools for statistical analysis and data visualization (e.g., R, Python with Pandas/NumPy, SPSS). | Used for all data analysis, including descriptive statistics, BE confidence interval calculation, and generating visualizations [90]. |
| PBPK Modeling Platform | Physiologically-based pharmacokinetic software (e.g., GastroPlus, Simcyp Simulator) for mechanistic modeling of absorption and disposition. | Can be used as the source model in Step 1, or to generate virtual comparator data [86]. |
| Clinical Data from Target Population | De-identified, rich or sparse PK data from the new population of interest. | The essential input data for the external validation in Steps 3 and 4 [87]. |
Step-by-Step Experimental Workflow
Step 1: Model and Population Selection Define the Context of Use (COU) for the model. Select a candidate model based on the criteria in Table 1. Obtain a clinical dataset from the target population that is independent of the model's development data. The dataset should include demographic, clinical, and PK data relevant to the compound.
Step 2: Define the Validation Plan Select the key PK parameters for comparison (typically AUC, Cmax, and t~1/2~). Predefine the acceptance boundaries for the GMR's confidence interval (e.g., [0.8, 1.25]). Decide on the statistical method (individual-level or group-level) based on data availability.
Step 3: Execute Matched Simulations Simulate the clinical trial using the candidate model, ensuring that the virtual population and dosing conditions precisely match those of the target population clinical dataset.
Step 4: Performance Assessment Extract the predicted PK parameters from the simulations. Calculate the observed GMs from the clinical data. Construct the 90% CI for the GMR of each parameter using the chosen statistical method. Compare each CI to the pre-defined acceptance boundaries.
Step 5: Model Refinement (if required) If the model fails the validation in Step 4, employ customization techniques. For a classification model, adjust the decision threshold using site-specific data. For a more substantial improvement, use transfer learning to finetune the model on a portion of the target population data, then re-validate on a held-out portion.
Step 6: Preparation for Clinical Implementation Once the model is validated, integrate it into a suitable clinical software platform for model-informed precision dosing (MIPD). This allows clinicians to use the generalized model for Bayesian forecasting and personalized dose optimization in the target population [88].
Comparing Traditional Statistical vs. Machine Learning Approaches
In the field of drug development and nutritional science, accurately predicting bioavailability is paramount for determining the efficacy and safety of compounds. The journey from a potential drug candidate to a marketable product is fraught with challenges, with poor pharmacokinetic properties being a leading cause of failure in late-stage development [91]. For decades, researchers relied on traditional statistical methods to develop predictive equations for bioavailability. However, the emergence of machine learning (ML) has introduced powerful new capabilities for modeling complex, non-linear relationships in bioavailability data. This article provides a detailed comparison of these methodological paradigms, offering application notes and protocols to guide researchers in selecting and implementing the most appropriate approach for their bioavailability prediction challenges, particularly within the context of developing predictive bioavailability equations.
Methodological Foundations: Traditional Statistical Approaches
Traditional statistical methods for bioavailability prediction have established the foundational framework for quantitative structure-activity relationship (QSAR) modeling and bioavailability estimation.
Core Traditional Techniques
Traditional approaches primarily utilize linear regression models and established calibration curve methodologies:
- Multiple Linear Regression (MLR) and Partial Least Squares (PLS): These linear methods model bioavailability based on molecular descriptors, with documented performance of R² = 0.60-0.64 for oral bioavailability prediction [20].
- Calibration Curve Methodologies: The Abductive Method, based on Graybill's Equation, provides improved confidence interval estimation for bioavailability assays compared to intuitive inverse prediction approaches [92].
- Structured Framework Development: A systematic 4-step approach guides researchers in: (1) identifying key bioavailability factors; (2) conducting comprehensive literature reviews; (3) constructing predictive equations; and (4) validating equations for translation [6].
Experimental Protocol: Traditional Bioavailability Prediction
Objective: Develop a predictive equation for compound bioavailability using traditional statistical methods.
Materials:
- Database of compounds with known bioavailability values
- Molecular descriptor calculation software (e.g., Dragon)
- Statistical analysis software (e.g., R, SAS)
Procedure:
- Compile Bioavailability Dataset: Collect 805+ structurally diverse drug and drug-like molecules with established human oral bioavailability values [20].
- Calculate Molecular Descriptors: Generate 1,500+ molecular descriptors using specialized software, encompassing constitutional, topological, geometrical, and charge descriptors [20].
- Dataset Division: Split data into training and test sets using self-consistent methods or geometry-based algorithms that account for interactions with key proteins like P-glycoprotein and cytochrome P450 [20].
- Model Development: Apply MLR or PLS to establish relationships between molecular descriptors and bioavailability values.
- Model Validation: Use five-fold cross-validation and external test sets to verify prediction accuracy [20].
Quality Control: Ensure linear distribution of bioavailability data by applying logarithmic transformation when necessary. Remove descriptors with zero values or zero variance across compounds [91].
Advanced Capabilities: Machine Learning Approaches
Machine learning approaches have demonstrated superior performance in bioavailability prediction by capturing complex, non-linear relationships in the data.
Core Machine Learning Techniques
ML algorithms have revolutionized bioavailability prediction through several advanced methodologies:
- Ensemble Methods: Random Forest consistently demonstrates high predictive performance, with R² values up to 0.87 in drug bioavailability prediction [77].
- Consensus Modeling: Combining multiple Random Forest models improves prediction accuracy, achieving state-of-the-art performance on independent test sets [91].
- Advanced Neural Networks: Bayesian Neural Networks (BNNs) provide probabilistic frameworks that incorporate uncertainty quantification for robust predictions [93].
- Interpretability Features: SHapley Additive exPlanations (SHAP) algorithm identifies influential molecular descriptors, revealing that topological polar surface area and solubility are critical factors [77] [91].
Experimental Protocol: Machine Learning Bioavailability Prediction
Objective: Implement a machine learning workflow for accurate bioavailability prediction of novel compounds.
Materials:
- Curated dataset of drug molecules with bioavailability measurements
- Molecular descriptor calculation package (e.g., Mordred)
- Machine learning platform (e.g., KNIME Analytics Platform, Python with scikit-learn)
- High-performance computing resources for model training
Procedure:
- Data Preparation: Collect 1,588+ drug molecules with human oral bioavailability data. Calculate 1,143+ 2D molecular descriptors and fingerprints after removing zero-variance features [91].
- Data Preprocessing: Handle categorical variables using one-hot encoding, normalize features via Min-Max scaling, and detect outliers using Elliptic Envelope technique [93]. Address class imbalance with Synthetic Minority Over-sampling Technique (SMOTE) [94].
- Model Training: Implement multiple ML algorithms (Random Forest, XGBoost, Gradient Boosting) with 5-fold cross-validation. Optimize hyperparameters using Stochastic Fractal Search or grid search [77] [93].
- Model Validation: Evaluate performance on independent test sets using accuracy, sensitivity, specificity, and Matthews Correlation Coefficient [91].
- Model Interpretation: Apply SHAP analysis to identify influential molecular descriptors and validate biological plausibility [91] [94].
Quality Control: Adhere to FAIR (Findable, Accessible, Interoperable, Reusable) data principles. Use train-test splits that maintain chemical diversity and prevent data leakage [77].
Quantitative Performance Comparison
Table 1: Comparative Performance of Traditional Statistical vs. Machine Learning Approaches for Bioavailability Prediction
| Method | Dataset Size | Key Algorithms | Performance Metrics | Interpretability | Best Use Cases |
|---|---|---|---|---|---|
| Traditional Statistical | 805 compounds [20] | Multiple Linear Regression (MLR), Partial Least Squares (PLS) | R² = 0.60-0.64, SEE = 0.31-0.40 [20] | High - Direct relationship between descriptors and bioavailability | Small datasets, linear relationships, regulatory applications |
| Machine Learning | 1,588 compounds [91] | Random Forest, XGBoost, Bayesian Neural Networks | R² = 0.87, Accuracy = 84-90% [77] [36] [91] | Medium - Requires SHAP/LIME for interpretation | Large datasets, complex non-linear relationships, early screening |
| Consensus ML | 475 drug-like compounds [77] | Ensemble of Multiple Random Forest models | Accuracy = 87.4%, AUC = 0.949 [94] | Medium-High - Consensus improves reliability | High-stakes predictions where accuracy is critical |
Table 2: Key Molecular Descriptors for Bioavailability Prediction Identified by Different Approaches
| Descriptor Category | Traditional Statistical Emphasis | Machine Learning Identification | Biological Significance |
|---|---|---|---|
| Solubility-Related | Distribution coefficients, Log P [20] | Dose number, Solubility [36] | Gastrointestinal dissolution and absorption |
| Permeability-Related | Molecular size, Hydrogen bonding [20] | Topological polar surface area, Effective permeability [77] [36] | Intestinal membrane permeation |
| Metabolism-Related | Structural fingerprints [20] | Features related to first-pass metabolism [91] | Hepatic and intestinal metabolism |
| Structural | Constitutional descriptors, Topological indices [20] | Molecular fingerprints, 3D-MoRSE descriptors [20] | Overall molecular properties affecting absorption |
Workflow Visualization
Workflow Selection for Bioavailability Prediction
ML Bioavailability Prediction Pipeline
Table 3: Essential Research Resources for Bioavailability Prediction Research
| Resource Category | Specific Tools & Databases | Application in Research | Key Features |
|---|---|---|---|
| Molecular Descriptor Software | Dragon Professional, Mordred, RDKit | Calculate 1,500+ molecular descriptors from compound structures | Generates constitutional, topological, geometrical descriptors essential for both traditional and ML models [20] [91] |
| Bioavailability Databases | Hou's Bioavailability Database, ChEMBL, FDA Drug Labels | Provide curated datasets of compounds with experimental bioavailability values | Contains 805-1,588+ drug molecules with human oral bioavailability data for model training [20] [91] [95] |
| Traditional Statistical Software | R, SAS, Python (statsmodels) | Implement MLR, PLS, and calibration curve statistics | Provides Abductive Method for improved confidence intervals in calibration curves [92] [20] |
| Machine Learning Platforms | KNIME Analytics Platform, Python (scikit-learn), WEKA | Develop and validate ML models with workflows | Supports Random Forest, XGBoost, BNN algorithms with hyperparameter optimization [77] [93] |
| Model Interpretation Tools | SHAP, LIME, Partial Dependence Plots | Explain ML model predictions and identify key descriptors | Reveals critical molecular descriptors like topological polar surface area [91] [94] |
Application Notes and Implementation Guidelines
Protocol Selection Criteria
Choosing between traditional statistical and machine learning approaches requires careful consideration of several factors:
- Dataset Size: Traditional methods perform adequately with 500-800 compounds, while ML approaches benefit from 1,000+ compounds for optimal performance [20] [91].
- Relationship Complexity: Linear relationships are adequately modeled with MLR/PLS, while complex non-linear interactions require Random Forest or Neural Networks [20] [77].
- Interpretability Needs: Regulatory applications often prefer traditional models for their transparency, while early screening prioritizes ML accuracy [6] [95].
- Computational Resources: Traditional methods require minimal resources, while ML approaches need significant computational power for training and optimization [77] [93].
Implementation Challenges and Solutions
Data Quality Assurance: Both approaches require high-quality, curated datasets. Implement rigorous outlier detection using Elliptic Envelope technique and address class imbalance with SMOTE [93] [94].
Model Validation: Employ external test sets in addition to cross-validation to ensure generalizability. Use independent datasets from different geographic regions to test model robustness [96] [95].
Integration with Experimental Workflows: Develop standalone applications that integrate prediction models with structural similarity search and alternative compound suggestions to facilitate practical decision-making [95].
The evolution from traditional statistical methods to machine learning approaches has significantly enhanced our ability to predict bioavailability accurately. Traditional methods provide interpretable, validated equations suitable for regulated environments and smaller datasets. In contrast, machine learning approaches deliver superior predictive accuracy for complex, high-dimensional data, enabling more effective early-stage screening of drug candidates. The future of bioavailability prediction lies in hybrid approaches that leverage the strengths of both paradigms, along with continued refinement of interpretability features to build researcher confidence in ML predictions. As datasets grow and algorithms advance, the integration of these complementary approaches will accelerate the development of safer, more effective therapeutics.
Conclusion
The development of predictive bioavailability equations is rapidly evolving from traditional statistical methods toward sophisticated machine learning and AI-driven approaches. The integration of frameworks like the 4-step methodology with advanced computational techniques such as LSTM networks, QSAR modeling, and hybrid algorithms demonstrates significant potential for enhancing prediction accuracy. These advancements are paving the way for more precise nutritional recommendations, optimized drug formulations, and personalized dosing strategies. Future directions should focus on expanding high-quality human datasets, improving model interpretability, and facilitating the translation of these predictive tools into clinical practice and food policy. The convergence of nutritional science, pharmacology, and artificial intelligence promises to revolutionize how we assess and optimize bioavailability for improved health outcomes.
References
- 1. Drug Bioavailability - StatPearls - NCBI Bookshelf - NIH [https://www.ncbi.nlm.nih.gov/books/NBK557852/]
- 2. Bioavailability [https://en.wikipedia.org/wiki/Bioavailability]
- 3. What is Bioavailability? Difference Between ... [https://wellbeingnutrition.com/blogs/essentials/bioavailability-vs-absorption?srsltid=AfmBOorO-ZtYkFx2msRiCLsgdqqTeCCPBvq6BijVfwImqNbLOFKGOUY3]
- 4. Perspective: Framework for Developing Prediction for... Equations [https://pubmed.ncbi.nlm.nih.gov/40683371/]
- 5. Combined Methodologies for Determining In Vitro ... [https://pmc.ncbi.nlm.nih.gov/articles/PMC8597939/]
- 6. Framework for Developing Prediction Equations ... [https://www.sciencedirect.com/science/article/pii/S2161831325001176]
- 7. Algorithms to Estimate Bioavailability of Nutrients from Foods [https://ilsiuscanada.org/publication/algorithms-to-estimate-bioavailability-of-nutrients-from-foods/]
- 8. Evaluation of new predictive equations for energy ... [https://pubmed.ncbi.nlm.nih.gov/40633470/]
- 9. Development of New Equation for Predicting State ... [https://www.mdpi.com/2072-6643/17/3/482]
- 10. Development and cross-validation of predictive equations ... [https://www.frontiersin.org/journals/nutrition/articles/10.3389/fnut.2025.1499752/full]
- 11. Predict Human Oral Drug Bioavailability | In-Vitro Assay [https://cn-bio.com/applications/adme/drug-bioavailability/]
- 12. QSAR Models for Predicting Oral Bioavailability and ... [https://www.mdpi.com/2039-4713/15/5/166]
- 13. Conducting a Human Health Risk Assessment [https://www.epa.gov/risk/conducting-human-health-risk-assessment]
- 14. Development of an Evidence-Based Risk Assessment ... [https://pmc.ncbi.nlm.nih.gov/articles/PMC10080579/]
- 15. Design and implementation of a standardized framework to ... [https://pubmed.ncbi.nlm.nih.gov/29718407/]
- 16. Session 7 – Predicting Bioavailability for Micronutrients ... [https://ilsi.org/ilsi-us-can-2025-annual-meeting/session-7-predicting-bioavailability-for-micronutrients-and-bioactives/]
- 17. Plant bioactive compounds: Extraction, biological activities, ... [https://www.frontiersin.org/journals/nutrition/articles/10.3389/fnut.2025.1659743/full]
- 18. W4002: Nutrient Bioavailability--Phytonutrients and Beyond [https://nimss.org/projects/view/mrp/outline/18472]
- 19. Prediction of absolute bioavailability of medicines in children [https://www.explorationpub.com/Journals/eds/Article/100868]
- 20. A Novel Chemometric Method for the Prediction of Human ... [https://www.mdpi.com/1422-0067/13/6/6964]
- 21. Optimal Descriptors for Oral Bioavailability Prediction [https://journals.plos.org/plosone/article?id=10.1371/journal.pone.0040654]
- 22. HobPre: accurate prediction of human oral bioavailability for ... [https://jcheminf.biomedcentral.com/articles/10.1186/s13321-021-00580-6]
- 23. Bioavailability & Solubility: The Promise of Novel Ingredients [https://www.hovione.com/press-room/article/special-feature-bioavailability-solubility-promise-novel-ingredients]
- 24. Overcoming Challenges in Small-Molecule Drug ... [https://www.mdpi.com/1422-0067/25/23/13121]
- 25. Artificial intelligence-enhanced bioavailability studies [https://www.sciencedirect.com/science/article/abs/pii/S0924224425003395]
- 26. Advancing drug development with “Fit-for-Purpose” modeling ... [https://pmc.ncbi.nlm.nih.gov/articles/PMC12436579/]
- 27. Development of multiple microbiome biomarkers using ... [https://pubmed.ncbi.nlm.nih.gov/40996450/]
- 28. A machine learning-based framework for predicting ... [https://www.nature.com/articles/s41598-025-06723-1]
- 29. multiMarker: software for modelling and prediction of ... [https://bmcbioinformatics.biomedcentral.com/articles/10.1186/s12859-021-04394-z]
- 30. QSAR Models for Predicting Oral Bioavailability and ... [https://pubmed.ncbi.nlm.nih.gov/41149752/]
- 31. Machine learning-based prediction of pharmacokinetic ... [https://link.springer.com/article/10.1007/s41870-024-02314-x]
- 32. Construction of An Oral Bioavailability Prediction Model ... [https://pubmed.ncbi.nlm.nih.gov/38430955/]
- 33. Utilization of Machine Learning Approaches for Drug ... [https://pubmed.ncbi.nlm.nih.gov/40968579/]
- 34. Application of machine learning to predict unbound drug ... [https://www.frontiersin.org/journals/drug-discovery/articles/10.3389/fddsv.2024.1360732/full]
- 35. A machine learning approach to population ... [https://www.nature.com/articles/s43856-025-01054-8]
- 36. Machine learning driven bioequivalence risk assessment ... [https://www.sciencedirect.com/science/article/pii/S0939641124003795]
- 37. Comparative evaluation of hybrid LSTM-Based Models for ... [https://www.sciencedirect.com/science/article/pii/S002364382500622X]
- 38. Microwave-assisted extraction: Recent advances in ... [https://www.sciencedirect.com/science/article/pii/S2772826925000677]
- 39. A CNN and Bi-LSTM-Based Method for Predicting Multi ... [https://www.mdpi.com/1424-8247/15/6/707]
- 40. Supercritical Techniques for Pharmaceutical Applications [https://www.mdpi.com/1999-4923/16/12/1551]
- 41. PLA/PLGA-Based Drug Delivery Systems Produced with ... [https://pmc.ncbi.nlm.nih.gov/articles/PMC7699691/]
- 42. Application Notes [https://www.supercriticalfluids.com/technical-resources/applications-notes/]
- 43. Predicting drug solubility in supercritical carbon dioxide ... [https://www.nature.com/articles/s41598-025-24006-7]
- 44. Nanocarrier Drug Delivery Systems: Characterization ... [https://pmc.ncbi.nlm.nih.gov/articles/PMC9026217/]
- 45. Recent innovations in nanomedicine and nano-based ... [https://pmc.ncbi.nlm.nih.gov/articles/PMC12501479/]
- 46. A new feature selection method using deep learning and ... [https://www.sciencedirect.com/science/article/abs/pii/S0950705125013772]
- 47. An experimental comparison of feature selection methods ... [https://www.sciencedirect.com/science/article/pii/S0010482515002917]
- 48. Feature selection methods affect the performance of ... [https://www.nature.com/articles/s41592-025-02624-3]
- 49. An Experiment on Feature Selection using Logistic ... [https://arxiv.org/html/2402.00201v1]
- 50. Hyperparameter Optimization in Machine Learning [https://arxiv.org/abs/2410.22854]
- 51. Hyperparameter Tuning [https://www.geeksforgeeks.org/machine-learning/hyperparameter-tuning/]
- 52. Enhancing molecular property prediction through data ... [https://pmc.ncbi.nlm.nih.gov/articles/PMC12574261/]
- 53. 10 Essential Data Visualization Best Practices for 2025 [https://www.timetackle.com/data-visualization-best-practices/]
- 54. Circannual Rhythms Affect the Bioavailability of Phenolic ... [https://pmc.ncbi.nlm.nih.gov/articles/PMC12512188/]
- 55. Enhancing drug discovery with AI: Predictive modeling of ... [https://www.sciencedirect.com/science/article/pii/S2949866X24001187]
- 56. QSAR Models for Predicting Oral Bioavailability and ... [https://pmc.ncbi.nlm.nih.gov/articles/PMC12565085/]
- 57. Advanced hybrid intelligence evaluation of nanomedicine ... [https://pmc.ncbi.nlm.nih.gov/articles/PMC12316898/]
- 58. A hybrid modeling approach for assessing mechanistic ... [https://www.nature.com/articles/s41598-021-90637-1]
- 59. The Bioavailability of Drugs—The Current State ... [https://pmc.ncbi.nlm.nih.gov/articles/PMC10745386/]
- 60. Solubility & Bioavailability: Difficult Beasts to Tame [https://drug-dev.com/special-feature-solubility-bioavailability-difficult-beasts-to-tame/]
- 61. Optimized Extraction Protocols for Bioactive Antioxidants ... [https://www.mdpi.com/2304-8158/14/3/453]
- 62. A multifaceted review on extraction optimization ... [https://pmc.ncbi.nlm.nih.gov/articles/PMC12583990/]
- 63. Key trends and technologies in drug delivery for 2025 and ... [https://www.europeanpharmaceuticalreview.com/article/254459/key-trends-and-technologies-in-drug-delivery-for-2025-and-beyond/]
- 64. Revolutionizing Drug Delivery: The Promise of Self ... [https://pubmed.ncbi.nlm.nih.gov/40873368/]
- 65. Predictive Modeling for Small-Molecule Formulation ... [https://www.pharmtech.com/view/predictive-modeling-for-small-molecule-formulation-development-using-advanced-algorithms]
- 66. The future of pharmaceuticals: Artificial intelligence in drug ... [https://www.sciencedirect.com/science/article/pii/S2095177925000656]
- 67. Integrating artificial intelligence into small molecule ... [https://www.nature.com/articles/s44386-025-00029-y]
- 68. Integrating artificial intelligence in drug discovery and early ... [https://biomarkerres.biomedcentral.com/articles/10.1186/s40364-025-00758-2]
- 69. Machine learning methods for prediction of food effects on ... [https://www.sciencedirect.com/science/article/pii/S0928098721003213]
- 70. External validation of prognostic models: what, why, how, ... [https://pmc.ncbi.nlm.nih.gov/articles/PMC7857818/]
- 71. Classification vs Regression [https://www.ibm.com/think/topics/classification-vs-regression]
- 72. Evaluation/Performance metrics — Regression vs ... [https://medium.com/@abhilashagulhane111/data-science-evaluation-performance-metrics-regression-vs-classification-model-6b0192ba1ce2]
- 73. - GeeksforGeeks Regression Metrics [https://www.geeksforgeeks.org/machine-learning/regression-metrics/]
- 74. | Aman Kharwal Regression Performance Evaluation Metrics [https://amanxai.com/2023/10/11/regression-performance-evaluation-metrics/]
- 75. Evaluation Metrics in Machine Learning [https://www.geeksforgeeks.org/machine-learning/metrics-for-machine-learning-model/]
- 76. 12 Important Model Evaluation Metrics for Machine ... [https://www.analyticsvidhya.com/blog/2019/08/11-important-model-evaluation-error-metrics/]
- 77. Machine learning-driven bioavailability prediction in early ... [https://pubmed.ncbi.nlm.nih.gov/40391875/]
- 78. New Anthropometry-Based Formulae to Predict 24 h ... [https://pubmed.ncbi.nlm.nih.gov/41156536/]
- 79. New Anthropometry-Based Formulae to Predict 24 h ... [https://www.mdpi.com/2072-6643/17/20/3284]
- 80. Validity of predictive equations for 24-h urinary sodium ... [https://pmc.ncbi.nlm.nih.gov/articles/PMC3831536/]
- 81. Prediction of 24-hour sodium excretion from spot urine ... [https://pmc.ncbi.nlm.nih.gov/articles/PMC6968953/]
- 82. Development and double cross-validation of new spot ... [https://pmc.ncbi.nlm.nih.gov/articles/PMC8166012/]
- 83. Development and Validation of a Prediction Model ... [https://www.sciencedirect.com/science/article/pii/S1051227624002073]
- 84. Evaluation of Equations for Predicting 24-Hour Urinary ... [https://www.sciencedirect.com/science/article/pii/S0022316623006831]
- 85. New Anthropometry-Based Formulae to Predict 24 h Sodium ... [https://pmc.ncbi.nlm.nih.gov/articles/PMC12566651/]
- 86. Using Confidence Intervals to Support ... [https://pmc.ncbi.nlm.nih.gov/articles/PMC10954928/]
- 87. Machine learning generalizability across healthcare settings [https://www.nature.com/articles/s41746-022-00614-9]
- 88. Tutorial on model selection and validation of model input into ... [https://pmc.ncbi.nlm.nih.gov/articles/PMC10725261/]
- 89. 7 Types of Comparison Charts for Effective Data Visualization [https://ninjatables.com/types-of-comparison-charts/?srsltid=AfmBOorYZVl-2oa_hy2ozjX015s1eMZ9BICJ0AkgZWf11xCtYjtf7-lM]
- 90. Top 6 Visualizations for Quantitative Data Analysis Methods [https://chartexpo.com/blog/quantitative-data-analysis-methods]
- 91. HobPre: accurate prediction of human oral bioavailability ... [https://pmc.ncbi.nlm.nih.gov/articles/PMC8740492/]
- 92. Abductive statistical methods improve the results of ... [https://pmc.ncbi.nlm.nih.gov/articles/PMC9218172/]
- 93. Development of several machine learning based models ... [https://www.nature.com/articles/s41598-025-13090-4]
- 94. Machine learning and SHAP value interpretation for predicting ... [https://pmc.ncbi.nlm.nih.gov/articles/PMC12307172/]
- 95. Machine learning-based quantitative prediction of drug ... [https://www.nature.com/articles/s41746-022-00639-0]
- 96. Validation of machine learning models for heavy metals ... [https://pure.kfupm.edu.sa/en/publications/validation-of-machine-learning-models-for-heavy-metals-bioavailab/]