Developing a Quantum-Dot-Based Sandwich Lateral Flow Immunoassay for Shrimp Tropomyosin: A Comprehensive Guide from Principle to Practice
This article provides a comprehensive resource for researchers and scientists developing rapid, sensitive detection methods for the major shrimp allergen, tropomyosin.
Developing a Quantum-Dot-Based Sandwich Lateral Flow Immunoassay for Shrimp Tropomyosin: A Comprehensive Guide from Principle to Practice
Abstract
This article provides a comprehensive resource for researchers and scientists developing rapid, sensitive detection methods for the major shrimp allergen, tropomyosin. It covers the foundational principles of the quantum-dot-based sandwich lateral flow immunoassay (LFIA), detailing the assay's configuration for superior sensitivity and specificity. A step-by-step methodological guide is presented, from probe conjugation to strip assembly, followed by in-depth troubleshooting and optimization strategies to overcome common challenges like photobleaching and background noise. The content concludes with a rigorous validation framework and a comparative analysis against other techniques like ELISA and immuno-PCR, highlighting the assay's performance in detecting tropomyosin in complex, processed food matrices. This guide synthesizes current research to empower professionals in creating robust, point-of-care diagnostic tools for food safety.
Tropomyosin Detection and QD-LFIA Fundamentals: Building the Basis for a Sandwich Assay
Why Tropomyosin is a Critical Public Health Allergen in Shrimp and Shellfish
Tropomyosin is a highly conserved actin-binding protein found in both muscle and non-muscle cells of invertebrate species, with a subunit molecular weight of approximately 33-38 kDa [1]. In the context of public health, invertebrate tropomyosin has been identified as the major allergen in crustacean shellfish, responsible for up to 80% of shrimp allergy cases [2]. This protein exhibits remarkable heat stability and resistance to proteolytic digestion, allowing it to retain its allergenic potential even after food processing and cooking [1]. Shellfish allergy is a significant global health concern, with population studies across Asia showing prevalence rates ranging from 0.17% to 5.23% in different age groups [3].
The public health impact of tropomyosin extends beyond its role as a primary food allergen due to its nature as a pan-allergen - a single protein capable of triggering cross-reactive allergic responses across multiple species [1]. Tropomyosins from shrimp, house dust mites, and cockroaches share high sequence homology, with approximately 81% amino acid similarity between prawns and house dust mites, and 82% similarity between prawns and cockroaches [3]. This molecular similarity creates a significant diagnostic and management challenge in clinical practice, as individuals sensitized to inhaled tropomyosin from environmental sources may display IgE reactivity to shellfish tropomyosin without necessarily experiencing clinical symptoms upon consumption [4] [5].
Molecular Characteristics and Cross-Reactivity Profile
Structural Basis of Allergenicity
Tropomyosin possesses a unique molecular structure that underpins its allergenic potential. The native protein consists of two polypeptide chains arranged in a coiled-coil, rod-like configuration that is almost completely alpha-helical except for short segments of random coil at the N- and C-terminals [1]. These end-region sequences are responsible for the head-to-tail polymerization of the protein and contain critical IgE-binding epitopes [3]. The protein is notably rich in arginine and lysine residues, which contributes to its stability and immunoreactivity [1].
Research has identified multiple IgE-binding epitopes on shrimp tropomyosin (Pen a 1), with sequences 145-164 and 263-280 proposed as major immunoglobulin E epitopes capable of inhibiting IgE-binding reactivity in sera from shrimp-allergic individuals [3]. The conservation of these epitopic regions across invertebrate species forms the molecular basis for the extensive cross-reactivity observed in clinical settings.
Cross-Reactivity Patterns
The cross-reactivity profile of tropomyosin creates a complex clinical landscape, as illustrated in the table below:
Table 1: Cross-Reactivity Patterns of Tropomyosin from Various Species
| Species | Tropomyosin Designation | Sequence Identity to Shrimp Tropomyosin | Clinical Cross-Reactivity |
|---|---|---|---|
| Shrimp | Pen a 1, Pen m 1 | Reference (100%) | Primary sensitizer |
| Crab | Por p 1 | 91-100% | High cross-reactivity |
| Lobster | Hom a 1 | 91-100% | High cross-reactivity |
| House Dust Mite | Der p 10, Blo t 10 | 78.5-81.7% | Significant cross-reactivity |
| Cockroach | Bla g 7 | 82.4% | Significant cross-reactivity |
| Snail | Hel as 1 | 63.7% | Moderate cross-reactivity |
| Vertebrate (Fish) | Ore m 4 | 57.4% | Limited or no cross-reactivity |
While tropomyosins from crustacean shellfish (shrimp, crab, lobster) demonstrate nearly identical sequences and consequently strong IgE cross-reactivity, the cross-reactivity between shellfish and house dust mites, though significant, is less pronounced due to variations in critical IgE epitopes [3]. This explains why individuals with house dust mite sensitivity may exhibit positive IgE tests to shellfish without necessarily experiencing clinical reactions upon ingestion - a phenomenon characterized as asymptomatic sensitization [4] [5].
Public Health Burden and Diagnostic Challenges
Global Prevalence and Clinical Manifestations
Shellfish allergy represents a substantial public health burden worldwide, with varying prevalence across different regions. The clinical presentation of tropomyosin-mediated allergy spans a spectrum from mild oral symptoms to life-threatening anaphylaxis:
Table 2: Global Prevalence and Clinical Features of Shellfish Allergy
| Region/Country | Prevalence | Population Studied | Common Clinical Features |
|---|---|---|---|
| Philippines | 5.12% | Teenagers (14-16 years) | Systemic reactions |
| Singapore | 5.23% | Teenagers (14-16 years) | Oral allergy syndrome predominance |
| Taiwan | 7.71% | Children (4-18 years) | Mixed presentations |
| Thailand | 0.88% | Young children (3-7 years) | Oral symptoms |
| United States | 2.0-6.0% | General population | Systemic reactions |
| Germany | 2.6% (sensitization) | General population | Mostly asymptomatic sensitization |
A unique feature observed in Asian populations is the predominance of milder reactions localized to the oral mucosa, characterized by lip itching and swelling, similar to the oral allergy syndrome seen in pollen-food allergy syndrome [3]. This pattern has been postulated to result from primary sensitization to inhaled house dust mite tropomyosin in warm, humid climates, with subsequent cross-reaction to shellfish tropomyosin upon ingestion [3].
Diagnostic Complications
The high degree of tropomyosin cross-reactivity creates significant challenges in allergy diagnosis. Recent research demonstrates that patients with mite sensitization have higher asymptomatic IgE levels to shellfish, leading to potentially misleading diagnostic results [4] [5]. A 2025 study by Hollstein et al. found that even when tropomyosin-specific IgE (Der p 10 and Pen a 1) levels were below the standard cutoff (<0.35 kU/L), they still explained between 24% and 55% of the variance in IgE against clam, crab, German cockroach, and shrimp [4] [5].
This cross-reactivity can result in false-positive diagnostic tests for shellfish allergy when using whole allergen extracts, particularly in individuals with perennial mite or cockroach allergy [4] [5]. The complexity of tropomyosin-mediated cross-reactivity necessitates component-resolved diagnostics that can distinguish between primary sensitization and cross-reactive responses, enabling more accurate clinical management.
Quantum-Dot-Based Sandwich Lateral Flow Immunoassay for Tropomyosin Detection
Principle and Advantages
The quantum-dot-based sandwich lateral flow immunoassay (LFIA) represents a significant advancement in tropomyosin detection technology, offering a rapid, sensitive, and user-friendly platform for allergen monitoring in food products [2]. This methodology employs carboxylated quantum dots conjugated with anti-tropomyosin polyclonal antibodies as fluorescent probes, leveraging the exceptional optical properties of quantum dots, including narrow emission spectra, wide excitation range, and high fluorescence quantum yield [2].
Compared to conventional gold nanoparticle-based LFIA, the quantum-dot-based approach offers substantially improved sensitivity, with an instrumental detection limit of 0.01 μg mL⁻¹ compared to 0.05-0.5 μg mL⁻¹ for traditional methods [2]. The sandwich assay format is particularly suited for detecting tropomyosin due to the protein's large molecular size, providing better specificity and reduced susceptibility to matrix effects compared to competitive formats [2].
Figure 1: Workflow of QD-based Sandwich LFIA for Tropomyosin Detection
Detailed Protocol for QD-Based Tropomyosin LFIA
Materials and Reagents
Table 3: Essential Reagents for QD-Based Tropomyosin LFIA
| Reagent/Material | Specification | Function/Purpose |
|---|---|---|
| CdSe/ZnS Quantum Dots | Carboxyl-modified, core-shell | Fluorescent signal label |
| Tropomyosin Standard | Recombinant or purified from shrimp | Calibration and quality control |
| Anti-Tropomyosin pAb | Rabbit polyclonal IgG | Detection and capture antibody |
| EDC/Sulfo-NHS | >98% purity | Cross-linking for QD-antibody conjugation |
| Nitrocellulose Membrane | Pore size 8-15 μm | Chromatographic matrix for test/control lines |
| Sample Pad | Glass fiber | Sample application and filtration |
| Conjugate Pad | Glass fiber or polyester | Storage of QD-pAb conjugates |
| Absorption Pad | Cellulose | Fluid movement and waste containment |
| PBS Buffer | 0.01 M, pH 7.4 | Diluent and running buffer |
| Tween-20 | Molecular biology grade | Surfactant to reduce non-specific binding |
Probe Preparation Protocol
Activation of Quantum Dots:
- Dilute carboxylated QDs (CdSe/ZnS) to 2 μM in 0.1 M MES buffer (pH 6.0)
- Add fresh EDC (400 mM) and Sulfo-NHS (100 mM) solutions
- Incubate with gentle shaking for 30 minutes at room temperature
- Purify activated QDs using centrifugal filtration (100 kDa MWCO)
Antibody Conjugation:
- Add anti-tropomyosin polyclonal antibody (1 mg/mL) to activated QDs at 1:50 molar ratio
- Incubate for 2 hours at room temperature with gentle mixing
- Block residual active sites with 1% BSA for 30 minutes
- Centrifuge at 12,000 × g for 10 minutes and resuspend in storage buffer (0.01 M PBS, pH 7.4, with 2% sucrose, 1% BSA, and 0.05% Tween-20)
Conjugate Pad Treatment:
- Apply QD-pAb conjugates to glass fiber conjugate pad at 5 μL/cm
- Dry overnight at 37°C under desiccation
- Store with desiccant at 4°C until use
Strip Assembly and Test Procedure
Strip Configuration:
- Assemble LFIA strip with overlapping components: sample pad (15 mm), conjugate pad (5 mm), NC membrane (25 mm), and absorption pad (20 mm)
- Dispense anti-tropomyosin pAb (1 mg/mL) as test line and goat anti-rabbit IgG (0.5 mg/mL) as control line onto NC membrane using dispense rate of 1 μL/cm
- Dry membranes at 37°C for 12 hours and store with desiccant
Testing Protocol:
- Prepare food samples by homogenizing 1 g of sample with 10 mL of extraction buffer (0.01 M PBS, pH 7.4, 0.5% Tween-20)
- Centrifuge at 10,000 × g for 10 minutes and collect supernatant
- Apply 100 μL of sample extract to the sample pad
- Allow chromatography to proceed for 10 minutes at room temperature
- Visualize results under UV light (365 nm excitation) or using a portable fluorescent reader
Result Interpretation:
- Positive Result: Both test and control lines show fluorescence
- Negative Result: Only control line shows fluorescence
- Invalid Result: No fluorescence at control line, regardless of test line
Performance Characteristics and Validation
The QD-based sandwich LFIA demonstrates excellent analytical performance for tropomyosin detection:
Table 4: Performance Characteristics of QD-Based Tropomyosin LFIA
| Parameter | Performance Value | Comparative Advantage |
|---|---|---|
| Visual Detection Limit | 0.05 μg mL⁻¹ | 10-fold improvement over AuNP-LFIA |
| Instrumental Detection Limit | 0.01 μg mL⁻¹ | Suitable for trace detection |
| Detection Time | <10 minutes | Rapid screening |
| Specificity | No cross-reactivity with non-target species | High specificity for crustacean TM |
| Intra-assay CV | 8.87%-11.9% | Good reproducibility |
| Inter-assay CV | 7.75%-21.12% | Acceptable batch-to-batch variation |
| Matrix Effects | Detected 0.045 μg g⁻¹ in processed foods | Robust performance in complex matrices |
The assay has been successfully validated for detection of tropomyosin in various processed food matrices, including roast fish fillet, boiled meatballs, and steamed meatballs, demonstrating its practical utility for monitoring allergen contamination in food processing environments [2]. The method detected 8 of 9 real food samples that were identified as tropomyosin-positive by validated ELISA methods, confirming its reliability for food safety applications [2] [6].
Research Reagent Solutions Toolkit
Table 5: Essential Research Reagents for Tropomyosin Detection and Analysis
| Reagent/Category | Specific Examples | Research Application |
|---|---|---|
| Antibody Reagents | Rabbit anti-TM pAb, Anti-TM mAb | Capture/detection in immunoassays |
| Labeling Materials | Carboxylated QDs (CdSe/ZnS), Gold nanoparticles | Signal generation in biosensors |
| Cross-linking Reagents | EDC, Sulfo-NHS | Conjugation chemistry for probe preparation |
| Chromatographic Materials | Nitrocellulose membrane (8-15 μm), Glass fiber pads | LFIA strip components |
| Allergen Standards | Recombinant TM, Purified native TM | Assay calibration, quality control |
| Detection Instruments | Portable fluorescent readers, UV lamps (365 nm) | Signal measurement and visualization |
| Buffer Systems | PBS (0.01 M, pH 7.4), MES buffer (pH 6.0) | Extraction, conjugation, and running buffers |
Implications for Public Health and Future Directions
The development of sensitive, rapid detection methods for tropomyosin has significant implications for public health protection, particularly for individuals with shellfish allergy who must strictly avoid allergen exposure. The quantum-dot-based LFIA technology enables food manufacturers to implement effective allergen control programs through rapid monitoring of processing environments and final products, supporting compliance with food allergen labeling regulations such as the Food Allergen Labeling and Consumer Protection Act [2].
Future research directions in tropomyosin detection include the development of multiplexed platforms capable of simultaneously detecting multiple allergens, integration with smartphone-based readout systems for point-of-care testing, and the application of novel nanomaterial labels to further enhance sensitivity [8] [9]. Additionally, the growing understanding of tropomyosin cross-reactivity patterns may inform the development of novel immunotherapeutic approaches for shellfish allergy, potentially leveraging the cross-reactive epitopes to induce desensitization or tolerance to multiple allergen sources [3] [1].
As the prevalence of shellfish allergy continues to rise globally, the availability of reliable, rapid detection methods for tropomyosin will play an increasingly critical role in protecting public health and ensuring the safety of food products for allergic consumers.
The Limitations of Traditional Allergen Detection Methods (ELISA, PCR, and Gold-Nanoparticle LFIA)
The accurate detection of food allergens is a critical public health issue, impacting an estimated 220 million people worldwide who suffer from food allergies [10]. For individuals allergic to crustaceans such as shrimp, tropomyosin (TPM) is the primary allergen, responsible for 72-98% of diagnosed ingestion-related shellfish allergies [10]. This heat-stable protein remains intact even after harsh food processing, posing a significant health risk to consumers [10]. Avoiding allergenic ingredients is the most effective treatment, making reliable detection methods essential for accurate food labeling and consumer protection [10].
Traditional methods for allergen detection include enzyme-linked immunosorbent assays (ELISA), polymerase chain reaction (PCR), and gold nanoparticle-based lateral flow immunoassays (LFIA). While these techniques have formed the backbone of food allergen analysis for years, they possess significant limitations in sensitivity, specificity, and practicality that can compromise their effectiveness in protecting sensitive individuals. This application note critically examines these limitations within the context of developing more advanced detection systems, specifically quantum-dot-based sandwich lateral flow immunoassays for shrimp tropomyosin.
Critical Analysis of Traditional Methods
The table below summarizes the core limitations of three traditional allergen detection methods.
Table 1: Performance Comparison of Traditional Allergen Detection Methods
| Method | Key Limitations | Typical Sensitivity Range | Major Constraints | |
|---|---|---|---|---|
| ELISA | - Moderate sensitivity [10]- Potential for antibody cross-reactivity [11]- Time-consuming procedures [12] | LOD: 27.3 pg/mL (for a developed sandwich ELISA) [10] | - Relies on antibody availability and quality [11]- Not ideal for rapid, on-site testing [12] | |
| PCR | - Detects DNA, not the allergenic protein itself [13]- Protein presence may not correlate with DNA [13]- Requires sophisticated equipment [12] | (Not directly comparable as it targets genetic material) | - Results do not directly confirm the presence of the allergenic protein [13]- Susceptible to inhibition and DNA degradation [13] | |
| Gold-Nanoparticle LFIA | - Lower sensitivity compared to fluorescent labels [14] [15]- Subjective visual interpretation [12] | - Weak color intensity and poor colloid stability [14] | Visual LOD: 0.05 μg/mL for TM [14] | - Less suitable for detecting trace-level contaminants [14] [15]- Qualitative or semi-quantitative at best [12] |
Enzyme-Linked Immunosorbent Assay (ELISA)
ELISA is a widely used biochemical technique for quantifying allergens, but its limitations are notable. The method's moderate sensitivity can be a critical drawback when detecting trace amounts of tropomyosin in processed foods. For instance, while a novel immuno-PCR method demonstrated a Limit of Quantification (LOQ) of 19.8 pg/mL for crustacean TPM, a analogous ELISA had a significantly higher LOQ of 364 pg/mL, making it 20-fold less sensitive [10]. Furthermore, ELISA results are highly dependent on the specificity of the antibodies used. Cross-reactivity with similar proteins from other species, such as mollusks (which have 55-65% TPM sequence similarity with crustaceans), can lead to false-positive results [10] [11]. The assay also involves multiple incubation and washing steps, making it relatively time-consuming and less suitable for rapid, on-site testing compared to lateral flow platforms [12].
Polymerase Chain Reaction (PCR)
PCR targets the genetic material (DNA) of an allergenic source rather than the protein itself. This fundamental aspect is also its primary limitation. The detection of a shrimp gene does not guarantee the presence of the tropomyosin protein, and conversely, the protein could be present without detectable DNA due to processing, leading to inaccurate risk assessment [13]. The technique requires specialized and expensive equipment, including thermal cyclers, and skilled personnel to perform the analysis, confining it to centralized laboratories and eliminating its utility for point-of-care testing [12].
Gold-Nanoparticle-Based Lateral Flow Immunoassay (LFIA)
While conventional AuNP-LFIA offers advantages in speed and cost, it suffers from limited sensitivity. The visual detection limit for TPM in one developed AuNP-LFIA was 0.05 μg/mL, which is insufficient for detecting very low concentrations of allergens that could still trigger a reaction in sensitive individuals [14]. The subjective visual interpretation of the color change on the test line can lead to variations in results between different users [12]. Additionally, the weak color intensity and poor colloid stability of gold nanoparticles can further compromise the assay's reliability and sensitivity [14]. The emergence of fluorescent labels, such as quantum dots, has highlighted these shortcomings, as they offer significantly higher brightness and sensitivity [15].
Experimental Protocols for Method Evaluation
Researchers evaluating or comparing allergen detection methods can use the following standardized protocols to systematically assess their performance.
Protocol for Sandwich ELISA Evaluation of Tropomyosin
This protocol outlines the key steps for developing and validating a sandwich ELISA for shrimp tropomyosin, based on published research [10].
Table 2: Key Reagents for Sandwich ELISA
| Reagent | Function | Example |
|---|---|---|
| Capture Antibody | Binds the target protein to the solid phase | Monoclonal mouse anti-TPM antibody [10] |
| Detection Antibody | Provides specificity for secondary detection | Polyclonal rabbit anti-shrimp TPM antibody [10] |
| Secondary Antibody | Amplifies the detection signal | Alkaline phosphatase-labeled goat anti-rabbit antibody [10] |
| Protein Standard | Enables quantitative calibration | Natural shrimp tropomyosin [10] |
Procedure:
- Coating: Coat a microplate with a monoclonal mouse anti-TPM antibody diluted in an appropriate coating buffer. Incubate overnight at 4°C, then wash and block the plate to prevent non-specific binding.
- Antigen Incubation: Add the sample extract or the TPM standard solution to the plate. Incubate to allow the tropomyosin antigen to be captured by the immobilized antibody. Wash thoroughly to remove unbound materials.
- Detection Incubation: Add a polyclonal rabbit anti-shrimp TPM antibody. This antibody forms a "sandwich" complex with the captured antigen. Wash again.
- Signal Amplification & Readout: Add an alkaline phosphatase-labeled goat anti-rabbit antibody. After a final wash, add an enzyme substrate (e.g., pNPP) that produces a color change. Measure the absorbance with a plate reader.
- Data Analysis: Generate a standard curve from the TPM standard dilutions and use it to calculate the tropomyosin concentration in unknown samples.
Protocol for Traditional AuNP-LFIA Construction
This protocol describes the assembly and testing of a traditional gold nanoparticle-based LFIA for tropomyosin [14] [16].
Procedure:
- Conjugate Pad Preparation: Conjugate anti-TPM polyclonal antibodies to colloidal gold nanoparticles. The particles are typically ~20-40 nm in diameter. Disperse this conjugate onto a glass fiber conjugate pad and dry.
- Membrane Coating: Dispense a capture anti-TPM antibody in a line across a nitrocellulose membrane to form the Test (T) line. Dispense a secondary antibody (e.g., anti-rabbit IgG) to form the Control (C) line.
- Strip Assembly: Assemble the strip by attaching the sample pad, conjugate pad, nitrocellulose membrane, and absorbent pad to a backing card with overlaps to ensure capillary flow.
- Testing: Apply the liquid sample to the sample pad. The sample rehydrates and moves the gold-conjugated antibodies. If TPM is present, it binds to the conjugate and is captured at the T line, forming a visible red band. The excess conjugate is captured at the C line, validating the test.
- Analysis: Interpret the result visually within 10 minutes. The presence of the T line indicates a positive result.
Workflow and Method Selection
The following diagram illustrates the logical decision-making process for selecting an appropriate allergen detection method based on analytical needs.
The Scientist's Toolkit: Research Reagent Solutions
The table below lists essential materials and reagents for developing advanced immunoassays for allergen detection, as identified in the cited research.
Table 3: Essential Research Reagents for Advanced Allergen Immunoassay Development
| Item | Critical Function in Assay Development | Research Context |
|---|---|---|
| Monoclonal Anti-TPM Antibody | Serves as a highly specific capture antibody to ensure the assay binds the correct target protein without cross-reactivity [10]. | Used as the capture antibody in a high-sensitivity immuno-PCR assay [10]. |
| Polyclonal Anti-TPM Antibody | Often used as a detection antibody; recognizes multiple epitopes on the target protein, which can enhance sensitivity [10] [14]. | Key detection antibody in both ELISA and quantum-dot LFIA formats [10] [14]. |
| Carboxylated Quantum Dots (QDs) | Act as fluorescent labels conjugated to detection antibodies; provide superior brightness and photostability for high-sensitivity lateral flow assays [14] [15]. | Used as the signal label in a QD-LFIA for TM, achieving an instrumental LOD of 0.01 μg/mL [14]. |
| Nitrocellulose Membrane | The porous matrix that forms the core of the lateral flow strip, enabling capillary movement of the sample and conjugation of capture antibodies at test lines [12] [16]. | Fundamental component in all lateral flow immunoassay devices [12] [16]. |
| Signature Peptides (e.g., ANIQLVEK) | Unique peptide sequences from the target protein used as standards and references for mass spectrometry-based quantification, enabling high accuracy and specificity [13]. | Selected as the quantitative signature peptide for LC-MS/MS detection of tropomyosin [13]. |
| Conjugation Kits (e.g., EDC/NHS) | Chemical cross-linking kits used to covalently attach biomolecules (like antibodies) to labels (like QDs) or other surfaces efficiently and stably [14]. | Employed for conjugating rabbit anti-TM IgG with carboxylated quantum dots [14]. |
Quantum dots (QDs) are nanoscale semiconductor particles that have emerged as transformative labels in biodetection, particularly in lateral flow immunoassays (LFIAs). Their unique optical properties—including high brightness, broad excitation spectra, narrow, tunable emission, and exceptional photostability—provide a significant advantage over conventional labels like colloidal gold and latex beads. This application note details the quantitative advantages of QDs and provides a detailed protocol for developing a QD-based sandwich LFIA, framed within the context of detecting the major shrimp allergen tropomyosin.
The Core Quantum Dot Advantage: A Quantitative Comparison
The superior performance of QDs stems from their intrinsic physicochemical properties. The table below summarizes the key optical advantages that make them ideal for sensitive applications like allergen detection.
Table 1: Core Optical Properties of Quantum Dots in Biodetection
| Property | Technical Advantage | Quantitative Performance | Impact on LFIA Performance |
|---|---|---|---|
| High Photostability | Resists photobleaching under prolonged illumination; maintains signal integrity. | Minimal PL degradation (14.9% after 10 months); vastly superior to conventional dyes (87.7%) [17]. | Enables repeated scanning, archival of test strips, and reliable quantitative analysis without signal decay. |
| High Fluorescence Intensity & Quantum Yield | High extinction coefficients and efficient radiative recombination. | Fluorescence intensity in pathological tissues: 120 ± 10 AU vs. 50 ± 5 AU in controls [18]. | Provides a high signal-to-noise ratio, enabling lower detection limits and easier visual readout. |
| Broad Excitation / Narrow Emission | Can be excited by a single light source (e.g., UV lamp) while emitting precise, pure colors. | Emission spectra are typically 30-50 nm FWHM, much narrower than organic dyes (>100 nm) [19]. | Reduces background interference, allowing for multiplexing of different targets with distinct QD colors. |
| Signal Intensity & Detection Sensitivity | The brightness enables detection of low-abundance targets. | Instrumental LOD for tropomyosin: 0.01 μg mL⁻¹; Visual LOD: 0.05 μg mL⁻¹ [14] [6]. | Crucial for detecting trace allergens to protect sensitive individuals and meet regulatory requirements. |
Experimental Protocol: QD-based Sandwich LFIA for Shrimp Tropomyosin
This protocol outlines the development of a highly sensitive and rapid sandwich LFIA for the detection of shrimp tropomyosin (TM), leveraging the quantum dot advantage.
Research Reagent Solutions
Table 2: Essential Materials and Reagents
| Item | Function / Description |
|---|---|
| CdSe/ZnS Core-Shell QDs | Semiconductor nanoparticles with high quantum yield and photostability; carboxylated surface for biomolecule conjugation [14]. |
| Tropomyosin (TM) Antigen & Antibodies | The target allergen; requires a matched pair of specific anti-TM antibodies (e.g., rabbit polyclonal IgG) for the sandwich assay [14] [6]. |
| EDC and sulfo-NHS | Cross-linking reagents for activating carboxyl groups on QDs to form stable amide bonds with primary amines on antibodies [14]. |
| Nitrocellulose (NC) Membrane | Porous matrix for capillary flow and immobilization of capture antibodies at Test (T) and Control (C) lines. |
| Sample and Absorbent Pads | Cellulose components to regulate sample flow and wicking capacity, respectively. |
| Conjugate Pad | Glass fiber pad for storing the freeze-dried QD-antibody probes. |
| Fluorescence Reader / UV Lamp | For instrumental quantification or visual detection of the fluorescent signal on the test strip [20]. |
Step-by-Step Procedure
Part A: Conjugation of QDs with Detection Antibody
- Activation: Mix 1 mL of carboxylated QDs (1 mg/mL) with 500 μL of EDC (10 mg/mL) and 500 μL of sulfo-NHS (10 mg/mL). React for 30 minutes at room temperature with gentle shaking to activate the carboxyl groups.
- Purification: Remove excess EDC/NHS by centrifuging the reaction mixture using a centrifugal filter unit (e.g., 100kDa MWCO). Re-suspend the activated QDs in 1 mL of 10 mM borate buffer (pH 7.4).
- Conjugation: Add 100 μg of purified anti-TM antibody to the activated QDs. Incubate the mixture for 2 hours at room temperature or overnight at 4°C with gentle agitation.
- Blocking: Add 100 μL of 1% BSA solution to block any remaining active sites. Incubate for 30 minutes.
- Purification of Conjugates: Purify the QD-antibody conjugates using a centrifugal filter unit to remove unbound antibodies. Re-suspend the final conjugate in a storage buffer (e.g., PBS with 1% BSA, 5% sucrose) and store at 4°C until use.
Part B: Assembly of the Lateral Flow Strip
- Preparation: Affix a backing card onto a flat surface.
- Membrane Coating: Dispense the capture anti-TM antibody (e.g., 1 mg/mL) onto the NC membrane as the Test (T) line. Dispense a species-specific secondary antibody (e.g., goat anti-rabbit IgG) as the Control (C) line. Dry the membrane at 37°C for 1 hour.
- Conjugate Pad Treatment: Apply the purified QD-antibody conjugate to the conjugate pad and dry under vacuum or in a desiccator.
- Assembly: Overlap and attach the sample pad, conjugate pad, NC membrane, and absorbent pad sequentially onto the backing card. Cut the assembled card into individual strips of desired width (typically 3-4 mm) using a strip cutter.
Part C: Detection and Analysis
- Sample Application: Add 100 μL of the sample extract (or TM standard in buffer) to the sample pad.
- Development: Allow the test strip to develop for 10 minutes at room temperature.
- Signal Reading:
- Visual: Under a UV lamp (365 nm), a fluorescent band at the T line indicates a positive result. The intensity correlates with TM concentration [14].
- Instrumental: Use a fluorescence strip reader to quantitatively measure the fluorescence intensity at the T line. Generate a standard curve with known TM concentrations for accurate quantification.
Workflow and Signaling Mechanism
The following diagram illustrates the experimental workflow and the signaling mechanism of the QD-based sandwich LFIA.
Discussion: Implications for Food Safety and Beyond
The integration of QDs into LFIAs, as demonstrated in the tropomyosin detection protocol, marks a significant leap in point-of-care diagnostics. The high photostability ensures that test results can be documented and analyzed long after the initial test run, a critical feature for quality control and record-keeping [17] [21]. The intense fluorescence signal directly translates to the high sensitivity required to detect trace amounts of allergens, such as the 0.045 μg g⁻¹ of incurred TM in processed foods, ensuring the safety of sensitive individuals even in complex food matrices [14] [6]. Furthermore, the narrow emission spectra of QDs open the door for multiplexed detection of several allergens or biomarkers on a single strip, using different QDs emitting distinct colors, thereby increasing the information density of a single test [19] [20].
The quantum dot advantage in fluorescence, photostability, and signal intensity is not merely incremental but foundational, enabling a new generation of highly sensitive, quantitative, and robust lateral flow immunoassays. The detailed protocol and quantitative data provided herein offer a roadmap for researchers and developers to harness these properties, paving the way for advanced diagnostic solutions in food safety, clinical diagnostics, and beyond.
For researchers developing detection assays for large protein targets like shrimp tropomyosin, selecting the appropriate lateral flow immunoassay (LFIA) architecture is a critical first step that determines the assay's fundamental performance characteristics. Lateral flow immunoassays have become cornerstone tools in point-of-care diagnostics and food safety testing due to their unique combination of simplicity, portability, and rapid response [22]. The two principal assay formats—sandwich and competitive—operate on divergent immunological principles and are suited to different classes of analytes.
This application note provides a structured comparison between sandwich and competitive LFIA formats, with specific guidance for researchers developing quantum dot-based immunoassays for large protein allergens such as shrimp tropomyosin. We outline the theoretical foundations of each format, present optimized protocols for quantum dot-based sandwich LFIAs, and provide performance optimization strategies to achieve maximum sensitivity and specificity in food allergen detection.
Fundamental Principles and Format Selection
Sandwich Immunoassay Format
The sandwich immunoassay format is specifically designed for large analytes possessing at least two distinct antigenic epitopes [23]. This architecture employs two antibodies that bind to different epitopes on the target molecule: a detector antibody conjugated to a signal-generating nanoparticle and a capture antibody immobilized on the nitrocellulose membrane at the test line [24]. When the target protein is present in the sample, it forms a molecular "sandwich" complex—captured between the two antibodies—resulting in signal accumulation at the test line that is directly proportional to analyte concentration [23] [24].
The visual and intuitive result interpretation (line presence indicates positive result) makes this format ideal for applications requiring qualitative or semi-quantitative analysis [23]. However, researchers should note the potential for the "hook effect" at extremely high analyte concentrations, where saturation of binding sites can paradoxically cause a decrease in signal intensity [23].
Competitive Immunoassay Format
Competitive immunoassays employ a fundamentally different principle, where the target analyte in the sample competes with a reference antigen (competitor) for a limited number of antibody binding sites [25] [23]. This format is predominantly used for detecting small molecules with single antigenic determinants that cannot simultaneously bind two antibodies [22] [23]. In contrast to sandwich assays, the signal intensity at the test line is inversely proportional to analyte concentration—a stronger line indicates less analyte present, while line disappearance indicates a positive result [24].
This counterintuitive signal interpretation presents usability challenges but offers important advantages for small molecule detection, including immunity to the hook effect and the requirement for only one specific antibody [23].
Comparative Analysis: Sandwich vs. Competitive Formats
Table 1: Comprehensive comparison of sandwich and competitive LFIA formats for protein detection.
| Parameter | Sandwich Format | Competitive Format |
|---|---|---|
| Target Analytes | Large proteins (>5-10 kDa) with multiple epitopes (e.g., tropomyosin) [23] [24] | Small molecules (<1-2 kDa) with single epitopes (e.g., toxins, drugs, cortisol) [23] [26] |
| Signal Interpretation | Direct: Line presence = positive result [23] | Inverse: Line absence = positive result [23] [24] |
| Signal vs. Concentration | Directly proportional [24] | Inversely proportional [24] |
| Antibody Requirements | Two different antibodies recognizing distinct epitopes [27] | One specific antibody [23] |
| Hook Effect | Possible at very high analyte concentrations [23] | Not susceptible [23] |
| Ideal for Tropomyosin | Yes - large protein with multiple epitopes [23] [24] | No - not optimal for large multiepitope proteins [23] |
For researchers targeting large protein allergens such as shrimp tropomyosin (approximately 38 kDa), the sandwich immunoassay format represents the optimal choice [23] [24]. Its structural characteristics provide multiple accessible epitopes for simultaneous antibody binding, enabling the formation of stable sandwich complexes and generating a clear, intuitive positive signal.
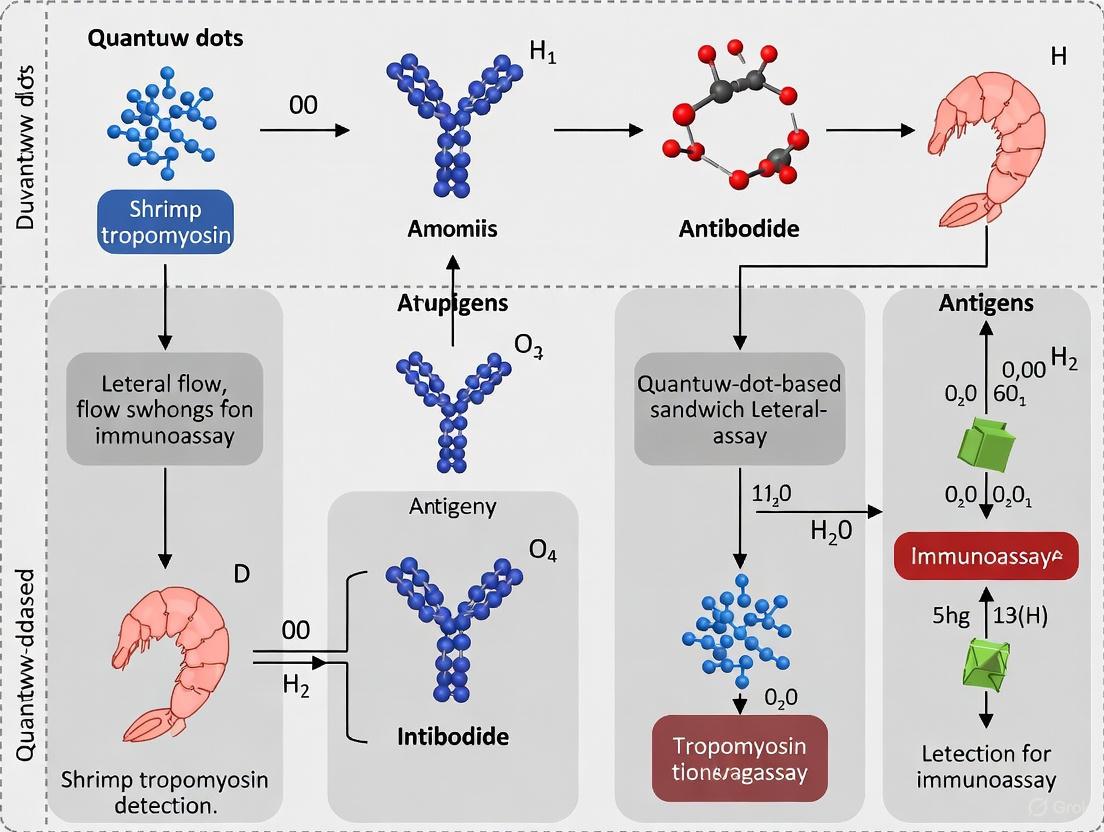
Figure 1: Schematic workflow of a quantum dot-based sandwich LFIA for shrimp tropomyosin detection. The target protein forms a complex with quantum dot-labeled antibodies in the conjugate pad, which is subsequently captured by immobilized antibodies at the test line, generating a fluorescent signal.
Protocol: Quantum Dot-Based Sandwich LFIA for Tropomyosin Detection
Materials and Reagents
Table 2: Essential reagents and materials for quantum dot-based sandwich LFIA development.
| Component | Specification | Function/Purpose |
|---|---|---|
| Antibody Pair | Monoclonal anti-tropomyosin antibodies recognizing distinct epitopes [27] | Capture and detection of target protein |
| Quantum Dots | Carboxyl-functionalized, emission 525-605 nm [28] [29] | Fluorescent signal generation |
| Nitrocellulose Membrane | Capillary flow time 135-180 sec/4 cm [27] | Platform for capillary flow and test/control lines |
| Conjugate Pad | Glass fiber, pre-treated with sucrose/trehalose [27] | Stable storage and controlled release of QD-antibody conjugates |
| Sample Pad | Glass fiber/cellulose with buffer salts [22] [27] | Sample application, filtration, and pH adjustment |
| Absorbent Pad | High-capacity cellulose [22] | Drives capillary flow by wicking excess fluid |
| Running Buffer | PBS + 0.1% Tween-20 + 1% BSA, pH 7.4 [27] | Maintains optimal pH and reduces non-specific binding |
Step-by-Step Experimental Procedure
Quantum Dot-Antibody Conjugate Preparation
- Activate Quantum Dots: Disperse 50 μL of carboxyl-functionalized QDs (10 mg/mL) in 450 μL of MOPS buffer (0.02 M, pH 6.5). Add 5 μL of EDC (50 mg/mL) and 5 μL of NHS (75 mg/mL) to activate carboxyl groups. Incubate on ice with sonication for 5 minutes [29].
- Purify Activated QDs: Centrifuge at 13,000 rpm at 18°C for 15 minutes. Discard supernatant and resuspend pellet in 500 μL MES buffer (0.02 M, pH 6.0).
- Antibody Conjugation: Add 20-50 μg of purified anti-tropomyosin detection antibody to activated QDs. Rotate mixture for 2 hours at room temperature.
- Blocking: Add 100 μL of 5% BSA for 30 minutes to block residual reactive sites.
- Purification: Centrifuge conjugate at 13,000 rpm for 15 minutes. Resuspend in storage buffer (0.01 M PBS, pH 7.4, containing 1% BSA and 10% sucrose) [29].
- Quality Assessment: Verify conjugation success using dynamic light scattering to monitor hydrodynamic diameter increase and measure fluorescence retention.
Strip Assembly and Reagent Deposition
- Membrane Preparation: Cut nitrocellulose membrane and mount on adhesive backing card. Ensure overlap of approximately 1-2 mm between all components [27].
- Antibody Deposition: Dispense capture antibody (0.5-1 mg/mL in PBS) and control antibody (anti-species, 1 mg/mL) onto membrane as test and control lines using a non-contact dispenser (e.g., BioDot Quanti BioJet) [27]. Dry overnight at 37°C.
- Conjugate Pad Preparation: Apply QD-antibody conjugate to glass fiber pad using an air-jet dispenser (e.g., BioDot AirJet Quanti). Dry for 2 hours at 37°C with desiccant [27].
- Strip Assembly: Sequentially overlap sample pad, conjugate pad, nitrocellulose membrane, and absorbent pad on backing card. Cut assembled cards into 3-5 mm wide strips using a precision cutter.
Assay Execution and Data Interpretation
- Sample Preparation: Extract shrimp samples in PBS buffer (pH 7.4) containing 0.1% Tween-20. Clarify by centrifugation at 10,000 × g for 5 minutes.
- Assay Procedure: Apply 75-100 μL of sample extract to sample pad. Allow capillary flow to develop for 10-15 minutes [29].
- Signal Detection: Visualize results under UV light (365 nm excitation) or quantify using a portable fluorescence reader.
- Result Interpretation: A visible test line and control line indicates positive result. Only control line visible indicates negative result. No control line indicates invalid test [22].
Optimization Strategies for Enhanced Performance
The 4S Sequential Experimental Design
Implement a structured optimization approach using the 4S method (START, SHIFT, SHARPEN, STOP) to systematically enhance assay sensitivity [25] [26]:
- START: Define parameter space for initial screening experiments—QD:antibody ratio, capture antibody concentration, and conjugate pad loading.
- SHIFT: Refine parameter ranges based on initial results to focus on regions yielding optimal signal intensity.
- SHARPEN: Perform fine-tuning of critical parameters to maximize sensitivity and minimize background.
- STOP: Finalize optimal conditions when further adjustments no longer provide significant improvements [25].
This sequential design of experiments (DoE) approach has demonstrated 500-fold sensitivity improvements in competitive assays and can be similarly applied to sandwich format optimization [26].
Critical Optimization Parameters
- Antibody Pair Selection: Screen multiple antibody combinations to identify pairs with synergistic binding characteristics without cross-interference [27].
- Membrane Selection: Test nitrocellulose membranes with different capillary flow times; slower flow rates typically increase sensitivity by extending antigen-antibody interaction time [27].
- Conjugate Stabilization: Optimize sugar matrix (sucrose/trehalose ratios) in conjugate pad to ensure complete resolubilization while maintaining antibody activity [22] [27].
- Blocking Agents: Evaluate different blocking agents (BSA, casein, fish gelatin) in running buffer to minimize non-specific binding without inhibiting specific interactions [27].
For researchers developing detection assays for large protein targets like shrimp tropomyosin, the sandwich LFIA format provides the optimal architecture, leveraging the multiepitope nature of proteins to create sensitive and intuitive detection systems. The integration of quantum dots as fluorescent reporters significantly enhances sensitivity compared to traditional gold nanoparticles, while the structured optimization approaches outlined enable robust assay development.
By implementing the protocols and optimization strategies described in this application note, researchers can develop highly sensitive and specific quantum dot-based sandwich LFIAs for food allergen detection, contributing to improved food safety and public health protection.
The quantum-dot-based lateral flow immunoassay (QD-LFIA) represents a significant advancement in rapid diagnostic testing, combining the simplicity of lateral flow technology with the high sensitivity of fluorescent quantum dots (QDs). This application note details the core components and methodologies for developing a sandwich QD-LFIA specifically for the detection of shrimp tropomyosin (TM), a major crustacean allergen. The guidance provided herein is essential for researchers and scientists engaged in food allergen detection, enabling the creation of highly sensitive and specific tests for monitoring allergen contamination in food products and production lines [14]. The sandwich format is particularly suitable for detecting large molecules like the 34-39 kDa tropomyosin, offering superior performance compared to competitive formats by minimizing false-negative results and reducing susceptibility to matrix effects [14].
Core Components of a QD-LFIA
Strip Architecture and Material Composition
The lateral flow strip is a multi-layered system where each component plays a critical role in ensuring consistent fluid flow and assay performance. Proper assembly is crucial for achieving reproducible results.
Table 1: Components of a QD-LFIA Strip
| Component | Material | Function | Typical Dimensions |
|---|---|---|---|
| Sample Pad | Glass fiber, cellulose | Receives the liquid sample; may include pre-treatment filters | 15-25 mm |
| Conjugate Pad | Glass fiber, polyester | Stores dried QD-antibody conjugates; releases them upon sample contact | 5-10 mm |
| Diagnostic Membrane | Nitrocellulose | Contains immobilized capture antibodies at test (T) and control (C) lines | 25-30 mm |
| Absorption Pad | Cellulose | Acts as a sink to wick fluid through the strip and ensure complete sample flow | 15-20 mm |
| Backing Card | Plastic, adhesive | Provides structural support for assembling all components | 60-70 mm total |
All components are overlapped and fixed onto an adhesive backing card to form a continuous flow path [30]. The sample pad is often pre-treated with blocking buffers (e.g., containing surfactants like Tween-20, sucrose, and proteins like BSA or casein) to minimize non-specific binding and ensure optimal release of the QD probes [31]. The flowing buffer identified for TM detection is frequently 10 mM PBS containing 1% Tween-20 [32].
Diagram 1: Material flow path and core architecture of a QD-LFIA strip.
Fluorescent Probes: Quantum Dots and Antibody Conjugation
Quantum dots are semiconductor nanocrystals that serve as superior fluorescent labels due to their broad excitation spectra, narrow emission bands, and high photostability. For sandwich QD-LFIA targeting TM, polyclonal antibodies (pAbs) are typically conjugated to carboxylated QDs (e.g., CdSe/ZnS core-shell with emission at 610±5 nm) to form the detection probe [32] [14].
Standard Conjugation Protocol (EDC/sulfo-NHS Chemistry)
This protocol describes the covalent coupling of anti-TM antibodies to QDs via carbodiimide chemistry, which links carboxyl groups on the QD surface to primary amines on the antibody [32] [14].
- Activation of QDs: Dilute carboxylated QDs in 50 mM MES buffer (pH 6.0). Add 10 mM EDC (1-Ethyl-3-(3-dimethylaminopropyl)carbodiimide) and 5 mM sulfo-NHS (N-Hydroxysulfosuccinimide) to the QD solution. Incubate for 30 minutes at room temperature with gentle mixing to activate the carboxyl groups.
- Purification: Remove excess cross-linkers by centrifuging the reaction mixture using a centrifugal filter unit (e.g., 100 kDa MWCO). Wash twice with 50 mM borate buffer (pH 7.4).
- Antibody Coupling: Resuspend the activated QDs in borate buffer. Add the purified anti-TM polyclonal antibody at a predetermined optimal ratio (e.g., 10-20 µg antibody per 25 µL of QDs). Incubate the mixture for 2 hours at room temperature or overnight at 4°C with slow shaking.
- Blocking: Add 1% BSA to the reaction to block any remaining activated esters. Incubate for 30 minutes.
- Purification of Conjugates: Purify the QD-Ab conjugates by centrifugation as in step 2, washing with a storage buffer (e.g., 10 mM PBS with 2% sucrose, 0.5% Tween-20, and 1% BSA, pH 7.4).
- Storage: Resuspend the final conjugate in storage buffer, dispense onto conjugate pads, and dry at 37°C before assembling into strips or storing at 4°C.
Advanced Protocol: Site-Specific Labeling of Antibodies
Random conjugation can hinder the antigen-binding sites (Fab regions) of antibodies, reducing immunoreactivity. Site-specific labeling directs the QDs to the crystallizable fragment (Fc) region, preserving antigen-binding capacity.
- Preparation of Photoactivated Affinity Protein: A recombinant Protein A Z domain, engineered with the unnatural amino acid p-benzoyl-l-phenylalanine (Bpa), is produced. This protein retains its Fc-binding capability.
- Covalent Fc Binding: Incubate the photoactivated affinity protein with the anti-TM monoclonal antibody. Upon UV irradiation, the Bpa moiety forms a stable covalent bond with the antibody's Fc region.
- QD Coupling: The affinity protein is engineered with a free cysteine handle. This thiol group is then coupled to maleimide-functionalized QDs, achieving site-specific labeling at the Fc terminal.
- Validation: Studies confirm that this directional approach yields labeled antibodies with up to 6 times greater binding affinity for the TM antigen compared to those labeled via the random EDC/sulfo-NHS method [33].
Diagram 2: Comparison of random and site-specific antibody-QD conjugation strategies.
Capture Antibodies and Assay Configuration
A sandwich immunoassay requires a matched pair of antibodies that recognize different epitopes on the target antigen, TM.
- Capture Antibody: A monoclonal or polyclonal anti-TM antibody is immobilized onto the nitrocellulose membrane at the test line (T line). The concentration is critical and must be optimized; for TM detection, a concentration of 0.8 mg/mL has been used effectively [32]. The antibody is dispensed using an automated dispenser (e.g., Biolet XYZ-3060 Quantidispenser) at a rate of 0.5-1 µL/cm.
- Control Line: A secondary antibody (e.g., goat anti-rabbit IgG) is immobilized at the control line (C line) to capture any free QD-labeled detection antibody, validating the assay procedure.
- Membrane Preparation: After dispensing the lines, the membrane is dried, typically at 65°C for 30 minutes, to ensure stable immobilization [31].
The Scientist's Toolkit: Essential Research Reagents
Table 2: Key Reagents for Developing a QD-LFIA for Tropomyosin
| Reagent / Material | Function and Importance | Examples / Specifications |
|---|---|---|
| Anti-Tropomyosin Antibodies | Key biorecognition elements. A matched pair (capture & detection) is needed for the sandwich assay. | Monoclonal (capture) and polyclonal (detection) antibodies; specificity for shrimp TM is crucial [14] [10]. |
| Carboxylated Quantum Dots | Fluorescent signal label. Provide high sensitivity and photostability. | CdSe/ZnS core-shell, emission at 610±5 nm, modified with surface carboxyl groups for conjugation [32] [33]. |
| Conjugation Chemicals | Enable covalent attachment of antibodies to QDs. | EDC, sulfo-NHS for standard conjugation; maleimide-functionalized QDs for site-specific labeling [32] [33]. |
| Nitrocellulose Membrane | Porous matrix for capillary flow and immobilization of capture antibodies. | Various pore sizes (e.g., 8-15 µm); critical for defining flow rate and line sharpness [32]. |
| Buffer Components | Maintain optimal pH and ionic strength; reduce non-specific binding. | PBS (10 mM, pH 7.4), Tween-20 (0.05-1%), BSA (1-10%), sucrose (2-4%) as a stabilizer [32] [31]. |
| Tropomyosin Standard | Essential for assay development, optimization, and generating a calibration curve. | Purified natural or recombinant shrimp TM [14] [15]. |
The performance of a QD-LFIA for TM is evaluated based on its sensitivity, specificity, and reproducibility. The following table summarizes performance data from key studies.
Table 3: Performance Comparison of QD-LFIA Formats for Tropomyosin Detection
| Assay Parameter | Competitive QD-LFIA [32] | Sandwich QD-LFIA [14] | Site-Specific Sandwich QD-LFIA [33] |
|---|---|---|---|
| Target Analyte | Crustacean Tropomyosin | Shrimp Tropomyosin | Shrimp Tropomyosin |
| Visual LOD (µg/mL) | 0.5 | 0.05 | 0.054 |
| Instrumental LOD (µg/mL) | 0.05 | 0.01 | Not specified |
| Assay Time | Within 30 min | Within 10 min | Not specified |
| Specificity | Good for crustacean TM | No cross-reactivity with other species except shrimp | High specificity for shrimp TM |
| Key Feature | First QD-LFIA for crustacean TM | Superior sensitivity and speed | Enhanced antibody binding affinity |
The data demonstrates that the sandwich format offers a significant improvement in sensitivity over the competitive format. Furthermore, the site-specific labeling strategy enhances antibody functionality, contributing to the overall assay performance [14] [33].
Advanced Application: Multiplexed QD-LFIA
The QD-LFIA platform can be extended for the simultaneous detection of multiple allergens. A multiplexed LFIA (xLFIA) has been developed for the concurrent detection of crustacean allergens (tropomyosin and sarcoplasmic calcium binding protein) and egg allergen (ovalbumin) on a single strip [15] [34].
- Architecture: Multiple test lines, each coated with a capture antibody specific to a different allergen (anti-TM, anti-SCP, anti-OVA), are positioned on the same nitrocellulose membrane.
- Probes: A mixture of QD-labeled detection antibodies for all targets is applied to the conjugate pad. A single type of QD can be used, with the result read from the position of the T line.
- Optimization: To reduce mutual interference between adjacent T lines, parameters such as antibody coating concentration and the mixture ratio of the different QD-labeled antibodies must be carefully optimized. For the triplex assay, visual detection limits of 0.5 µg/mL for TM, 0.1 µg/mL for SCP, and 0.05 µg/mL for OVA were achieved [15].
The development of a robust QD-LFIA for shrimp tropomyosin relies on the meticulous integration of its core components: a properly assembled strip architecture, highly specific antibody pairs, and brightly fluorescent QD probes. Employing site-specific labeling strategies can dramatically improve antibody binding capacity and assay sensitivity. Furthermore, the platform's versatility allows for expansion into multiplexed assays, providing a powerful tool for comprehensive food allergen monitoring. The protocols and data summarized in this application note provide a solid foundation for researchers to develop and optimize their own QD-LFIA systems for food safety and other diagnostic applications.
A Step-by-Step Protocol: Constructing the QD-Sandwich LFIA for Tropomyosin
This application note details a robust protocol for the covalent conjugation of anti-tropomyosin antibodies to carboxylated quantum dots (QDs) via EDC/NHS chemistry. This synthesis produces a stable fluorescent probe specifically designed for use in a quantum-dot-based sandwich lateral flow immunoassay (LFIA) for the detection of shrimp tropomyosin (TM), the major allergen in shellfish [14]. The exceptional optical properties of QDs—including high quantum yield, photostability, and size-tunable emission—significantly enhance the sensitivity of LFIA platforms, enabling the rapid and accurate detection of trace allergens in processed foods to address critical food safety concerns [14] [35].
The EDC/NHS covalent conjugation chemistry described here offers a significant advantage over passive adsorption methods by creating a stable amide bond between the antibody and the nanoparticle, improving probe consistency and assay performance [35]. Furthermore, we present data demonstrating how site-specific labeling strategies can further optimize antibody performance, maximizing the sensitivity of the final diagnostic assay [33].
The diagram below illustrates the core procedural workflow for the covalent conjugation process.
Key Reagent Solutions
The following table catalogues the essential reagents required for the successful synthesis of the QD-antibody conjugate.
Table 1: Key Research Reagent Solutions
| Reagent / Material | Function / Role in Protocol | Key Considerations |
|---|---|---|
| Carboxylated QDs (e.g., CdSe/ZnS) | Fluorescent core; provides signal for detection and surface carboxyl groups for covalent conjugation. | Ensure water solubility and consistent particle size (e.g., emission at 610±5 nm) [14] [33]. |
| Anti-Tropomyosin Antibodies | Specific biological capture molecule; binds shrimp TM antigen in the LFIA. | Monoclonal antibodies ensure epitope specificity; polyclonal antibodies can increase sensitivity [14] [36]. |
| EDC & Sulfo-NHS | Crosslinking agents; EDC activates QD surface carboxyl groups, forming active ester intermediates stabilized by Sulfo-NHS. | Use fresh preparations in reaction buffers for optimal efficiency [14] [35]. |
| Coupling Buffer (e.g., 50 mM MES, pH 6.0) | Reaction medium; provides optimal pH environment for EDC/NHS chemistry and antibody stability. | Low ionic strength and slightly acidic pH maximize primary amine reactivity and conjugate yield [35]. |
| Size Exclusion Chromatography Media | Purification; separates conjugated QD-antibody probes from unreacted antibodies, free QDs, and chemical byproducts. | Critical for removing aggregates and isolating monodisperse, functional conjugates [35]. |
Comparative Conjugation Methods
While this protocol focuses on the standard EDC/NHS method, other conjugation strategies exist. The following table compares the key approaches, highlighting the performance advantages of site-specific techniques.
Table 2: Comparison of Antibody Conjugation Methods for QD Labeling
| Conjugation Method | Mechanism | Key Advantage | Key Disadvantage | Impact on Antigen Binding Affinity |
|---|---|---|---|---|
| Standard EDC/NHS | Covalent, random orientation; links carboxyl groups on QDs to primary amines (lysine) on antibodies. | Simple, widely applicable protocol. | Random orientation can block antigen-binding sites. | Can be significantly reduced due to steric hindrance. |
| Site-Specific (Fc-Targeted) | Covalent, controlled orientation; uses photoactivated affinity proteins (e.g., Protein A Z domain with Bpa) to bind antibody Fc region, then crosslinks. | Preserves antigen-binding fragment (Fab) activity. | More complex protocol requiring specialized reagents. | Retains up to 6x higher binding affinity compared to random labeling [33]. |
| Streptavidin-Biotin | Non-covalent, controlled orientation; uses high-affinity interaction between streptavidin on QDs and biotinylated antibodies. | Stable interaction; allows for pre-purified component assembly. | Requires an extra biotinylation step; larger complex size. | Generally good, as biotinylation can be directed. |
Detailed Experimental Protocol
Reagent Preparation
- QD Solution: Dilute the stock carboxylated QD solution (e.g., CdSe/ZnS) to a concentration of 1 µM in Coupling Buffer (50 mM MES, pH 6.0).
- Antibody Solution: Prepare a solution of the anti-tropomyosin monoclonal antibody at a concentration of 1-2 mg/mL in a neutral buffer such as PBS. Ensure the antibody is free of carrier proteins like BSA, which contain primary amines and would compete in the reaction.
- Crosslinker Solution: Prepare fresh solutions of EDC (400 mM) and sulfo-NHS (100 mM) in ultra-pure water. These solutions are unstable and must be used immediately.
Conjugation Procedure
- Activation of Carboxyl Groups: To 1 mL of the 1 µM QD solution in a microcentrifuge tube, add 50 µL of the 100 mM sulfo-NHS solution, followed by 50 µL of the 400 mM EDC solution. Mix the reaction mixture gently by pipetting or inverting the tube. Incubate for 30 minutes at room temperature with mild agitation to allow for the formation of amine-reactive sulfo-NHS esters on the QD surface.
- Removal of Excess Crosslinkers: Purify the activated QDs from the reaction mixture using a size exclusion micro-spin column (e.g., equilibrated with 50 mM MES, pH 6.0) according to the manufacturer's instructions. This step is critical to prevent the crosslinking of antibodies to each other.
- Antibody Coupling: Immediately after purification, add a molar excess of the anti-tropomyosin antibody solution to the activated QDs. A typical molar ratio of QD to antibody is 1:50 to 1:100. Mix gently and incubate the reaction for 2 hours at room temperature or overnight at 4°C with continuous agitation.
- Quenching and Blocking: After coupling, quench the reaction by adding 100 µL of 1 M Tris-HCl, pH 7.4, and incubate for 15 minutes. To block any remaining active sites and minimize non-specific binding in the subsequent LFIA, add a blocking agent such as 1% (w/v) Bovine Serum Albumin (BSA) and incubate for an additional 30 minutes.
- Purification of Conjugate: Separate the QD-antibody conjugate from unreacted antibodies and other reagents by size exclusion chromatography (e.g., using a Sephacryl S-300 column) or by density gradient centrifugation. Collect the first colored fluorescent band, which contains the conjugate.
- Storage: Store the purified conjugate in a suitable storage buffer (e.g., PBS with 0.1% BSA and 0.01% sodium azide) at 4°C in the dark. Avoid repeated freeze-thaw cycles.
Performance and Validation
The QD-anti-TM conjugate synthesized via this method is integral to the performance of the sandwich LFIA. When applied to the conjugate pad of the test strip, it enables the rapid and sensitive detection of shrimp tropomyosin. As demonstrated in prior studies, this approach can achieve an instrumental detection limit (IDL) for tropomyosin as low as 0.01 µg/mL and a visual detection limit (VDL) of 0.05 µg/mL, with results available in under ten minutes [14].
The site-specific conjugation method summarized in Table 2 offers a path for further optimization. Research has shown that directionally labeled antibodies can demonstrate a six-fold greater binding affinity for the tropomyosin antigen compared to those labeled via random EDC/NHS chemistry, which could potentially lower the detection limit even further [33].
Troubleshooting Guide
Table 3: Common Issues and Proposed Solutions
| Problem | Potential Cause | Suggested Solution |
|---|---|---|
| Low Conjugation Yield | Inefficient carboxyl group activation; inactive EDC/NHS. | Use fresh crosslinkers and ensure the reaction pH is between 6.0 and 7.0. |
| QD-Antibody Aggregation | Excessive crosslinking; antibody concentration too high. | Optimize the QD-to-antibody ratio; ensure efficient removal of unreacted EDC/NHS before adding antibody. |
| High Background in LFIA | Non-specific binding of the conjugate; incomplete blocking. | Include effective blocking agents (e.g., BSA, casein) during conjugation and in the LFIA running buffer. |
| Reduced Antigen Binding | Random conjugation sterically blocks antibody paratopes. | Consider adopting the site-specific Fc-targeted labeling strategy to orient antibodies correctly [33]. |
This application note details the fabrication protocol for a quantum-dot-based sandwich lateral flow immunoassay (LFIA) strip, specifically developed for the detection of the major shrimp allergen tropomyosin (TM). The content is framed within a broader thesis research context, aiming to provide a rapid, sensitive, and specific on-site detection tool for food safety analysis [2] [6]. The sandwich LFIA format is chosen for its superior performance in detecting large protein allergens like TM, offering reduced susceptibility to false negatives and matrix effects compared to competitive formats [2]. This document provides a standardized procedure for researchers and scientists developing in-house test strips, covering key steps from material selection to final assembly.
The Scientist's Toolkit: Essential Materials and Reagents
The successful development of a consistent and sensitive LFIA strip is contingent on the selection of appropriate materials and reagents. The following table catalogues the essential components, their functions, and key selection criteria.
Table 1: Key Research Reagent Solutions and Materials for LFIA Strip Fabrication
| Component | Function / Explanation | Key Considerations |
|---|---|---|
| Nitrocellulose Membrane | Serves as the analytical platform where capture antibodies are immobilized to form test and control lines [27]. | Capillary flow rate (rise time) critically impacts sensitivity; slower membranes (e.g., Whatman FF120HP) allow more interaction time [37] [27]. |
| Capture & Detector Antibodies | An antibody pair specific to Tropomyosin. The capture antibody is immobilized on the membrane, while the detector antibody is conjugated to the label [27]. | High affinity and specificity are paramount. Pairs should be screened via ELISA first. May be monoclonal, polyclonal, or recombinant [27]. |
| Quantum Dots (QDs) | Fluorescent nanoparticles used as the label for detector antibodies, providing high sensitivity due to their bright and stable fluorescence [2]. | CdSe/ZnS core-shell QDs with carboxyl surface modification allow covalent antibody conjugation via EDC/sulfo-NHS chemistry [2]. |
| Conjugate Release Pad | A pad material that stores the dried QD-antibody conjugates and releases them uniformly upon sample application [27]. | Must be pre-treated with blocking reagents (e.g., sucrose, PVP) and surfactants for stable conjugation storage and even rehydration [27]. |
| Sample Pad | Receives the liquid sample and can pre-filter particulates or adjust sample pH via pre-treatment [27]. | Glass fiber is common. Pre-treatment with buffers, blockers (PVA, PVP), and surfactants (Tween) can improve flow and sensitivity [27]. |
| Backing Card | A plastic-coated, pressure-sensitive adhesive platform that provides structural integrity for assembling all strip components [27]. | Must use diagnostic-grade adhesive to avoid interfering with immunoassay chemistry [37] [27]. |
| Absorbent Sink | A pad at the distal end of the strip that wicks and collects the fluid, maintaining continuous capillary flow across the strip [27]. | Sufficient absorptive capacity and wicking rate are crucial to prevent backflow, which can cause high background or false positives [27]. |
| Running Buffer | The buffer in which the sample is applied or that is used to pre-treat pads. It optimizes pH and sample flow [37]. | Typically neutral pH, low ionic strength buffers (e.g., PBS, Borate) with surfactants (Tween, Triton) to enhance flow and antibody-antigen affinity [37] [27]. |
Experimental Protocols
Conjugation of Detector Antibodies to Quantum Dots
This protocol describes the covalent coupling of anti-TM polyclonal IgG to carboxylated QDs using the EDC/sulfo-NHS chemistry, as employed for the shrimp TM LFIA [2].
Materials:
- Carboxylated CdSe/ZnS QDs (e.g., from Beidajubang Technology Co.)
- Anti-Tropomyosin polyclonal IgG
- 1-Ethyl-3-(3-dimethylaminopropyl) carbodiimide (EDC)
- N-hydroxysulfosuccinimide sodium salt (sulfo-NHS)
- 0.01 M MES buffer (pH 6.0)
- 0.01 M PBS buffer (pH 7.4)
- Ultrapure water
- Centrifugal filter units (100 kDa MWCO)
Procedure:
- Activation of QDs: Dilute 1 nmol of carboxylated QDs in 500 µL of 0.01 M MES buffer (pH 6.0). Add 20 µL of freshly prepared EDC solution (10 mg/mL) and 40 µL of sulfo-NHS solution (10 mg/mL). Incubate the mixture for 30 minutes at room temperature with gentle shaking.
- Purification of Activated QDs: To remove excess EDC/sulfo-NHS, transfer the reaction mixture to a 100 kDa centrifugal filter and centrifuge at 12,000 × g for 8 minutes. Discard the flow-through and resuspend the activated QDs in 500 µL of MES buffer. Repeat this wash step once.
- Antibody Conjugation: Immediately add 50 µg of anti-TM IgG to the purified, activated QDs. Adjust the total reaction volume to 1 mL with PBS (pH 7.4). Allow the conjugation to proceed for 2 hours at room temperature with gentle shaking, protected from light.
- Blocking and Purification: Add 100 µL of 1% (w/v) BSA solution to block any remaining active sites and incubate for 30 minutes. To remove unconjugated antibodies, wash the QD-antibody conjugates three times with PBS using centrifugal filters (12,000 × g, 8 min per wash).
- Storage: Finally, resuspend the purified QD-antibody conjugates in 200 µL of storage buffer (0.01 M PBS, pH 7.4, containing 1% BSA, 5% sucrose, and 0.05% sodium azide). Store at 4°C protected from light for future use.
Immobilization of Capture Antibodies on Nitrocellulose Membrane
This section details the precise dispensing of capture antibodies and control line antibody onto the nitrocellulose membrane.
Materials:
- Nitrocellulose membrane (e.g., Whatman FF120HP)
- Anti-Tropomyosin capture antibody (for Test Line)
- Goat anti-rabbit IgG antibody (for Control Line)
- Dispensing buffer (e.g., 0.01 M PBS, pH 7.4)
- BioDot Quanti BioJet or equivalent non-contact dispenser
- Drying oven
Procedure:
- Antibody Preparation: Dilute the anti-TM capture antibody and the goat anti-rabbit IgG antibody to a concentration of 1.0 mg/mL in dispensing buffer. Centrifuge the antibody solutions briefly at high speed to remove any potential aggregates.
- Membrane Preparation: Cut the nitrocellulose membrane to the required size and affix it securely onto the backing card, ensuring no air bubbles are trapped.
- Dispensing Antibody Lines: Using a non-contact dispenser, dispense the anti-TM antibody solution in a fine line to form the Test Line. Parallel to it, dispense the goat anti-rabbit IgG solution to form the Control Line. A typical dispensing rate is 1 µL per cm of membrane length.
- Drying: Immediately after dispensing, dry the membrane for 1 hour at 37°C or overnight at room temperature in a clean, low-humidity environment.
Strip Assembly and Fabrication
This protocol covers the integration of all pre-fabricated components into a functional lateral flow strip.
Materials:
- Backing card with immobilized membrane
- Pre-treated sample pad (e.g., Whatman CF3, treated with buffer containing surfactants and blocking agents)
- Conjugate release pad (e.g., Glass Fiber, pre-treated and sprayed with QD conjugates)
- Absorbent sink pad (e.g., Whatman cellulose fiber)
- Guillotine cutter
Procedure:
- Conjugate Pad Preparation: Spray the QD-antibody conjugate solution onto the pre-treated conjugate release pad using an air-jet dispenser (e.g., BioDot AirJet Quanti) for even application. Dry the pad thoroughly and store desiccated at 4°C.
- Component Overlay: Remove the release liner from the backing card. Overlap the components sequentially onto the adhesive backing card in the following order:
- Absorbent Sink: Place at the distal end of the card, overlapping the nitrocellulose membrane by 1-2 mm.
- Conjugate Pad: Place at the proximal end, overlapping the nitrocellulose membrane by 1-2 mm.
- Sample Pad: Place at the very proximal end, overlapping the conjugate pad by 1-2 mm.
- Lamination and Cutting: Apply light, even pressure across the entire assembly to ensure all components are firmly bonded to the adhesive backing. Finally, cut the large card into individual strips of the desired width (typically 3-5 mm) using a guillotine cutter.
Data Presentation and Performance Metrics
The performance of the fabricated QD-LFIA strip for tropomyosin detection should be characterized using the following key metrics, which can be summarized for easy comparison.
Table 2: Quantitative Performance Data for Tropomyosin QD-LFIA
| Performance Parameter | Result | Experimental Detail / Note |
|---|---|---|
| Visual Detection Limit (VDL) | 0.05 µg/mL | The lowest TM concentration producing a visible test line under ambient light [2]. |
| Instrumental Detection Limit (IDL) | 0.01 µg/mL | The lowest TM concentration detected by a fluorescent strip reader [2]. |
| Assay Time | < 10 minutes | Total time from sample application to result readout [2]. |
| Specificity (Cross-Reactivity) | No cross-reactivity with other species except shrimp | Tested against a panel of other potential food allergens [2]. |
| Intra-Assay Precision (CV) | 8.87% - 11.9% | Coefficient of variation for replicates within the same assay run [2]. |
| Inter-Assay Precision (CV) | 7.75% - 21.12% | Coefficient of variation for replicates across different assay runs [2]. |
Workflow and Logical Diagrams
The following diagrams illustrate the key signaling principle and the comprehensive fabrication workflow.
QD-LFIA Sandwich Assay Principle
LFIA Strip Fabrication Workflow
The detection of food allergens is a critical public health concern, with shrimp tropomyosin (TM) being a major allergen affecting a significant portion of the population. This application note details a rapid, highly sensitive, and specific Quantum-Dot-based Sandwich Lateral Flow Immunoassay (QD-LFIA) for the detection of TM in processed foods. This method fulfills the ASSURED (Affordable, Sensitive, Specific, User-friendly, Rapid/Robust, Equipment-free, and Deliverable to end users) criteria for point-of-care testing (POCT) as recommended by the World Health Organization, enabling detection within a single 10-minute workflow [38].
Principle of the Quantum-Dot-Based Sandwich LFIA
The assay employs a sandwich format, ideal for large protein targets like TM with multiple epitopes. In this configuration, fluorescent CdSe/ZnS quantum dots (QDs) serve as the reporter label, conjugated to anti-TM polyclonal antibodies. When a liquid sample is applied, it migrates via capillary action, rehydrating the QD-antibody conjugates. If TM is present, it binds to these conjugates, forming a complex. This complex continues to flow across a nitrocellulose membrane until it is captured at the test line by a second, immobilized anti-TM antibody, forming a "sandwich" (QD-anti-TM-TM-anti-TM). The accumulation of QDs at the test line produces a fluorescent signal proportional to the TM concentration. A control line confirms the proper function of the assay. The fluorescent signal offers superior sensitivity and a lower limit of detection compared to conventional colorimetric reporters like gold nanoparticles [38] [14].
The schematic workflow below illustrates the key stages of the assay:
Materials and Reagents
Research Reagent Solutions
The following table details the essential materials and reagents required to perform the QD-LFIA.
| Item | Function/Description |
|---|---|
| CdSe/ZnS QDs (Carboxylated) | Fluorescent reporter label; provides high-intensity, stable fluorescence for sensitive detection [14]. |
| Anti-TM Polyclonal Antibodies | Used for both conjugation to QDs (detector antibody) and immobilization on the test line (capture antibody) [14]. |
| EDC & Sulfo-NHS | Cross-linking agents for covalent conjugation of carboxylated QDs to antibodies via carbodiimide chemistry [14]. |
| Nitrocellulose Membrane | The porous matrix through which the sample migrates; contains the immobilized test and control lines [38]. |
| Conjugate Pad | Pad where the QD-antibody conjugates are stored in a dry state until rehydrated by the sample [38]. |
| Sample Pad | The point of sample application; filters out unwanted cellular components from complex samples like food homogenates [38]. |
| Absorbent Pad | Acts as a waste reservoir, wicking the remaining fluid and ensuring continuous capillary flow across the strip [38]. |
| Running Buffer (PBS with Tween 20) | Provides the liquid medium for sample migration and optimal antigen-antibody binding conditions [14]. |
Detailed Experimental Protocol
Conjugation of QDs with Anti-TM Antibodies
This protocol describes the covalent coupling of antibodies to quantum dots using EDC/s-NHS chemistry [14].
- Activation: Mix 1 mL of carboxylated QDs (1 µM) with 100 µL of EDC (10 mg/mL) and 100 µL of sulfo-NHS (10 mg/mL) in MES buffer (0.1 M, pH 6.0). Incubate the mixture for 30 minutes at room temperature with gentle shaking.
- Purification: Remove excess cross-linkers by centrifuging the activated QDs through a 100 kDa molecular weight cutoff filter at 12,000 × g for 10 minutes. Discard the flow-through and resuspend the QDs in 1 mL of borate buffer (0.05 M, pH 7.4).
- Conjugation: Add 100 µg of purified anti-TM polyclonal IgG to the activated QDs. React for 2 hours at room temperature with gentle shaking.
- Blocking: Add 100 µL of 1% (w/v) BSA to block any remaining active sites and incubate for 30 minutes.
- Final Purification: Purify the QD-antibody conjugates by centrifugation as in step 4.2. Resuspend the final conjugate in 1 mL of storage buffer (0.05 M borate buffer, pH 7.4, containing 1% BSA, 5% sucrose, and 0.1% Tween 20).
- Storage: The conjugate can be stored at 4°C for several weeks. For long-term storage, aliquot and freeze at -20°C.
Assembly of the Lateral Flow Strip
- Conjugate Pad Preparation: Dispense the QD-antibody conjugate onto the glass fiber conjugate pad at a density of 5 µL per cm. Dry the pad overnight in a desiccator at room temperature.
- Membrane Coating: Dispense the capture anti-TM antibody (1 mg/mL) and the species-specific anti-immunoglobulin antibody (1 mg/mL) onto the nitrocellulose membrane to form the test and control lines, respectively. The dispensing rate is typically 0.5 µL/cm.
- Assembly: Assemble the strip by sequentially overlapping the sample pad, conjugate pad, nitrocellulose membrane, and absorbent pad on a plastic backing card. Press the card to ensure firm contact between all components.
- Cutting: Cut the assembled card into individual 4 mm wide strips using an automatic cutter.
- Storage: Store the strips in a sealed bag with desiccant at 4°C until use.
Assay Procedure and Workflow
The complete assay, from sample preparation to result interpretation, is designed to be completed in under 10 minutes. The following workflow details each step:
Step-by-Step Instructions:
- Sample Preparation (Minutes 0-2): Homogenize 1 g of the food sample with 10 mL of phosphate-buffered saline (PBS, 0.01 M, pH 7.4) containing 0.05% Tween 20. Centrifuge the homogenate at 5,000 × g for 2 minutes to pellet debris.
- Sample Application (Minute 2): Pipette 100 µL of the supernatant directly onto the sample pad of the LFIA strip.
- Lateral Flow (Minutes 2-10): Allow the strip to develop for 10 minutes at room temperature. The liquid will migrate through the conjugate pad, nitrocellulose membrane, and into the absorbent pad.
- Result Readout (Minute 10): Place the strip under a UV lamp or a dedicated fluorescent strip reader. The presence of a fluorescent band at the test line indicates a positive result for TM. The control line must always fluoresce for the test to be valid.
Performance Data and Validation
The developed QD-LFIA was rigorously validated. The following table summarizes its key analytical performance characteristics [14].
| Performance Parameter | Result |
|---|---|
| Visual Detection Limit (VDL) | 0.05 µg mL⁻¹ |
| Instrumental Detection Limit (IDL) | 0.01 µg mL⁻¹ |
| Total Assay Time | < 10 minutes |
| Specificity (Cross-reactivity) | No cross-reactivity with other species except shrimp |
| Intra-Assay Precision (Coefficient of Variation) | 8.87% - 11.9% |
| Inter-Assay Precision (Coefficient of Variation) | 7.75% - 21.12% |
| Detection in Model Processed Foods | Positive in roast fish fillet, boiled meatball, and steamed meatball (0.045 µg g⁻¹) |
Troubleshooting Guide
| Problem | Possible Cause | Suggested Solution |
|---|---|---|
| No control line appears | Invalid strip; conjugate degradation; improper storage. | Use a new strip from a different batch. Ensure proper storage conditions (4°C with desiccant). |
| Weak test line signal | Low TM concentration; incomplete conjugation; old reagents. | Check conjugate activity. Confirm sample preparation protocol. Use fresh running buffer. |
| High background noise | Non-specific binding; over-conjugation of QDs. | Increase the concentration of blocking agent (e.g., BSA) in the running buffer. Optimize the QD-to-antibody ratio during conjugation. |
| Slow or no sample flow | Clogged membrane; damaged or misaligned pads; insufficient sample volume. | Ensure pads are overlapping correctly. Check the integrity of the sample pad. Apply the correct sample volume (100 µL). |
This application note provides a detailed protocol for a quantum-dot-based sandwich lateral flow immunoassay for the rapid and accurate detection of shrimp tropomyosin. The assay demonstrates excellent sensitivity, specificity, and reliability, making it suitable for monitoring allergens in food products and production lines. The entire workflow, from sample extraction to result readout, is completed in under ten minutes, offering a powerful tool for ensuring food safety and protecting public health.
In the development of diagnostic assays, such as quantum-dot-based sandwich lateral flow immunoassays (LFIA), establishing the lowest concentration of an analyte that can be reliably identified is paramount. Two critical performance parameters are the Visual Detection Limit (VDL) and the Instrumental Detection Limit (IDL). The VDL is the lowest analyte concentration at which a visible signal (e.g., a test line) can be consistently observed by the naked eye. In contrast, the IDL is the lowest concentration that can be statistically distinguished from a blank sample using instrumental detection, often a more sensitive value than the VDL [14] [39]. For a tropomyosin-specific LFIA, these parameters define the assay's ability to detect trace allergens in processed foods, directly impacting public health [14]. This document outlines the protocols for establishing VDL and IDL within the context of developing a sandwich LFIA for shrimp tropomyosin.
Theoretical Foundations and Key Concepts
Definitions and Statistical Basis
The Limit of Detection (LoD) is universally defined as the lowest concentration of an analyte that can be detected—but not necessarily quantified—with a stated probability [39] [40]. The IDL aligns closely with this formal LoD. The fundamental statistical model differentiates between the signal from a blank sample and the signal from a sample containing a low concentration of the analyte.
A standard approach for calculating the instrumental LoD uses the formula based on the standard deviation (σ) of the response and the slope (S) of the calibration curve: LoD = 3.3 × σ / S [39]. The factor 3.3 is derived from a confidence level of approximately 95% for detection. The corresponding Limit of Quantification (LoQ), or the lowest concentration that can be measured with acceptable precision and accuracy, is given by LoQ = 10 × σ / S [39]. The VDL is determined more empirically through visual assessment by multiple operators.
The Sandwich LFIA and the Role of Quantum Dots
The sandwich immunoassay format is preferred for large molecules like tropomyosin, which have at least two antibody-binding sites [38]. In this format, antibodies conjugated to a reporter label bind to one epitope of the target analyte. This complex then flows along the strip and is captured by a second immobilized antibody at the test line, forming a "sandwich" that generates a signal [38].
Quantum dots (QDs) are semiconductor nanocrystals used as fluorescent reporters in LFIAs. They offer significant advantages over conventional labels like gold nanoparticles, including higher fluorescence quantum yield, superior photostability, and narrow emission spectra [14] [38]. These properties significantly enhance the sensitivity of the assay, leading to a lower IDL. The intense fluorescence signal also improves the ease and reliability of visual readout, potentially lowering the VDL [14] [34].
Experimental Protocols
Protocol for Determining the Instrumental Detection Limit (IDL)
Principle: The IDL is established by analyzing replicates of a blank sample and low-concentration analyte samples to determine the lowest concentration that can be reliably distinguished from noise [39] [40].
Materials:
- QD-LFIA strips specific for tropomyosin.
- A series of purified tropomyosin standards in a suitable buffer, including a blank (zero concentration).
- Fluorescent strip reader.
Procedure:
- Preparation of Low-Concentration Samples: Prepare a dilution series of tropomyosin standards in the range where the signal is expected to be near the detection limit (e.g., 0.001–0.05 μg/mL) [14].
- Sample Analysis: Analyze at least n=6 replicates for the blank sample and for each low-level tropomyosin standard.
- Data Collection: Use a fluorescent reader to measure the signal intensity (e.g., fluorescence units) at the test line for each replicate.
- Calculation: The IDL can be determined using the calibration curve method:
- Generate a calibration curve from the low-concentration standards.
- The standard deviation (σ) can be derived from the regression analysis. The IDL is then calculated as 3.3 × σ / S, where S is the slope of the calibration curve [39].
Protocol for Determining the Visual Detection Limit (VDL)
Principle: The VDL is determined by having multiple trained observers visually assess a dilution series of the analyte to find the lowest concentration that produces a consistently visible test line.
Materials:
- QD-LFIA strips.
- A dilution series of tropomyosin standards (e.g., 0.05–1.0 μg/mL).
- A minimum of 5 independent, trained observers.
Procedure:
- Strip Preparation: Run the dilution series of tropomyosin standards on the QD-LFIA strips according to the established assay procedure. The detection time should be controlled, typically within 10 minutes [14].
- Blinded Observation: Present the strips to the observers in a random and blinded order. Each observer should independently record whether they see a visible test line at each concentration.
- Data Analysis: For each concentration, calculate the percentage of observers that reported a positive visual result.
- VDL Assignment: The VDL is defined as the lowest analyte concentration at which ≥95% of observers consistently report a visible test line [14]. For instance, in a tropomyosin QD-LFIA, this was found to be 0.05 μg/mL [14].
Workflow for Establishing VDL and IDL
The following diagram illustrates the integrated experimental workflow for establishing both detection limits.
Data Presentation and Analysis
Exemplary Data from Tropomyosin QD-LFIA
The following table summarizes reported VDL and IDL values from published studies on allergen detection using QD-LFIA, which can serve as a benchmark for your tropomyosin research.
Table 1: Reported VDL and IDL Values in Allergen QD-LFIA Studies
| Target Analyte | Assay Format | Visual Detection Limit (VDL) | Instrumental Detection Limit (IDL) | Reference |
|---|---|---|---|---|
| Shrimp Tropomyosin | Sandwich QD-LFIA | 0.05 μg/mL | 0.01 μg/mL | [14] |
| Crab Tropomyosin | Multiplexed QD-LFIA | 0.5 μg/mL | 0.5 μg/mL | [34] |
| Sarcoplasmic Calcium Binding Protein (SCP) | Multiplexed QD-LFIA | 0.1 μg/mL | 0.05 μg/mL | [34] |
| Ovalbumin | Multiplexed QD-LFIA | 0.05 μg/mL | 0.05 μg/mL | [34] |
Critical Reagents and Materials
A successful QD-LFIA for tropomyosin relies on several key reagents.
Table 2: Essential Research Reagent Solutions for QD-LFIA Development
| Reagent / Material | Function / Role in Assay | Exemplary Specification |
|---|---|---|
| Carboxylated Quantum Dots (QDs) | Fluorescent reporter label providing the detection signal. Conjugated to detection antibodies. | CdSe/ZnS core-shell structure; emission wavelength suitable for reader detection [14]. |
| Anti-Tropomyosin Polyclonal IgG | Detection antibody conjugated to QDs; binds to one epitope on the tropomyosin antigen. | High affinity and specificity; purified from immunized rabbit serum [14]. |
| Anti-Tropomyosin Monoclonal Antibody | Capture antibody immobilized on the nitrocellulose membrane at the test line. | Binds a different epitope than the detection antibody to form the sandwich complex [14]. |
| Nitrocellulose Membrane | Porous matrix for capillary flow and the site for antibody immobilization (test/control lines). | Consistent flow rate and high protein binding capacity. |
| Tropomyosin Antigen Standard | Purified protein used for calibration, spiking studies, and determining VDL/IDL. | Recombinant or native protein of high purity (>95%) [14]. |
| Fluorescent Strip Reader | Instrument for quantifying the signal intensity at the test line to determine IDL. | Capable of exciting and detecting the specific fluorescence emission of the QDs used. |
Discussion and Concluding Remarks
Establishing both VDL and IDL is critical for comprehensively characterizing a QD-LFIA. The IDL, being more sensitive, defines the ultimate analytical capability of the assay, while the VDL defines its practical utility in settings without instrumentation [14]. For tropomyosin detection, the reported VDL of 0.05 μg/mL and IDL of 0.01 μg/mL demonstrate the high sensitivity afforded by the quantum dot label combined with the sandwich assay format [14]. This sensitivity is crucial for detecting trace amounts of allergen in processed foods where tropomyosin may be present at very low concentrations but still pose a risk to allergic individuals.
Researchers should note that the values for VDL and IDL are specific to the assay configuration, reagents, and instrumentation used. Meticulous optimization of the conjugation chemistry between QDs and antibodies, as well as the chromatography conditions, is essential to achieve the lowest possible detection limits and ensure the reliability of the assay for monitoring shrimp allergen in complex food matrices [14] [34].
Within the broader scope of developing a quantum-dot-based sandwich lateral flow immunoassay (xLFIA) for shrimp tropomyosin, this application note provides a detailed protocol for the specific detection of this crustacean allergen in complex processed food matrices. Tropomyosin (TM) is a major allergenic protein in crustaceans, and its reliable detection in processed foods is crucial for protecting sensitized individuals and ensuring compliant food labeling [34] [41]. The methodology outlined herein leverages a fluorescent multiplexed lateral flow immunoassay (xLFIA), which utilizes quantum dots (QDs) as fluorescent reporters to achieve high sensitivity and specificity, even in challenging food samples such as meatballs and fish fillets [34]. QDs are favored for their superior photostability, high fluorescence intensity, and resistance to photobleaching compared to conventional labels, making them ideal for sensitive, quantitative point-of-care testing [28] [42].
Experimental Protocol
Reagent and Buffer Preparation
- Coating Antibody Solution: Dilute the capture antibody (rabbit anti-TM IgG) in a 0.01 M phosphate buffer (PB, pH 7.4) to a concentration of 1.0 mg/mL for test line (T-line) dispensing.
- QD-Labeled Detection Probe: Conjugate QDs to the purified anti-TM detection antibody using a covalent conjugation method (e.g., EDC-NHS chemistry) [42]. Purify the QD-antibody conjugates via dialysis or size-exclusion chromatography to remove unconjugated antibodies. The final conjugate is suspended in a preservation buffer containing 10 mM PBS (pH 8.0), 1% BSA, 2% sucrose, and 0.05% Tween-20, and dispensed onto the conjugate pad.
- Running Buffer: 10 mM phosphate-buffered saline (PBS, pH 7.4) containing 0.5% BSA and 0.1% Tween-20.
- Sample Extraction Buffer: 20 mM Tris-HCl buffer (pH 8.2) containing 1 M NaCl, 2 M Urea, and 0.5% Tween-20. The high-salt and denaturing conditions facilitate the efficient extraction of tropomyosin from complex processed foods [34].
Food Sample Preparation and Tropomyosin Extraction
- Homogenization: Weigh 2.0 g of the processed food sample (e.g., meatball or fish fillet). Add 10 mL of the pre-chilled sample extraction buffer (1:5 w/v ratio).
- Extraction: Homogenize the mixture using a laboratory blender or a homogenizer at 12,000 rpm for 3 minutes. Ensure a consistent and uniform homogenate.
- Incubation: Incubate the homogenate on a shaking incubator at 60°C for 30 minutes to enhance protein solubilization.
- Clarification: Centrifuge the homogenate at 10,000 × g for 15 minutes at 4°C.
- Collection: Carefully collect the clear supernatant. The pH of the supernatant should be adjusted to 7.4 ± 0.2, if necessary, using 1 M NaOH or 1 M HCl.
- Dilution: Dilute the supernatant 1:1 (v/v) with the running buffer prior to analysis. For highly processed samples, a filtration step (0.45 μm syringe filter) may be required to remove residual particulates.
xLFIA Test Procedure and Data Acquisition
- Assembly: The xLFIA strip consists of a sample pad, conjugate pad (pre-coated with QD-labeled anti-TM), nitrocellulose membrane (containing the test and control lines), and absorbent pad laminated onto a backing card [34] [22].
- Application: Pipette 100 μL of the prepared sample extract onto the sample pad of the xLFIA strip.
- Migration: Allow the sample to migrate laterally by capillary action for 15 minutes at room temperature.
- Detection: Place the developed strip in a fluorescent lateral flow reader. Excite the QDs at 365 nm and measure the fluorescence emission intensity at 610 nm at both the test (T) and control (C) lines.
- Analysis: Quantify the tropomyosin concentration based on the fluorescence intensity ratio of the T-line to the C-line (T/C ratio) against a pre-established standard curve.
Table 1: Key Performance Parameters of the QD-based xLFIA for Tropomyosin Detection
| Parameter | Value | Description |
|---|---|---|
| Visual LOD | 0.5 μg/mL | The lowest concentration detectable by the naked eye. |
| Instrumental LOD | 0.05 μg/mL | The lowest concentration detectable by a fluorescent reader. |
| Dynamic Range | 0.05 - 10 μg/mL | The quantitative range of the assay. |
| Detection in Model Foods | 0.05% (shrimp powder) | The minimum detectable level of allergenic material in a food matrix. |
| Assay Time | ~15 minutes | Total time from sample application to result. |
| Precision (CV) | <10% | Intra- and inter-assay coefficient of variation. |
The Scientist's Toolkit: Research Reagent Solutions
Table 2: Essential Materials and Reagents for xLFIA Development
| Item | Function / Role | Specification / Example |
|---|---|---|
| Quantum Dots | Fluorescent reporter label; provides signal for detection. | CdSe/ZnS core-shell, emission ~610 nm; functionalized with carboxyl groups [28] [42]. |
| Anti-Tropomyosin Antibodies | Molecular recognition elements for capture and detection. | High-affinity monoclonal or polyclonal antibodies; specific to crustacean TM [34]. |
| Nitrocellulose Membrane | Platform for capillary flow and immobilization of capture antibodies. | Pore size: 8-15 μm; consistent capillary flow time [22]. |
| Conjugate Pad | Reservoir for storing and releasing QD-antibody conjugates. | Glass fiber or polyester; treated with sucrose and surfactants for stable release [22]. |
| Sample Pad | Initial sample application and filtration. | Cellulose or glass fiber; pre-treated with buffers and proteins to condition the sample [22]. |
| Backing Card | Structural support for assembling the LFA strip. | Plastic (e.g., PVC) with high-quality adhesive. |
| Fluorescent Strip Reader | Quantitative measurement of the test result. | Portable reader with LED excitation (~365 nm) and photodetector for emission (~610 nm) [28]. |
Workflow and Signaling Principle
The detection of tropomyosin in this protocol is based on a sandwich immunoassay format, as illustrated in the workflow below.
Diagram 1: Overall xLFIA Workflow for Tropomyosin Detection.
The fundamental signaling mechanism at the test line involves the formation of a "sandwich" complex, where the target tropomyosin is bound between two specific antibodies, leading to the accumulation of QDs and a measurable fluorescent signal.
Diagram 2: QD-based Sandwich Immunoassay Signaling Principle.
Results and Discussion
Performance in Processed Foods
The developed QD-xLFIA has been validated for the detection of crustacean tropomyosin in various model and commercial foods. The assay successfully detected tropomyosin in spiked meatball and fish fillet models, with a sensitivity as low as 0.05% shrimp powder in the final food product [34]. This high sensitivity is critical for detecting trace allergens that may result from cross-contact during food processing. When applied to 28 commercial food products, the xLFIA results showed a 82% consistency with the ingredient labels, highlighting its practical utility for verifying allergen declarations and detecting unintended presence [34].
Advantages of the QD-xLFIA Approach
The integration of quantum dots as fluorescent labels overcomes several limitations of traditional gold nanoparticle-based LFAs. The key advantages include:
- Enhanced Sensitivity: The bright and stable fluorescence of QDs lowers the limit of detection, enabling the identification of trace-level contaminants [28] [42].
- Quantitative Analysis: The strong fluorescent signal is easily quantified with a portable reader, moving beyond simple yes/no results to concentration-dependent measurements [34] [42].
- Multiplexing Capability: Different QDs with distinct emission wavelengths can be conjugated to antibodies for different allergens (e.g., ovalbumin, SCP), allowing for the simultaneous detection of multiple allergens on a single strip, as demonstrated in the source study [34].
Troubleshooting
- High Background Noise: Ensure the QD-antibody conjugates are adequately purified and the running buffer contains sufficient blocking agents (e.g., BSA) to minimize non-specific binding [42].
- Weak or No Signal: Check the activity of the antibodies and the conjugation efficiency. Confirm that the sample pH is within the optimal range (7.2-7.6) and that the extraction procedure effectively solubilizes the target protein.
- Inconsistent Flow or Strip Development: Verify the quality and overlap of the membrane components. Ensure the conjugate pad is stored desiccated and is fully resolubilized upon sample application [22].
Enhancing QD-LFIA Performance: Proven Strategies for Sensitivity, Specificity, and Stability
The development of robust and sensitive diagnostic assays, such as the quantum-dot-based sandwich lateral flow immunoassay (LFIA) for the detection of shrimp allergen tropomyosin, hinges on the precise optimization of the nanomaterial probes. Among the critical parameters, the size and shell thickness of quantum dots (QDs) directly govern their optical performance, including quantum yield, and their effectiveness in bioconjugation, which impacts loading efficiency and assay sensitivity. This Application Note details the integral relationship between QD core/shell architecture and its functional characteristics, providing validated protocols for optimizing these parameters to enhance the performance of sandwich LFIAs within tropomyosin research.
Core Principles: QD Size, Shell Thickness, and Optical Performance
The performance of QDs in a biosensing context is predominantly determined by their photoluminescence quantum yield (PLQY) and stability, both of which are critically dependent on the nanostructure's physical dimensions, particularly the core size and the shell thickness.
The Impact of Shell Thickness on Quantum Yield and Brightness
A primary function of an inorganic shell, such as ZnS or CdS, grown epitaxially over a QD core is to passivate surface defects of the core material, thereby suppressing non-radiative recombination pathways and significantly boosting the PLQY [43] [44]. Research on CdSe/CdS and InP/ZnS core/shell QDs consistently demonstrates that increasing the shell thickness leads to a substantial enhancement in PLQY [44] [45]. For instance, one study showed that thicker-shelled alloyed-core/shell QDs exhibited a higher PLQY and a narrower emission linewidth compared to their thin-shelled counterparts [43].
Beyond improving quantum yield, a thicker shell dramatically increases the QD's absorption cross-section, which is the ability to absorb incident light. The combined effect of a higher absorption cross-section and an improved PLQY results in a particle that is significantly brighter. Studies have quantified that thick-shelled "giant" QDs (gQDs) can be over 50-fold brighter than thin-shelled QDs in aqueous milieus, a crucial advantage for detecting low-abundance analytes like tropomyosin [45].
The Trade-off: Shell Thickness and Förster Resonance Energy Transfer (FRET) Efficiency
While a thicker shell is beneficial for brightness, it introduces a consideration for assays relying on energy transfer. The point-dipole approximation governing FRET indicates that the shell physically separates the donor (QD core) from potential acceptor molecules. As the shell thickness increases, this increased donor-acceptor distance leads to a reduction in FRET efficiency [45]. Therefore, the choice of shell thickness must balance the need for maximum signal output against the required efficiency of energy transfer, if applicable to the assay design.
The Influence of Shell Thickness on Carrier Dynamics
Ultrafast spectroscopic studies on InP/ZnS QDs reveal that a thicker ZnS shell confines charge carriers (electrons and holes) more effectively within the core. This confinement weakens the interactions between the carriers and surface/interface defect states, which are primary sites for non-radiative recombination. Consequently, this leads to a prolongation of the carrier relaxation lifetime and a higher PLQY, further corroborating the optical benefits of a thicker shell [44].
Table 1: Quantitative Effects of Shell Thickness on QD Properties
| QD Property | Effect of Increasing Shell Thickness | Experimental Evidence |
|---|---|---|
| Photoluminescence Quantum Yield (PLQY) | Increases due to better surface passivation and reduced non-radiative recombination. | Thick-shelled QDs showed higher PLQY than thin-shelled equivalents [43] [44] [45]. |
| Brightness | Significantly increases due to higher PLQY and larger absorption cross-section. | Thick-shelled CdSe/CdS/ZnS QDs were >50x brighter than thin-shelled QDs [45]. |
| FRET Efficiency | Decreases due to increased physical donor-acceptor distance. | A systematic study confirmed reduced FRET efficiency with thicker shells [45]. |
| Carrier Lifetime | Prolongs as thicker shells reduce carrier interactions with surface defects. | InP/ZnS QDs with thicker shells exhibited longer carrier relaxation lifetimes [44]. |
The Role of Size in Bioconjugation and Loading
The physical size of the QD, determined by its core and shell, directly influences its function in an LFIA. For a sandwich immunoassay, antibodies must be conjugated to the QD surface. The total surface area of the QD dictates the number of antibodies that can be loaded, which can affect the avidity of the detection probe. While larger QDs with thicker shells offer more surface area for bioconjugation, their overall size must be controlled to ensure efficient migration through the nitrocellulose membrane in an LFIA. Excessively large particles may hinder flow and reduce assay speed and sensitivity.
Experimental Protocols for Optimization
Protocol 1: Synthesizing Alloyed-Core/Shell QDs with Variable Shell Thickness
This protocol, adapted from recent literature, describes a one-pot method for synthesizing Cd-based alloyed-core/shell QDs with tunable shell thickness [43].
Materials:
- Cadmium Oxide (CdO), Zinc Acetate Dihydrate (Zn(OAc)₂·2H₂O), Selenium (Se), Sulfur (S): High-purity precursors.
- Oleic Acid (OA), 1-Octadecene (ODE): Solvents and ligands.
- Trioctylphosphine (TOP): Reaction medium.
Procedure:
- Core Synthesis: In a round-bottom flask, combine 0.25 mmol CdO, 3.41 mmol Zn(OAc)₂·2H₂O, and 7 mL OA. Heat to 150°C under nitrogen flow and degas for 1 hour. Add 15 mL ODE and degas further at 90°C for 30 minutes. Raise the temperature to 290°C and swiftly inject a mixture of 2.1 mmol Se, 2.5 mmol S, and 2.65 mL TOP.
- Thin-Shell QDs: For thin-shelled QDs (mean size ~8.0 nm), allow the reaction to proceed at 310°C for 10 minutes before cooling to room temperature for purification.
- Thick-Shell QDs: For thick-shelled QDs (mean size ~10.3 nm), after the initial 10-minute reaction at 310°C, do not cool. Instead, swiftly inject a solution of 1.6 mmol S in 2.4 mL ODE. After 10 minutes, continuously inject (0.6 mL/min) 5 mL of a zinc oleate solution (prepared from 5.72 mmol Zn(OAc)₂·2H₂O, 6 mL ODE, and 2 mL OA). Follow this with the continuous injection of a solution of 3 mmol S, 0.6 mL OA, and 2.4 mL ODE. Allow the shell to grow for 20 minutes before final purification [43].
Protocol 2: Conjugating QDs with Anti-Tropomyosin Antibodies
This protocol details the covalent coupling of carboxylated QDs to antibodies for use as detection probes in a sandwich LFIA [2] [6].
Materials:
- Carboxylated QDs (e.g., CdSe/ZnS): Core-shell structure with carboxylic acid surface groups.
- Anti-Tropomyosin Polyclonal IgG: Purified antibody.
- EDC (1-Ethyl-3-(3-dimethylaminopropyl)carbodiimide) and sulfo-NHS (N-hydroxysulfosuccinimide sodium salt): Crosslinking agents for carbodiimide chemistry.
- Buffers: Phosphate Buffered Saline (PBS), Borate buffer.
Procedure:
- Activation of QDs: Dilute the carboxylated QDs in a suitable buffer (e.g., MES, pH 5-6). Add a fresh-prepared mixture of EDC and sulfo-NHS to the QD solution. The typical molar excess of EDC/sulfo-NHS to QDs is 1000:1 to 10,000:1. Incubate the mixture for 15-30 minutes at room temperature with gentle agitation to activate the carboxyl groups, forming amine-reactive esters.
- Purification: Remove excess crosslinkers by passing the reaction mixture through a size-exclusion chromatography column or by centrifugation using a molecular weight cutoff filter.
- Antibody Conjugation: Immediately mix the activated QDs with the purified anti-tropomyosin antibody. The optimal ratio of antibody to QD must be determined empirically but often ranges from 5:1 to 20:1 (w/w). Incubate the conjugation reaction for 1-2 hours at room temperature or overnight at 4°C with gentle shaking.
- Blocking and Storage: To quench any remaining active esters and block unreacted sites, add a blocking agent such as ethanolamine or BSA to the solution and incubate for an additional 30 minutes. The final QD-antibody conjugates can be stored in a stabilizing buffer (e.g., PBS with 1% BSA) at 4°C protected from light [2].
The Scientist's Toolkit: Essential Reagents for QD-Based LFIA Development
Table 2: Key Research Reagent Solutions for QD-LFIA Development
| Reagent/Material | Function/Description | Application in Tropomyosin LFIA |
|---|---|---|
| Alloyed-Core/Shell QDs (e.g., CdSe/ZnS) | Fluorescent nanolabel with high quantum yield and photostability. Optimized shell thickness enhances brightness. | Serves as the signal-generating probe in the lateral flow strip. |
| Carboxylated QD Surface | Provides chemically reactive groups (-COOH) for covalent bioconjugation to biomolecules using EDC/sulfo-NHS chemistry. | Enables stable attachment of anti-tropomyosin antibodies to the QD surface. |
| EDC and sulfo-NHS | Crosslinking agents that facilitate the formation of amide bonds between carboxyl groups on QDs and amine groups on antibodies. | Critical for creating the QD-antibody conjugate detection probe. |
| Anti-Tropomyosin Antibodies (pAb/mAb) | Immunological recognition elements that specifically bind to the target tropomyosin allergen. | Used both as the capture antibody on the test line and the detection antibody conjugated to QDs. |
| Tropomyosin (Recombinant/Purified) | The major allergen protein from shrimp, used as a standard for calibration and validation. | Essential for assay development, optimization, and determining sensitivity (LOD). |
Visualizing the Optimization Workflow and Assay Principle
The following diagrams illustrate the logical workflow for optimizing QDs for an LFIA and the fundamental principle of the resulting QD-based sandwich assay.
Diagram 1: QD Optimization Workflow for LFIA. This flowchart outlines the key experimental stages, from QD synthesis to final assay validation, for identifying the optimal QD probe.
Diagram 2: QD-based Sandwich LFIA Principle. The target tropomyosin allergen binds to the QD-antibody conjugate and is subsequently captured at the test line, resulting in a fluorescent signal proportional to the analyte concentration.
The strategic optimization of quantum dot size and shell thickness is a critical determinant in the success of a high-performance sandwich LFIA. A thicker shell reliably enhances QD brightness and quantum yield, leading to a more sensitive assay. However, this optimization must be contextualized within the constraints of the assay format, including the efficiency of bioconjugation and lateral flow dynamics. The protocols and data summarized herein provide a clear framework for researchers to engineer QD probes that maximize the detection capability for shrimp tropomyosin and other clinically relevant allergens, ultimately contributing to improved food safety and public health.
Quantum dot-based lateral flow immunoassays (QD-LFIAs) represent a significant advancement in rapid detection technologies, offering superior sensitivity and multiplexing capabilities for applications such as shrimp tropomyosin (TM) allergen detection. However, the practical implementation of these assays is often hampered by inherent nanomaterial limitations, including signal blinking, photobleaching, and oxidative quenching. This application note systematically addresses these challenges by presenting validated strategies to enhance QD stability and assay performance. We provide detailed protocols for implementing silver deposition techniques, optimizing conjugation chemistry, and formulating protective buffer systems specifically within the context of sandwich lateral flow immunoassays for shrimp TM detection. The methodologies outlined herein are designed to empower researchers in developing robust, reliable QD-LFIA systems that maintain analytical performance while overcoming critical photophysical limitations of quantum dot reporters.
Quantum dots (QDs) have emerged as superior fluorescent labels in lateral flow immunoassays (LFIAs), particularly for detecting food allergens like shrimp tropomyosin, due to their broad absorption spectra, narrow emission bands, and high quantum yield [38] [42]. Their exceptional photophysical properties enable the development of highly sensitive sandwich immunoassays capable of detecting TM at concentrations as low as 0.01 μg/mL [2] [6]. Despite these advantages, the widespread adoption of QD-based detection systems has been constrained by several inherent material limitations that compromise assay reliability.
The core challenges in QD-LFIA implementation include photobleaching (irreversible loss of fluorescence under prolonged illumination), blinking (random fluorescence intermittency), and oxidative quenching (signal loss due to environmental factors) [46]. These phenomena can result in signal degradation, increased false-negative rates, and ultimately diminished assay accuracy, particularly in point-of-care settings where controlled lighting conditions cannot be guaranteed [46]. For sensitive applications such as allergen detection in processed foods, where TM concentrations may be minimal and matrix effects pronounced, these limitations become particularly problematic [2] [13].
This application note presents a comprehensive framework for addressing these challenges through material engineering, assay design optimization, and signal enhancement strategies. By implementing the protocols outlined herein, researchers can significantly improve the performance and reliability of QD-based sandwich LFIAs for shrimp tropomyosin detection and related applications.
QD Limitations and Impact on LFIA Performance
Understanding the specific mechanisms and consequences of QD limitations is essential for developing effective mitigation strategies. The following table summarizes the core challenges, their underlying causes, and their impact on assay performance.
Table 1: Core Limitations of Quantum Dots in Lateral Flow Immunoassays
| Limitation | Underlying Mechanism | Impact on LFIA Performance |
|---|---|---|
| Blinking | Random, reversible fluorescence intermittency caused by charge trapping and Auger recombination [46]. | Erratic signal quantification, reduced measurement precision, compromised quantitative accuracy [46]. |
| Photobleaching | Irreversible photo-oxidation of the QD surface and core structure under prolonged illumination [46] [47]. | Signal loss over time, particularly during extended reading; increased false-negative rates [46]. |
| Oxidative Quenching | Interaction of the QD core with molecular oxygen and other reactive species in the environment [46]. | Progressive fluorescence degradation, reduced assay shelf-life, matrix-dependent signal variation [46]. |
The cumulative effect of these phenomena directly compromises the fundamental ASSURED (Affordable, Sensitive, Specific, User-friendly, Rapid/Robust, Equipment-free, and Deliverable to end users) criteria that define ideal point-of-care tests [38]. For shrimp TM detection, where the target protein may be present in trace amounts in complex processed food matrices, these limitations necessitate strategic intervention to ensure reliable results [2] [13].
Strategic Approaches for Mitigating QD Limitations
Silver Deposition for Signal Enhancement and Stabilization
Inspired by applications in tissue imaging, silver deposition on QD surfaces represents a promising strategy to overcome photonic limitations while enabling dual-mode detection [46]. This approach involves growing silver clusters on QD surfaces, which enhances signal intensity and provides a stable colorimetric readout complementary to fluorescence measurement.
Table 2: Performance Enhancement via Silver Deposition in QD-LFIA
| Performance Metric | Standard QD-LFIA | QD-LFIA with Silver Deposition | Improvement Factor |
|---|---|---|---|
| Signal Intensity | Baseline | 4-fold enhancement | 4x [46] |
| Detection Limit | Reference value | 2.5-fold improvement | 2.5x [46] |
| False-Negative Rate | Not specified | Zero false-negatives reported | Significant reduction [46] |
| Readout Modalities | Fluorometric only | Both colorimetric and fluorometric | Dual-mode capability [46] |
The mechanism of enhancement involves the formation of a protective silver layer that reduces direct exposure of the QD core to oxygen and light, thereby mitigating oxidative quenching and photobleaching [46]. Additionally, the silver coating provides an alternative signal pathway through colorimetric detection, which is not susceptible to QD-specific photophysical limitations.
Material Selection and Core-Shell Engineering
Strategic selection of QD composition and structure plays a crucial role in determining nanomaterial stability. While traditional CdSe/ZnS QDs offer excellent optical properties, they suffer from cytotoxicity and oxidative susceptibility [47]. Advanced alternatives include:
- I-III-VI Type QDs: Materials such as AgInS₂ and CuInS₂ demonstrate reduced cytotoxicity while maintaining favorable band-gap control [47].
- Enhanced Core-Shell Structures: Implementing robust shell materials (e.g., ZnS) with optimized thickness provides superior passivation against environmental oxygen and water, directly addressing oxidative quenching [47].
- Polymer Encapsulation: Coating QDs with biocompatible polymers creates a physical barrier against quenching agents while improving biomolecule conjugation efficiency [42].
For shrimp TM detection, where assay robustness against complex food matrices is essential, investing in advanced QD architectures significantly improves operational stability and reduces false-negative results [2].
Assay Condition Optimization and Protective Formulations
Environmental factors during storage and operation significantly influence QD stability. Strategic optimization includes:
- Oxygen Scavengers: Incorporating ascorbic acid or other antioxidants in the running buffer competitively reacts with environmental oxygen, protecting the QD core [46].
- Light Exposure Management: Implementing light-protective packaging and minimizing unnecessary illumination during processing and reading reduces photobleaching [46].
- Storage Buffer Optimization: Formulations containing BSA (2%), sucrose (2.5%), and Tween-20 (0.25%) provide a stabilizing matrix that preserves QD functionality during long-term storage [46].
Experimental Protocols
Protocol: QD-Probe Synthesis via EDC/NHS Conjugation
This protocol describes the covalent conjugation of carboxylated QDs with anti-TM antibodies using carbodiimide chemistry, producing stable immunoprobes for sandwich LFIA development [46] [2].
Research Reagent Solutions:
- Carboxylated CdSe/ZnS QDs-525 (8 μM): Fluorescent nanocrystal core providing signal detection [46] [2].
- N-(3-(dimethylamino)propyl)-N′-ethylcarbodiimide hydrochloride (EDC.HCl): Activates carboxyl groups for conjugation [46] [2].
- N-hydroxy succinimide (NHS): Forms stable amine-reactive ester intermediate [46] [2].
- Protein G or anti-TM antibody: Biological recognition element for target capture [46] [2].
- Bovine Serum Albumin (BSA): Blocking agent that reduces non-specific binding [46].
Procedure:
- Activation Step: Combine 20 μL of carboxylated QDs (8 μM) with 8 μL of EDC (4 mg/mL in 10 mM PBS) and 6.8 μL of NHS (4 mg/mL in 10 mM PBS). Adjust total volume to 100 μL with PBS buffer. Incubate with gentle stirring at room temperature for 30 minutes [46].
- Conjugation Step: Add Protein G or anti-TM antibody (1 mg/mL in 10 mM PBS) at molar ratios between 1:1 and 1:5 (QD:protein). Optimize ratio for maximum activity. Incubate at room temperature for 2 hours on a rotating wheel in the dark [46].
- Stabilization Step: Add 10 μL of BSA (100 mg/mL) with stirring for 1 hour to block residual activated sites [46].
- Purification Step: Centrifuge at 7000 ×g for 3 minutes to remove aggregated QDs. Collect supernatant containing conjugated QDs for characterization and strip application [46].
Quality Control:
- Evaluate conjugation efficiency using fluorescence spectrometry comparing free vs. conjugated QDs [46].
- Validate binding capability through preliminary LFIA tests with TM-positive controls [2].
Protocol: Silver Enhancement for Dual-Mode Detection
This protocol details the application of silver deposition on QD-based test lines to enhance signal stability and enable both colorimetric and fluorometric detection [46].
Research Reagent Solutions:
- Silver Enhancer A (0.2% silver nitrate): Source of silver ions for deposition [46].
- Silver Enhancer B (1% hydroquinone): Reducing agent that facilitates silver metal formation [46].
- Developing Buffer (10 mM PBS, pH 7.4): Maintains optimal pH for the enhancement reaction [46].
Procedure:
- LFIA Development: First run the sample through the QD-LFIA strip following standard procedures, allowing TM capture at the test line [46].
- Enhancer Application: Prepare fresh silver enhancement solution by mixing Silver Enhancer A and B according to manufacturer's instructions (typically 1:1 ratio). Apply mixture directly to the test strip membrane [46].
- Controlled Deposition: Incubate for 27 minutes for colorimetric detection or 12 minutes for fluorometric detection. Precisely control deposition time to prevent background staining [46].
- Signal Reading: For quantitative analysis, use fluorometric reading at 12 minutes. For visual or colorimetric analysis, read at 27 minutes when silver deposition produces visible gray-black bands [46].
Optimization Notes:
- Deposit silver directly on QDs in the test zone to form a protective layer [46].
- The approach maintains cost-effectiveness while improving signal stability and offering dual readout capabilities [46].
Protocol: Sandwich LFIA for Shrimp Tropomyosin Detection
This comprehensive protocol integrates stabilized QD-probes into a complete sandwich immunoassay for detecting shrimp TM in processed food samples [2].
Research Reagent Solutions:
- Coating Antigen (0.5 mg/mL): TM or anti-TM antibody spotted on NC membrane as capture reagent [46] [2].
- Goat-anti-mouse IgG (0.35 mg/mL): Control line antibody to validate strip function [46].
- Running Buffer (PBST: 10 mM PBS with 0.05% Tween-20, pH 7.4): Facilitates sample flow and specific binding [46].
- Blocking Buffer (PBS with 0.02% NaN₃, 2% BSA, 2.5% sucrose, 0.25% Tween-20): Preserves conjugate pad functionality during storage [46].
Procedure:
- Strip Assembly:
- Cut sample pad (2 × 30 cm) and treat with blocking buffer. Dry at 37°C for 2 hours [46].
- Spot coating antigen (0.5 mg/mL) and goat anti-mouse IgG (0.35 mg/mL) on NC membrane (3 × 30 cm) to form test and control lines [46].
- Assemble sample pad, NC membrane, and absorbent pad on PVC backing card with 1-2 mm overlaps [46].
Sample Preparation:
Assay Execution:
- Apply 100 μL of sample extract to the sample pad and allow to migrate for 10 minutes [2].
- If using silver enhancement, apply enhancement solution according to Protocol 4.2 after initial development [46].
- Read results: fluorometric reading at 12 minutes, colorimetric at 27 minutes, or as optimized [46].
Performance Validation:
- The method achieves visual detection limit of 0.05 μg/mL and instrumental detection limit of 0.01 μg/mL for TM [2].
- Confirm specificity using TM-negative samples; cross-reactivity should be minimal except with related crustacean species [2] [6].
- Intra- and inter-assay coefficients of variation should fall below 12% and 21%, respectively [2].
The Scientist's Toolkit
Table 3: Essential Research Reagent Solutions for QD-LFIA Development
| Reagent/Chemical | Function/Application | Specification Notes |
|---|---|---|
| Carboxylated CdSe/ZnS QDs | Fluorescent signal reporter | Core-shell structure with 300-500 surface -COOH groups for conjugation [46]. |
| EDC/NHS Crosslinkers | Covalent antibody-QD conjugation | High-purity grades for efficient carbodiimide coupling chemistry [46] [2]. |
| Silver Enhancement System | Signal amplification & stabilization | Two-component system (silver salt + reducing agent) [46]. |
| Anti-TM Antibodies | Target recognition & capture | Monoclonal or polyclonal; validate specificity for shrimp TM [2] [13]. |
| Nitrocellulose Membrane | Chromatographic substrate | 10 μm pore size recommended for optimal flow and binding [46]. |
| Blocking Buffer Components | Reduce non-specific binding | BSA (2%), sucrose (2.5%), Tween-20 (0.25%) in PBS [46]. |
The strategic integration of silver deposition technology with advanced QD materials and optimized assay conditions effectively addresses the fundamental limitations of blinking, photobleaching, and oxidative quenching in quantum dot-based lateral flow immunoassays. The protocols presented herein provide researchers with comprehensive methodologies for developing robust, high-performance detection systems for shrimp tropomyosin and other analytes of interest. By implementing these strategies, scientists can significantly enhance signal stability, reduce false-negative rates, and extend assay shelf-life while maintaining the cost-effectiveness and practical utility essential for point-of-care applications. The dual-mode detection capability afforded by the silver enhancement technique further increases assay versatility, making these advanced QD-LFIA systems particularly valuable for food safety monitoring and clinical diagnostics where reliability is paramount.
The development of a robust quantum-dot (QD)-based lateral flow immunoassay (LFIA) for the detection of shrimp tropomyosin demands meticulous optimization to minimize background noise. High background signal can severely compromise the sensitivity and limit of detection (LoD) of the assay, rendering it ineffective for low-abundance analyte detection. This application note provides detailed protocols and data for reducing background interference through three pivotal strategies: effective blocking of the nitrocellulose membrane, optimization of the incubation buffer, and management of endogenous biotin. By implementing these procedures, researchers can significantly enhance the signal-to-noise ratio (S/N) in their QD-LFIA systems, achieving the high sensitivity required for accurate tropomyosin detection [48].
Research Reagent Solutions
The following table catalogues the essential reagents and materials critical for implementing the background reduction strategies outlined in this document.
Table 1: Key Research Reagents and Their Functions in Background Reduction
| Reagent/Material | Function/Application | Key Considerations |
|---|---|---|
| Qdot Incubation Buffer | Optimized buffer for diluting and incubating QD conjugates. | Formulated to minimize nonspecific binding of QD conjugates to the membrane or sample pad [49]. |
| Bovine Serum Albumin (BSA) | A common blocking agent used to passivate unused binding sites on the nitrocellulose membrane. | Reduces nonspecific adsorption of antibodies and QD probes; typically used at 1-5% (w/v) [50]. |
| Tween 20 | A non-ionic surfactant added to buffers. | Redces hydrophobic interactions and minimizes aggregation of reagents; used in running buffers (e.g., 1.5% v/v) and incubation buffers (e.g., 0.05%) [49] [50]. |
| Avidin/Biotin Blocking Kit | A sequential blocking system for samples with high endogenous biotin. | Prevents nonspecific signal from endogenous biotin by saturating its binding sites before applying biotinylated antibodies or QD-streptavidin conjugates [49]. |
| Pluronic F-68 | A non-ionic surfactant. | Helps maintain colloidal stability of QD conjugates in buffer, preventing aggregation and subsequent background [49]. |
| Biotinylated Antibodies | Secondary recognition elements in a sandwich immunoassay. | Must be titrated to optimal concentration; overly high concentrations lead to nonspecific binding and high background [49]. |
| Qdot Streptavidin Conjugates | Signal-generating nanoprobes for detection. | Concentration must be optimized; concentrations substantially higher than saturation will compromise the assay with higher background levels [49]. |
Effective Blocking Strategies
Nonspecific binding of detection components to the solid phase is a primary source of background noise. A robust blocking protocol is essential.
Protocol: Membrane Blocking and Sample Treatment
Materials:
- Nitrocellulose membrane (e.g., EMD Millipore HF180MC100)
- Blocking agent: Bovine Serum Albumin (BSA) or appropriate animal serum
- Running Buffer: 1x Tris-buffered saline (TBS) or Phosphate-buffered saline (PBS)
- Avidin/Biotin Blocking Kit (e.g., from Vector Laboratories)
Procedure:
- Membrane Blocking:
- After dispensing test and control lines, immerse the entire nitrocellulose card in a blocking solution containing 1-5% (w/v) BSA (or 5% normal serum from an unrelated species) in running buffer (e.g., PBS or TBS) [50].
- Incubate for 30-60 minutes at room temperature with gentle agitation.
- Dry the membrane card thoroughly for at least 2 hours in an incubator at 37°C [50].
- Blocking for Endogenous Biotin:
- For tissues or samples suspected of high endogenous biotin (e.g., spleen, kidney), employ a specific avidin/biotin blocking step [49].
- Apply the avidin solution from the blocking kit to the sample first, incubate for 15-20 minutes, and wash.
- Subsequently, apply the biotin solution, incubate for another 15-20 minutes, and wash thoroughly before proceeding with the assay.
Data Interpretation
Effective blocking results in a clear background, allowing the test line to be distinctly visible against the membrane. Inadequate blocking manifests as a general haze or high background signal across the strip, which can obscure weak positive results. The use of a dedicated avidin/biotin block is confirmed by a reduction in nonspecific streaking in samples known to be rich in endogenous biotin.
Buffer Optimization for QD Stability
The buffer matrix is critical for maintaining the colloidal stability of QD conjugates and preventing their nonspecific deposition.
Protocol: Preparation and Use of Optimized QD Incubation Buffer
Materials:
- Qdot Incubation Buffer (commercially available or formulated in-house)
- Tris, HEPES, phosphate, or borate buffer (pH 6-9)
- NaCl
- Surfactants: Tween 20, Triton-X-100, or Pluronic F-68
- EDTA
Procedure:
- Base Buffer: Prepare a buffer system such as 2 mM Borate Buffer or 1x TBS/PBS. The pH should be maintained between 6.0 and 9.0 for optimal QD stability [49].
- Additives: Supplement the base buffer with stabilizers. A recommended formulation includes:
- Salt Concentration: Keep the NaCl concentration at or below 200 mM to prevent microscopic precipitation of QD conjugates [49].
- Filtration: Before use, spin the incubation buffer in a benchtop centrifuge at 5000 x g for 2 minutes or pass it through a 0.2 µm spin filter to remove any microscopic precipitates or aggregates that contribute to a grainy background [49].
- Usage: Always dilute and incubate the Qdot Streptavidin Conjugates in this optimized buffer immediately before application to the strip.
Data Interpretation
The success of buffer optimization can be quantitatively and qualitatively assessed. The table below summarizes key parameters and their expected outcomes.
Table 2: Buffer Optimization Parameters and Expected Outcomes
| Parameter | Suboptimal Condition | Optimized Condition | Observed Outcome |
|---|---|---|---|
| Surfactant | Absent or low concentration | 0.05% Tween 20 or Pluronic F-68 | Reduced hydrophobic-based aggregation and background. |
| Salt (NaCl) | >200 mM | ≤200 mM | Prevents precipitation of QDs, eliminating grainy background [49]. |
| Stabilizer (BSA/Sucrose) | Absent | 1% BSA, 5% Sucrose | Prevents nonspecific binding and stabilizes QDs during flow. |
| Filtration | Not performed | 0.2 µm filtration | Removes pre-existing aggregates, resulting in a clean, uniform background. |
Managing Endogenous Biotin
Shrimp tissue samples can contain endogenous biotin, which, if unblocked, will bind streptavidin-based QD conjugates and generate false-positive signals.
The following diagram illustrates the logical workflow for diagnosing and mitigating high background noise, integrating the strategies of blocking, buffer optimization, and endogenous biotin management.
Diagram 1: Background noise mitigation workflow.
Integrated Workflow for a Low-Noise QD-LFIA
This section integrates the individual protocols into a complete, sequential workflow for developing a low-background QD-LFIA for tropomyosin detection.
Diagram 2: Low-noise QD-LFIA assembly and run workflow.
The detection of food allergens, such as shrimp tropomyosin (TM), represents a significant challenge in food safety and public health. Trace amounts of TM can trigger severe allergic reactions, necessitating the development of rapid, sensitive, and reliable detection methods. Lateral flow immunoassays (LFIAs) have emerged as a prominent point-of-care diagnostic tool due to their simplicity, low cost, and rapid results. However, conventional LFIAs often suffer from insufficient sensitivity, limiting their application for early detection and accurate quantification. This application note details an advanced signal amplification strategy that integrates silver deposition on a quantum-dot-based sandwich LFIA to achieve dual colorimetric and fluorometric readouts for the ultrasensitive detection of shrimp tropomyosin. The protocol is framed within a broader thesis on enhancing the performance of immunoassays in food allergen research, providing researchers and scientists with a detailed methodology to significantly improve detection limits and enable robust quantification.
Diagram 1: Dual-Mode Detection Workflow
Principle of the Integrated Assay
The core of this advanced detection system is a sandwich lateral flow immunoassay constructed with quantum dot (QD)-labeled polyclonal antibodies. QDs are semiconductor nanoparticles known for their narrow emission spectrum, wide excitation range, and high fluorescence quantum yield, making them excellent fluorescent labels for bioassays [2]. In the initial detection phase, the captured tropomyosin at the test line generates a fluorescent signal proportional to the analyte concentration. To further amplify the signal and introduce a second readout modality, a silver deposition step is incorporated. The metallic silver coating on the QDs enhances the signal through two distinct mechanisms: (1) it provides a dark colorimetric signal visible to the naked eye due to light absorption and scattering, and (2) it can modulate the fluorescence signal of the QDs, allowing for dual-mode detection from a single assay platform. This combination leverages the high sensitivity of fluorescence detection with the simplicity of colorimetric readout, enabling both rapid qualitative assessment and precise quantitative analysis.
Experimental Protocols
Preparation of the Quantum Dot Fluorescent Probe
Objective: To conjugate carboxylated quantum dots with anti-TM polyclonal IgG for use as the detection antibody in the LFIA strip.
Materials and Reagents:
- Carboxylated CdSe/ZnS quantum dots (QDs)
- Rabbit anti-Tropomyosin (TM) polyclonal IgG
- 1-Ethyl-3-(3-dimethylaminopropyl) carbodiimide hydrochloride (EDC)
- N-hydroxysulfosuccinimide sodium salt (sulfo-NHS)
- Borate buffer (0.05 M, pH 7.4)
- Ultrapure water
- Centrifugal filter units (100 kDa MWCO)
Procedure:
- QD Activation: Dilute the carboxylated QDs to a final concentration of 1 µM in 200 µL of borate buffer. Add 20 µL of freshly prepared EDC solution (10 mg/mL) and 20 µL of sulfo-NHS solution (10 mg/mL) to the QD suspension.
- Incubation: Mix the reaction mixture thoroughly and incubate at room temperature for 30 minutes with gentle shaking to activate the carboxyl groups on the QD surface.
- Conjugation: Add 50 µg of rabbit anti-TM polyclonal IgG to the activated QDs. Adjust the total reaction volume to 500 µL with borate buffer and incubate for 2 hours at room temperature with continuous gentle mixing.
- Purification: To remove excess, unreacted reagents, transfer the conjugation mixture to a 100 kDa centrifugal filter unit. Centrifuge at 8,000 × g for 10 minutes and discard the flow-through. Wash the retained QD-antibody conjugates with 500 µL of borate buffer. Repeat this washing step three times.
- Storage: Finally, resuspend the purified QD-antibody conjugate probe in 200 µL of borate buffer containing 1% (w/v) BSA and 0.1% (w/v) sodium azide. Store at 4°C in the dark for future use. The conjugate is stable for up to 3 months.
Quantum-Dot-Based Sandwich LFIA Procedure
Objective: To perform the rapid detection of tropomyosin using the prepared QD-antibody conjugate in a sandwich immunoassay format.
Materials and Reagents:
- LFIA strips (consisting of sample pad, conjugation pad, nitrocellulose membrane, and absorbent pad)
- Prepared QD-anti-TM conjugate
- Purified anti-TM antibody (for test line)
- Goat anti-rabbit IgG (for control line)
- Phosphate-buffered saline (PBS, 0.01 M, pH 7.4)
- Test samples (food extracts or standard TM solutions)
- Fluorescent strip reader
Procedure:
- Strip Preparation: The LFIA strips are pre-fabricated with a test line (coated with capture anti-TM antibody) and a control line (coated with goat anti-rabbit IgG). The QD-anti-TM conjugate is pre-dispensed and dried on the conjugation pad.
- Sample Application: Apply 100 µL of the test sample (food extract or standard TM solution) to the sample pad of the LFIA strip.
- Migration and Reaction: Allow the sample to migrate along the strip by capillary action. The sample will rehydrate the QD conjugate in the conjugation pad. If TM is present, it will bind to the QD-antibody conjugate to form a complex. This complex continues to migrate until it is captured by the immobilized antibody at the test line, forming a sandwich immunocomplex.
- Washing (Optional): For enhanced sensitivity, a washing step with 50 µL of PBS buffer (pH 7.4) can be applied after the sample has fully migrated.
- Initial Fluorescence Reading: After 10 minutes of development, place the strip in a fluorescent reader to measure the fluorescence intensity at the test line. The instrument detection limit (IDL) for this QD-LFIA can be as low as 0.01 µg/mL for TM [2] [6].
Silver Deposition for Signal Amplification
Objective: To enhance the signal intensity of the test line by depositing metallic silver onto the captured QDs, enabling dual colorimetric and fluorometric readouts.
Materials and Reagents:
- Silver enhancement solution A (containing silver salt, e.g., AgNO₃)
- Silver enhancement solution B (containing a reducing agent, e.g., hydroquinone)
- Development buffer
Procedure:
- Solution Preparation: Immediately before use, mix silver enhancement solutions A and B with the development buffer in a 1:1:2 ratio to form the working silver enhancement solution.
- Deposition Reaction: After the initial fluorescence reading and once the strip is dry, apply 50-100 µL of the working silver enhancement solution directly onto the test and control line areas of the nitrocellulose membrane.
- Incubation: Allow the silver enhancement reaction to proceed for 2-5 minutes at room temperature. The metallic silver will deposit onto the QDs at the test line, forming a dark gray-to-black band.
- Reaction Termination: Rinse the strip gently with ultrapure water to stop the silver deposition reaction. Air-dry the strip completely.
- Dual-Mode Readout:
- Colorimetric Analysis: Observe the strip with the naked eye. A distinct dark band at the test line indicates a positive result. The visual detection limit (VDL) can be improved compared to the standard QD-LFIA.
- Fluorometric Analysis: Re-scan the strip with the fluorescent reader. The silver deposition can alter the fluorescence signal (e.g., through quenching or surface plasmon-enhanced fluorescence), providing a second quantitative measurement that can offer a different dynamic range or confirmatory data.
Data Presentation and Analysis
The performance of the integrated assay is summarized by comparing key analytical parameters before and after silver enhancement.
Table 1: Performance Comparison of LFIA Formats for Tropomyosin Detection
| Analytical Parameter | Standard QD-LFIA [2] | QD-LFIA with Silver Enhancement (Theoretical) | Conventional Gold-NP LFIA [51] |
|---|---|---|---|
| Visual Detection Limit (VDL) | 0.05 µg/mL | < 0.05 µg/mL (Improved) | ~0.1-1 µg/mL |
| Instrument Detection Limit (IDL) | 0.01 µg/mL | < 0.01 µg/mL (Improved) | N/A |
| Total Assay Time | < 10 minutes | ~12-15 minutes | < 10 minutes |
| Dynamic Range | Demonstrated for 0.01-1 µg/mL | Expected to be wider | Narrower |
| Readout Modes | Fluorometric | Colorimetric & Fluorometric | Colorimetric |
Table 2: Analytical Figures of Merit for Dual-Signal Probes in Metal Ion Detection (Conceptual Reference)
| Probe Composition | Target Analyte | Detection Mode | Linear Range | Limit of Detection (LOD) | Reference |
|---|---|---|---|---|---|
| AgNPs-L-Cys-Rh6G2 | Cu²⁺ | Fluorometric | 100–450 µM | 0.169 µM | [52] |
| Colorimetric | 150–650 µM | 1.36 µM | |||
| AgNPs-GSH-Rh6G2 | Cu²⁺ | Fluorometric | 0.10–0.45 mM | 0.18 µM | [53] |
| Colorimetric | 0.15–0.65 mM | 24.90 µM |
Table 2 provides examples of dual-signal probes from related fields, illustrating the typical performance characteristics that can be achieved with such systems. The proposed QD-silver deposition system for TM detection aims to achieve similar dual-mode functionality.
The Scientist's Toolkit: Essential Research Reagents
This section lists the critical reagents and materials required to successfully implement the described protocol.
Table 3: Key Research Reagent Solutions
| Item | Function/Brief Explanation | Example / Key Characteristic |
|---|---|---|
| Carboxylated QDs | Fluorescent label for the immunoassay. Their high quantum yield and photostability provide the initial sensitive detection signal. | CdSe/ZnS core-shell QDs [2]. |
| Anti-TM Antibodies | Specific recognition elements for shrimp tropomyosin. Both capture (immobilized) and detection (QD-labeled) antibodies are required for the sandwich assay. | Rabbit anti-TM polyclonal IgG [2]. |
| EDC / Sulfo-NHS | Cross-linking agents for covalent conjugation of antibodies to the carboxylated QDs via carbodiimide chemistry. | >95% purity for efficient conjugation [2]. |
| Silver Enhancement Kit | Provides the reagents (silver salt and reducer) for the metallic deposition that amplifies the signal for dual readouts. | Yields a dark colorimetric signal and modulates fluorescence. |
| Nitrocellulose Membrane | The porous matrix of the LFIA strip where capillary flow occurs and the test/control lines are immobilized. | High protein-binding capacity and consistent flow rate. |
| Fluorescent Strip Reader | Instrument for quantifying the fluorescence signal from the test line, enabling precise quantification of the analyte. | Compatible with the emission wavelength of the chosen QDs. |
The integration of silver deposition with a quantum-dot-based sandwich LFIA creates a powerful platform for the sensitive and reliable detection of shrimp tropomyosin. This protocol provides a detailed roadmap for achieving dual colorimetric and fluorometric readouts, thereby enhancing the utility of the assay for both field-use screening and laboratory-based quantitative analysis. The method significantly improves upon the limitations of conventional LFIAs and offers researchers a robust tool for food allergen monitoring, quality control in food production, and ultimately, the protection of consumers with food allergies.
For researchers developing immunoassays for shrimp tropomyosin (TM), achieving high specificity to avoid cross-reactivity with mollusks and other phylogenetically related species is a paramount challenge. Cross-reactivity in immunoassays primarily occurs due to the recognition of conserved epitopes in non-target allergens by the assay's antibodies. This application note details targeted strategies and protocols to minimize such cross-reactivity, with a specific focus on enhancing the performance of quantum-dot-based sandwich lateral flow immunoassays (LFIA). The recommendations are framed within a research context aimed at ensuring that detection methods are both highly sensitive and diagnostically specific, thereby improving the safety and reliability of food products for allergic consumers.
Strategic Target and Assay Design
The foundational step in minimizing cross-reactivity lies in the strategic selection of the target protein and the design of the assay format.
Target Antigen Selection: Beyond Tropomyosin
While TM is the major shrimp allergen, its high sequence homology across invertebrates (e.g., mollusks, insects, mites) makes it prone to cross-reactivity [54] [55]. A promising strategy is to target alternative or combination of allergens.
- Sarcoplasmic Calcium-Binding Protein (SCP): Recent research highlights SCP as an excellent target for specific crustacean detection. SCP is a significant allergen recognized by 29-50% of crustacean-allergic patients and demonstrates high stability to thermal processing [54] [55]. Crucially, SCP exhibits "excellent specificity distinguishing crustaceans from mollusks, insects, and other species" [54]. Developing antibodies against SCP, either alone or in a multi-target approach with TM, can significantly enhance assay specificity.
- Epitope-Specific Antibody Development: If TM remains the primary target, the focus must shift to developing monoclonal antibodies (mAbs) that target unique, crustacean-specific epitopes of TM. This involves mapping the immunodominant regions of shrimp TM and identifying sequences with low homology to mollusk TM for antibody production [54].
Assay Format Considerations
The sandwich ELISA and LFIA format is generally preferred over competitive formats for large protein allergens like TM, as it is less prone to false negatives and matrix effects [14]. The use of two distinct antibodies for capture and detection in a sandwich format provides a higher level of specificity.
The following diagram illustrates the core strategic pathway for achieving high specificity in allergen detection.
Experimental Protocols for Specificity Assessment
A rigorous validation protocol is essential to empirically confirm assay specificity. The following methods should be employed during assay development.
Protocol: Cross-Reactivity Profiling via Western Blotting
This protocol is used to evaluate the specificity of antisera or purified antibodies against a panel of related species.
- Objective: To confirm that antibodies recognize the target protein (e.g., TM ~36 kDa or SCP ~20-24 kDa) in crustaceans but not in mollusks or other non-target species.
- Materials:
- Purified protein extracts from shrimp, crab, lobster (target crustaceans), and mollusks (e.g., clam, mussel, oyster), insects (e.g., cockroach), and mites.
- Pre-cast SDS-PAGE gels (4-20% gradient).
- Nitrocellulose or PVDF membrane.
- Primary antibody: Rat or rabbit anti-SCP (or anti-TM) antisera/purified IgG [54].
- Secondary antibody: HRP-labeled anti-rat or anti-rabbit IgG.
- Chemiluminescent substrate and imaging system.
- Procedure:
- Sample Preparation: Load 20 μg of each protein extract per lane on an SDS-PAGE gel. Include a molecular weight marker.
- Electrophoresis: Run the gel at constant voltage (120-150V) until the dye front reaches the bottom.
- Transfer: Electrophoretically transfer proteins from the gel to a membrane.
- Blocking: Incubate the membrane with 5% non-fat dry milk in TBST for 1 hour.
- Primary Antibody Incubation: Incubate with the primary antibody (diluted as predetermined) overnight at 4°C.
- Washing: Wash the membrane 3 times with TBST for 5 minutes each.
- Secondary Antibody Incubation: Incubate with the HRP-conjugated secondary antibody for 1 hour at room temperature.
- Detection: Apply chemiluminescent substrate and image the membrane.
- Expected Outcome: Specific antisera will show positive bands at the correct molecular weight for crustacean samples (shrimp, crab) and no detectable bands for mollusk, insect, and mite samples [54].
Protocol: Specificity Evaluation in a Quantum-Dot LFIA Format
This protocol tests the final assay format with a panel of potential cross-reactants.
- Objective: To determine if the developed QD-LFIA strip produces false-positive signals with non-target species.
- Materials:
- Completed QD-LFIA strips with test (T) and control (C) lines.
- Protein extracts from target (shrimp) and non-target species (mollusks, insects, fish, etc.), diluted in appropriate buffer.
- Fluorescence strip reader or UV lamp for visual assessment.
- Procedure:
- Sample Application: Apply 100 μL of each sample extract to the sample pad of the LFIA strip.
- Development: Allow the strip to develop for 10-15 minutes at room temperature.
- Reading: Read the fluorescence signal at the test line using a strip reader or visually under UV light.
- Analysis: A positive result is indicated by a fluorescent band at the T-line. The test is valid only if the C-line is visible.
- Expected Outcome: A highly specific assay will show positive results only for shrimp and possibly other crustaceans, with no visible T-line for mollusks and other non-target species [6] [14].
Data Presentation and Analysis
Quantitative data from specificity and performance evaluations should be systematically summarized for easy comparison.
Table 1: Comparative Analysis of Target Allergens for Specific Crustacean Detection
| Target Allergen | Molecular Weight | Thermal Stability | Reported Specificity Against Mollusks | Key Advantage |
|---|---|---|---|---|
| Tropomyosin (TM) | ~36 kDa | High | Low to Moderate; known cross-reactivity [55] | Major allergen; high IgE reactivity |
| Sarcoplasmic Calcium-Binding Protein (SCP) | 20-24 kDa | High (stable to heat/pH) | High; distinguishes crustaceans from mollusks, insects, mites [54] | Excellent specificity; stable target |
| Arginine Kinase (AK) | 38-45 kDa | Low (thermo-labile) | Moderate; involved in cross-reactions [55] | Relevant allergen, but less stable |
Table 2: Performance Metrics of Specific vs. Cross-Reactive Immunoassays
| Assay Parameter | SCP-targeted icELISA [54] | TM-targeted Commercial Kits (Typical) [54] | QD-LFIA for Shrimp TM [6] [14] |
|---|---|---|---|
| Detection Limit | 0.11 mg/kg (icELISA) | Varies | 0.01 μg/mL (instrumental) |
| Specificity (vs. Mollusks) | Excellent | Uncertain; often exhibits cross-reactivity | Reported as high in one study [14] |
| Key Specificity Finding | No cross-reaction with clam, oyster, mite, or cockroach [54] | Cross-reaction with fish, shellfish, and cockroach reported [54] | "No cross-reactivity with other species except shrimp" [14] |
The Scientist's Toolkit: Research Reagent Solutions
The following table details essential materials and their functions for developing specific immunoassays.
Table 3: Essential Reagents for High-Specificity Allergen Detection Development
| Research Reagent / Material | Function in Assay Development | Example from Literature |
|---|---|---|
| Recombinant SCP or TM Protein | Serves as a pure, consistent immunogen for antibody production and as a standard for assay calibration. | Recombinant SCP of P. trituberculatus was used to generate specific antisera [54]. |
| Monoclonal Antibodies (mAbs) | Provide a consistent, homogeneous source of antibodies targeting a single, unique epitope, which is critical for minimizing cross-reactivity. | Kamath et al. emphasized the need for mAbs targeting specific TM regions to differentiate crustaceans and mollusks [54]. |
| Carboxylated Quantum Dots (QDs) | Act as fluorescent labels conjugated to detection antibodies, providing high signal intensity and stability in sandwich LFIA. | CdSe/ZnS core-shell QDs were used as fluorescent probes in a sandwich LFIA for TM [14]. |
| Species-Specific Protein Extracts | Used for comprehensive specificity testing to identify and rule out cross-reactivity with non-target organisms. | Extracts from mollusks (clam), insects (cockroach), and mites were used to validate SCP assay specificity [54]. |
| Cross-linking Reagents (EDC/sulfo-NHS) | Facilitate the covalent conjugation of antibodies to QDs or other labels via carboxyl-to-amine coupling. | EDC and sulfo-NHS were used to conjugate rabbit anti-TM IgG with carboxylated QDs [14]. |
Minimizing cross-reactivity in the detection of shrimp tropomyosin requires a multi-faceted approach. By strategically selecting specific allergen targets like SCP, employing carefully characterized monoclonal antibodies in a sandwich assay format, and implementing rigorous validation protocols against a comprehensive panel of related species, researchers can significantly enhance the specificity of quantum-dot-based LFIAs. These methodologies ensure that the final diagnostic tool is not only sensitive and rapid but also reliable, providing accurate results that are crucial for protecting consumers with food allergies.
Benchmarking Assay Performance: Validation, Comparative Analysis, and Real-World Application
This application note provides detailed protocols for establishing key analytical figures of merit (AFOM) in the development of a quantum-dot-based sandwich lateral flow immunoassay (LFIA) for the detection of shrimp allergen tropomyosin. The document outlines standardized methodologies for calculating the limit of detection (LOD), limit of quantification (LOQ), coefficient of variation (CV%), and recovery rates, which are crucial for validating analytical methods in complex food matrices. The procedures are framed within the context of allergen detection research, providing researchers with practical guidelines for method validation and performance verification. Special emphasis is placed on the unique considerations for quantum-dot-based fluorescent detection systems and sandwich immunoassay formats, enabling scientists to generate reliable, reproducible data that meets rigorous analytical standards for food safety applications.
Analytical Figures of Merit (AFOM) constitute a series of numeric estimators that characterize the performance of an analytical methodology in terms of prediction ability and detection capability. The most important AFOM include accuracy, precision, sensitivity, analytical sensitivity, prediction uncertainty, limit of detection (LOD), limit of quantification (LOQ), and coefficient of variation (CV%) [56]. In the context of developing a quantum-dot-based sandwich lateral flow immunoassay for shrimp tropomyosin detection, these parameters are particularly crucial as they determine the method's reliability in detecting trace allergen levels in processed food products. The precision and accuracy of these measurements directly impact public health outcomes by ensuring the detection of potentially dangerous allergen concentrations [6].
Experimental Protocols and Methodologies
Quantum-Dot-Based Sandwich LFIA for Tropomyosin Detection
The following protocol outlines the specific methodology employed for the development and validation of the quantum-dot-based sandwich lateral flow immunoassay for shrimp tropomyosin detection, as referenced in the research literature [6].
Materials and Reagents:
- Carboxylated quantum dots (QDs) for fluorescent detection
- Rabbit anti-tropomyosin polyclonal IgG antibodies
- Nitrocellulose membrane for test strip assembly
- EDC/NHS coupling reagents for covalent conjugation
- Tropomyosin standard solutions for calibration
- Processed food samples for validation
- Blocking buffer (typically PBS with BSA)
Procedure:
- Preparation of Fluorescent Probes: Conjugate rabbit anti-TM polyclonal IgG with carboxylated quantum dots using EDC/NHS chemistry. The reaction proceeds at room temperature for 2 hours with gentle mixing, followed by purification via size-exclusion chromatography to remove unreacted components.
- Test Strip Assembly: Dispense the detection antibody-QD conjugate onto the conjugate pad and allow to dry. On the nitrocellulose membrane, create a test line by immobilizing capture anti-TM antibodies and a control line with appropriate secondary antibodies using a programmable dispenser.
- Assay Execution: Apply 100 μL of sample extract to the sample pad. Allow the sample to migrate through the membrane via capillary action for 10 minutes. For quantitative analysis, place the developed strip in a fluorescent reader to measure the signal intensity at the test and control lines.
- Data Analysis: Calculate the T/C ratio (test line signal/control line signal) and correlate with the calibration curve to determine tropomyosin concentration in unknown samples.
Calculation of Limit of Detection (LOD) and Limit of Quantification (LOQ)
Multiple approaches exist for determining LOD and LOQ, each with specific applications and limitations. The International Committee on Harmonization (ICH) recommends three primary methods [57]:
2.2.1. Calibration Curve Method (ICH Q2(R1) Recommended) This method utilizes statistical parameters derived from the calibration curve to calculate LOD and LOQ [57].
- Procedure:
- Prepare a calibration curve with at least 5 concentration levels in the expected low concentration range.
- Perform linear regression analysis to obtain the slope (S) and standard error of the calibration curve (σ).
- Apply the ICH formulas:
- LOD = 3.3 × σ / S
- LOQ = 10 × σ / S
- Example Calculation:
Using exemplary data from chromatographic analysis where σ = 0.4328 and S = 1.9303:
- LOD = 3.3 × 0.4328 / 1.9303 = 0.74 ng/mL
- LOQ = 10 × 0.4328 / 1.9303 = 2.2 ng/mL [57]
Table 1: LOD and LOQ Values for Different Detection Methods in Allergen Detection
| Analytical Method | Target Analyte | LOD | LOQ | Reference |
|---|---|---|---|---|
| Quantum-dot-based sandwich LFIA | Shrimp tropomyosin | 0.01 μg/mL (instrumental) | Not specified | [6] |
| Quantum-dot-based sandwich LFIA | Shrimp tropomyosin | 0.05 μg/mL (visual) | Not specified | [6] |
| Gold nanoparticle-LFIA | Aflatoxin M1 | 50 pg/mL | Not specified | [58] |
| Lateral Flow Immunoassay | Casein and β-lactoglobulin | 0.01 μg per swab | Not specified | [59] |
| Enzyme-linked aptamer-antibody assay | SARS-CoV-2 N protein | 0.1 ng/mL | Not specified | [60] |
2.2.2. Signal-to-Noise Ratio Method This approach is particularly useful for initial estimations and instrumental detection limits:
- LOD: Signal-to-noise ratio of 3:1
- LOQ: Signal-to-noise ratio of 10:1 [57]
2.2.3. Validation of Calculated LOD and LOQ Regardless of the calculation method used, regulatory guidelines require experimental confirmation:
- Prepare replicate samples (n ≥ 6) at the calculated LOD and LOQ concentrations
- For LOD: Verify that the analyte is consistently detected in all replicates
- For LOQ: Demonstrate that the quantification meets precision requirements (typically ±15% CV) and accuracy criteria [57]
Determination of Coefficient of Variation (CV%)
The coefficient of variation (CV) is a normalized measure of dispersion, defined as the ratio of the standard deviation to the mean, expressed as a percentage [61]. CV = (σ / μ) × 100%, where σ is the standard deviation and μ is the mean [61] [62].
2.3.1. Intra-Assay CV Calculation Intra-assay CV measures precision within a single assay run and is calculated from replicate measurements of the same sample within the same assay plate [63].
- Procedure:
- Measure each sample in duplicate or triplicate within the same assay run.
- For each sample, calculate the mean and standard deviation of the replicates.
- Calculate CV for each sample: CV = (Standard Deviation / Mean) × 100
- The intra-assay CV is the average of individual CVs across all samples.
- Acceptable criteria: Intra-assay CV should generally be less than 10% [63]
Table 2: Example Intra-Assay CV Calculation for Duplicate Samples
| Sample | Result 1 (μg/dL) | Result 2 (μg/dL) | Mean | Standard Deviation | CV% |
|---|---|---|---|---|---|
| 1 | 0.132 | 0.128 | 0.130 | 0.003 | 2.2 |
| 2 | 0.351 | 0.361 | 0.356 | 0.007 | 2.0 |
| 3 | 0.282 | 0.306 | 0.294 | 0.017 | 5.8 |
| 4 | 0.237 | 0.218 | 0.228 | 0.013 | 5.9 |
| 5 | 0.178 | 0.215 | 0.197 | 0.026 | 13.3 |
| Average CV% | 5.96 |
2.3.2. Inter-Assay CV Calculation Inter-assay CV measures precision between different assay runs and is calculated from control samples included in multiple independent assays [63].
- Procedure:
- Include the same control samples (high and low concentration) in multiple assay runs.
- For each control, calculate the mean of replicates within each assay.
- Calculate the overall mean and standard deviation of these plate means.
- Calculate CV for each control: CV = (Standard Deviation of Plate Means / Mean of Plate Means) × 100
- The inter-assay CV is the average of the high and low control CVs.
- Acceptable criteria: Inter-assay CV should generally be less than 15% [63]
Table 3: Performance Metrics for Quantum-Dot-Based LFIA for Tropomyosin Detection
| Parameter | Intra-Assay CV% | Inter-Assay CV% | Recovery Rate% | Matrix |
|---|---|---|---|---|
| Tropomyosin Detection [6] | 8.87 - 11.9 | 7.75 - 21.12 | Not specified | Processed foods |
| Aflatoxin M1 Detection [58] | Not specified | Not specified | 78.0 - 111.6 | Milk |
| E. coli O157:H7 Detection [58] | Not specified | Not specified | 70.1 - 89.6 | Milk |
| SARS-CoV-2 N Protein [60] | Not specified | Not specified | 92.0 (average) | Nasopharyngeal samples |
Determination of Recovery Rates
Recovery rate evaluates the accuracy of an analytical method by measuring the percentage of a known, spiked analyte that is detected when added to a sample matrix [58].
Procedure:
- Prepare samples with known, spiked concentrations of the analyte (tropomyosin) in the relevant food matrix.
- Process these fortified samples through the entire analytical procedure.
- Calculate the measured concentration using the calibration curve.
- Calculate percent recovery for each fortified sample: Recovery (%) = (Measured Concentration / Spiked Concentration) × 100
- Calculate mean recovery and CV of recovery across replicates.
- Acceptable criteria: Recovery rates typically range from 70% to 120%, with more specific criteria depending on the analyte and matrix [58].
Research Reagent Solutions
The following table details essential materials and reagents required for establishing the quantum-dot-based sandwich lateral flow immunoassay for tropomyosin detection, along with their specific functions in the analytical protocol.
Table 4: Essential Research Reagents for Quantum-Dot-Based Sandwich LFIA
| Reagent/Material | Function | Specifications |
|---|---|---|
| Carboxylated Quantum Dots | Fluorescent label for detection | Emission wavelength suitable for strip reader; surface functionalized for conjugation |
| Anti-Tropomyosin Antibodies (polyclonal) | Recognition elements for capture and detection | Specific to shrimp tropomyosin; validated for sandwich assay format |
| EDC/NHS Coupling Reagents | Crosslinkers for antibody-QD conjugation | High purity; fresh preparation recommended |
| Nitrocellulose Membrane | Matrix for capillary flow and test lines | Consistent pore size; optimized protein binding capacity |
| Tropomyosin Standard | Calibration and validation | Purified from shrimp; accurately quantified |
| Sample Extraction Buffer | Matrix for protein extraction from food | Compatible with immunoassay; preserves antigen integrity |
| Blocking Buffer (BSA-based) | Reduces non-specific binding | Contains stabilizers for long-term strip storage |
Workflow and Data Analysis Diagrams
Figure 1: Experimental Workflow for QD-Based LFIA Development
Figure 2: Data Analysis Pathway for AFOM Determination
The establishment of robust analytical figures of merit is essential for validating quantum-dot-based sandwich lateral flow immunoassays for allergen detection in food products. The protocols outlined in this document provide researchers with standardized methodologies for determining LOD, LOQ, CV%, and recovery rates, with specific application to shrimp tropomyosin detection. By implementing these procedures, scientists can ensure their analytical methods are "fit for purpose" and generate reliable data for food safety monitoring. The unique advantages of quantum-dot-based detection, including enhanced sensitivity and quantification capabilities, make this technology particularly suitable for detecting trace levels of food allergens in complex processed food matrices. Proper calculation and validation of these AFOM parameters promotes fair criteria for comparing different analytical methodologies and supports the development of standardized approaches across the food safety testing industry.
The detection of food allergens, particularly shrimp tropomyosin (TM), represents a significant challenge in food safety and public health. TM is the major allergen in shrimp, responsible for the majority of shellfish-related allergic reactions, which can sometimes be life-threatening. As a heat-stable protein, TM persists through various food processing conditions, making reliable detection crucial for protecting sensitive individuals. The need for highly sensitive and specific detection methods has driven the development and refinement of various analytical platforms, each with distinct advantages and limitations. This application note provides a comprehensive comparison of the sensitivity and performance characteristics of four key technologies: Quantum-Dot-based Lateral Flow Immunoassay (QD-LFIA), Enzyme-Linked Immunosorbent Assay (ELISA), Immuno-PCR, and Liquid Chromatography-Tandem Mass Spectrometry (LC-MS/MS). By examining the experimental protocols, analytical performance, and practical applications of each method, we aim to provide researchers with the necessary information to select the most appropriate technology for their specific tropomyosin detection needs.
Analytical Performance Comparison
The quantitative performance of different detection platforms for shrimp tropomyosin varies significantly in terms of sensitivity, dynamic range, and sample throughput. The following table summarizes key analytical parameters for the four major technologies examined in this study:
Table 1: Comparative Analytical Performance of Tropomyosin Detection Methods
| Method | Visual LOD | Instrumental LOD | LOQ | Assay Time | Sample Volume | Dynamic Range |
|---|---|---|---|---|---|---|
| QD-LFIA [14] | 0.05 μg/mL | 0.01 μg/mL | - | <10 minutes | ~100 μL | Not specified |
| Sandwich ELISA [10] [64] | - | 27.3 pg/mL | 364 pg/mL | ~5 hours | 100 μL | 1-6 ng/mL |
| Immuno-PCR [10] [65] [64] | - | 11.3 pg/mL | 19.8 pg/mL | ~5.5 hours | 10-25 μL | 0.06-2.5 ng/mL |
| LC-MS/MS [66] [67] | - | - | 1-10 μg/g (in food) | Several hours | Varies | 0.2-100 ng/mL |
The data reveal a clear progression in sensitivity from QD-LFIA to ELISA, and finally to Immuno-PCR, with LC-MS/MS occupying a distinct position due to its different quantification approach. QD-LFIA provides the fastest analysis time by a significant margin, making it ideal for rapid screening applications, though with lower absolute sensitivity compared to the plate-based immunoassays. Immuno-PCR demonstrates the highest sensitivity, with a 20-fold improvement in quantification limit compared to traditional ELISA [10] [64]. This exceptional sensitivity makes it particularly valuable for detecting trace-level contaminants in complex food matrices.
Technology-Specific Experimental Protocols
Quantum-Dot-Based Lateral Flow Immunoassay (QD-LFIA)
Principle and Workflow
The QD-LFIA method employs a sandwich immunoassay format on a lateral flow platform, utilizing quantum dots as fluorescent reporters to detect tropomyosin. Water-soluble quantum dots with carboxylated surfaces are conjugated to anti-TM antibodies through EDC/NHS chemistry, creating highly fluorescent immunoprobes. When a sample containing TM is applied to the strip, capillary action drives it through various zones, forming antibody-antigen complexes that are captured at the test line, generating a fluorescent signal proportional to TM concentration [14].
Detailed Protocol
Materials and Reagents:
- CdSe/ZnS core-shell quantum dots with carboxyl groups
- Rabbit anti-TM polyclonal IgG
- EDC (1-Ethyl-3-(3-dimethylaminopropyl) carbodiimide hydrochloride) and sulfo-NHS
- Nitrocellulose membrane, sample pad, conjugate pad, absorbent pad
- Phosphate buffer with surfactants
Procedure:
- QD-Antibody Conjugate Preparation:
- Activate carboxyl groups on QDs using EDC/sulfo-NHS chemistry in MES buffer
- Conjugate with rabbit anti-TM polyclonal antibodies via amide bond formation
- Block remaining active sites with BSA or casein
- Purify conjugates by centrifugation and resuspend in storage buffer
Strip Assembly:
- Dispense capture antibody (anti-TM monoclonal) and control antibody on nitrocellulose membrane
- Dry conjugate pad and apply QD-antibody conjugates
- Assemble sample pad, conjugate pad, nitrocellulose membrane, and absorbent pad on backing card
- Cut into individual strips and store desiccated
Sample Analysis:
- Apply 100 μL of sample or standard to sample pad
- Allow migration for 10 minutes
- Visualize results under UV light or quantify with a fluorescent reader
Performance Characteristics: The QD-LFIA method demonstrates excellent performance with a visual detection limit of 0.05 μg/mL and an instrumental detection limit of 0.01 μg/mL. The method shows no cross-reactivity with non-target species except shrimp, and exhibits good reproducibility with intra- and inter-assay coefficients of variation of 8.87-11.9% and 7.75-21.12%, respectively. The method successfully detected TM in processed food samples, including roast fish fillet, boiled meatball, and steamed meatball, with a detection capability of 0.045 μg/g [14].
Sandwich ELISA
Principle and Workflow
Sandwich ELISA employs two antibodies recognizing different epitopes on the tropomyosin molecule. A capture antibody is immobilized on a microplate surface, which binds the target protein from the sample. A detection antibody conjugated to an enzyme (typically horseradish peroxidase) then binds to the captured protein, forming a "sandwich." Enzyme activity is measured through colorimetric conversion of a substrate, with signal intensity proportional to target concentration [65].
Detailed Protocol
Materials and Reagents:
- Monoclonal mouse anti-TM antibody (capture)
- Polyclonal rabbit anti-shrimp TM antibody (detection)
- HRP-conjugated goat anti-rabbit antibody
- TMB substrate, stop solution
- Coating buffer, washing buffer, blocking buffer
Procedure:
- Plate Preparation:
- Coat microplate with capture antibody (1-2 μg/mL in carbonate buffer)
- Incubate overnight at 4°C or 2 hours at 37°C
- Wash three times with PBS-Tween
- Block with 1-5% BSA or casein in PBS for 1-2 hours
Sample Incubation:
- Add standards or samples to wells (100 μL volume)
- Incubate 1-2 hours at 37°C
- Wash three times with PBS-Tween
Detection:
- Add detection antibody (1-2 μg/mL) and incubate 1 hour at 37°C
- Wash three times
- Add enzyme-conjugated secondary antibody and incubate 1 hour
- Wash three times
- Add TMB substrate and incubate 15-30 minutes
- Stop reaction with sulfuric acid
- Measure absorbance at 450 nm
Performance Characteristics: The developed sandwich ELISA for crustacean tropomyosin demonstrated a limit of detection (LOD) of 27.3 pg/mL and limit of quantification (LOQ) of 364 pg/mL, with a linear range of approximately 1-6 ng/mL [10] [64]. The method shows high specificity for crustacean tropomyosin with minimal cross-reactivity to molluscan species.
Immuno-PCR
Principle and Workflow
Immuno-PCR combines the specificity of antibody-antigen recognition with the exponential amplification power of PCR. The method follows the same principle as sandwich ELISA but replaces the enzyme-conjugated detection antibody with a DNA-labeled antibody. The attached DNA marker is subsequently amplified by real-time PCR, providing exponential signal amplification and dramatically enhanced sensitivity compared to conventional ELISA [10] [65] [64].
Detailed Protocol
Materials and Reagents:
- Monoclonal mouse anti-TM antibody (capture)
- Polyclonal rabbit anti-shrimp TM antibody (detection)
- Goat anti-rabbit antibody-DNA conjugate
- PCR reagents, primers specific for DNA marker
- Real-time PCR instrument
Procedure:
- Immuno-reaction:
- Coat PCR-compatible plate with capture antibody
- Block with appropriate blocking buffer
- Add standards or samples and incubate 1-2 hours
- Wash to remove unbound material
- Add detection antibody and incubate 1 hour
- Wash thoroughly
- DNA Tag Amplification:
- Add antibody-DNA conjugate and incubate 1 hour
- Wash extensively to remove unbound conjugate
- Add PCR master mix with specific primers
- Perform real-time PCR amplification (40 cycles)
- Analyze Ct values against standard curve
Performance Characteristics: The immuno-PCR method demonstrated exceptional sensitivity with an LOD of 11.3 pg/mL and LOQ of 19.8 pg/mL, representing a 2.4-fold improvement in detection sensitivity and 19.8-fold improvement in quantification sensitivity compared to traditional ELISA. The linear range was approximately 0.06-2.5 ng/mL [10] [64]. The method maintained high precision across a broad concentration range and showed specific detection of crustacean tropomyosin.
LC-MS/MS
Principle and Workflow
LC-MS/MS for allergen detection typically involves proteolytic digestion of the target protein followed by quantification of specific signature peptides. The method uses stable isotope-labeled internal standards to correct for variations in sample preparation and ionization efficiency. After protein extraction and digestion, peptides are separated by liquid chromatography and detected by tandem mass spectrometry, providing highly specific quantification based on both retention time and mass transitions [66] [67].
Detailed Protocol
Materials and Reagents:
- Signature peptides (ANIQLVEK, IVELEEELR)
- Isotope-labeled internal standards
- Trypsin for protein digestion
- Reduction and alkylation reagents (DTT, IAA)
- LC-MS grade solvents
Procedure:
- Sample Preparation:
- Extract protein from food matrix using appropriate buffer
- Reduce disulfide bonds with DTT
- Alkylate with iodoacetamide
- Digest with trypsin overnight at 37°C
- Add isotope-labeled internal standards
- LC-MS/MS Analysis:
- Separate peptides using UPLC with C18 column
- Elute with acetonitrile gradient in 0.1% formic acid
- Analyze using tandem mass spectrometry in MRM mode
- Monitor specific precursor-product ion transitions
- Quantify based on standard curve with internal standard correction
Performance Characteristics: The LC-MS/MS method achieved LOQs of 1 μg/g in pop food and sauce, and 10 μg/g in surimi product. Mean recoveries ranged from 77.22% to 115.6% with RSDs ≤ 9.97%. The method showed good linearity in the range of 5-5,000 μg/L [66] [67]. The use of full-length isotope-labeled internal standards provided accurate correction for sample preparation variations.
Method Selection Guide
Each detection platform offers distinct advantages that make it suitable for specific applications and settings:
Table 2: Application-Based Method Selection Guide
| Method | Best Suited Applications | Key Advantages | Main Limitations |
|---|---|---|---|
| QD-LFIA | Rapid screening, point-of-care testing, quality control in production facilities | Speed (<10 min), simplicity, no specialized equipment needed, suitable for processed foods | Lower sensitivity, semi-quantitative without reader |
| ELISA | Routine laboratory testing, batch analysis, compliance testing | Well-established, quantitative, high throughput, cost-effective for multiple samples | Moderate sensitivity, antibody-dependent, longer processing time |
| Immuno-PCR | Trace-level detection, research applications, highly sensitive quantification | Exceptional sensitivity (pg/mL range), small sample volume, quantitative | Technical complexity, requires PCR equipment, longer processing time |
| LC-MS/MS | Confirmatory testing, complex matrices, novel allergen detection | High specificity, multiplexing capability, not antibody-dependent | Expensive instrumentation, technical expertise required, longer sample preparation |
For rapid screening and field applications, QD-LFIA provides unmatched speed and convenience. In controlled laboratory settings requiring high throughput and quantitative results, traditional ELISA remains a robust choice. When ultimate sensitivity is required for detecting trace contamination, immuno-PCR offers significant advantages. LC-MS/MS serves as an essential confirmatory technique, particularly for novel allergens or complex matrices where immunoassays may suffer from interference.
Research Reagent Solutions
Successful implementation of these detection methods requires carefully selected reagents and materials. The following table outlines key research reagent solutions for tropomyosin detection:
Table 3: Essential Research Reagents for Tropomyosin Detection
| Reagent Category | Specific Examples | Function & Importance | Technical Considerations |
|---|---|---|---|
| Detection Antibodies | Rabbit anti-TM polyclonal IgG, monoclonal anti-TM antibodies | Specific recognition of target epitopes; determine assay specificity and sensitivity | Affinity, specificity, clonality (monoclonal for consistency, polyclonal for signal amplification) [36] |
| Signal Reporter Systems | Carboxylated QDs, HRP conjugates, DNA markers | Generate detectable signal; determine sensitivity and detection mode | QDs: high fluorescence, photostability; HRP: cost-effective; DNA: enables PCR amplification [14] [65] |
| Separation Media | Nitrocellulose membranes, UPLC columns | Support molecular interactions and separation | Membrane pore size affects flow and binding; column chemistry affects peptide separation [14] [66] |
| Sample Preparation Reagents | Trypsin, DTT, IAA, immunoaffinity columns | Extract, purify, and prepare target analyte | Critical for complex food matrices; enzymatic digestion efficiency affects MS results [66] [67] |
| Reference Materials | Recombinant TM, signature peptides, isotope-labeled standards | Calibration and quality control; essential for accurate quantification | Purity and characterization critical for method validation [10] [67] |
The choice of detection platform for shrimp tropomyosin must align with the specific application requirements, considering factors such as needed sensitivity, throughput, available infrastructure, and operational constraints. QD-LFIA offers an optimal solution for rapid screening with minimal equipment, while immuno-PCR provides the highest sensitivity for trace-level detection. ELISA remains a versatile workhorse for routine laboratory testing, and LC-MS/MS serves as a powerful confirmatory technique with high specificity. Understanding the comparative performance characteristics, experimental requirements, and application strengths of each platform enables researchers to implement the most appropriate strategy for their specific tropomyosin detection needs, ultimately contributing to improved food safety and consumer protection.
Diagram 1: Method Characteristics and Application Mapping. This diagram visualizes the relationships between detection methods, their key characteristics, and primary applications.
Diagram 2: Comparative Workflow Diagrams. This diagram illustrates the step-by-step processes for each detection method, highlighting differences in complexity and time requirements.
Tropomyosin (TM) is a major and predominant allergen in shellfish, with a highly conserved amino acid sequence among different invertebrate organisms [10]. This conserved nature makes it a major allergen responsible for cross-reactivity between crustaceans and mollusks, posing a significant challenge for specific detection [10]. The development of highly specific immunoassays is therefore of critical importance for accurate food allergen labeling and effective protection of consumers with shellfish allergies [10]. Within this context, quantum-dot-based sandwich lateral flow immunoassay (LFIA) has emerged as a promising technology that combines rapid detection with the potential for high sensitivity and specificity [14]. This application note systematically evaluates the specificity and cross-reactivity of a quantum-dot-based sandwich LFIA for shrimp tropomyosin detection against various molluscan species, providing detailed protocols and performance data to support researchers in food allergen detection and assay development.
Background
Tropomyosin as a Pan-Allergen in Shellfish
Tropomyosin is a heat-stable, high-pressure-stable protein with a molecular weight of 34-38 kDa that remains intact during food processing conditions [10]. It accounts for most diagnosed ingestion-related shellfish allergies, with 72-98% of shrimp-allergic patients' sera showing positive TM-specific IgE binding [10]. The protein exhibits approximately 55-65% sequence similarity between crustacean and molluscan species, creating a significant challenge for specific detection [10]. This level of homology is sufficient to cause clinical cross-reactivity in allergic individuals while still presenting enough structural divergence to be exploited for specific antibody development [68].
Quantum-Dot-Based Sandwich Lateral Flow Immunoassay
The quantum-dot-based sandwich LFIA represents an advanced diagnostic platform that leverages the superior optical properties of quantum dots (QDs) for enhanced sensitivity [14]. QDs are tiny semiconducting nanocrystals with diameters ranging from 2 to 10 nanometers that exhibit unique electronic characteristics, including high quantum yield, strong photostability, narrow emission spectrum, and wide excitation range [38] [69]. In the sandwich LFIA format, the target analyte (tropomyosin) is captured between two antibodies: one conjugated to QDs and another immobilized on the test line [38]. This format is particularly suitable for larger targets like tropomyosin that contain at least two epitopes, offering better specificity and reduced susceptibility to matrix effects compared to competitive formats [14].
Performance Data and Comparative Analysis
Analytical Performance of Tropomyosin Detection Methods
Table 1: Comparison of analytical performance for different tropomyosin detection methods
| Method | Detection Principle | LOD | LOQ | Linear Range | Assay Time |
|---|---|---|---|---|---|
| Immuno-PCR [10] | DNA-amplified immunoassay | 11.3 pg/mL | 19.8 pg/mL | 0.06-2.5 ng/mL | ~4 hours |
| QD-LFIA (Sandwich) [14] | Quantum dot fluorescence | 0.01 μg/mL (IDL) | N/R | N/R | <10 minutes |
| Electrochemical Immunosensor [70] | Electrochemical detection | 0.47 ng/mL | N/R | 2.5-20 ng/mL and 30-200 ng/mL | N/R |
| Infrared Spectroscopy (IR-CAM) [68] | Spectral analysis with chemometrics | N/R | N/R | N/R | <10 minutes |
Cross-Reactivity Profile with Molluscan Species
Table 2: Cross-reactivity assessment of immunoassays with various shellfish species
| Assay Format | Crustacean Reactivity | Molluscan Cross-Reactivity | Specificity Notes |
|---|---|---|---|
| Immuno-PCR [10] | High for red shrimp and black tiger shrimp | Low with Mediterranean mussel, Japanese carpet shell, Yesso scallop, common octopus | Highly specific for crustacean TM; 55-65% sequence similarity insufficient for detection |
| QD-LFIA (Sandwich) [14] | Specific for shrimp tropomyosin | No cross-reactivity with other species except shrimp | High specificity demonstrated with limited cross-species testing |
| Electrochemical Immunosensor [70] | Specific for crustacean TM | Selective against fish allergen (Cyp c 1) | Effective detection of TPM in foodstuff, enabling labeling control |
| Infrared Spectroscopy (IR-CAM) [68] | Identifies unique fingerprint peaks for crabs, shrimps | Enables species differentiation at Class/Family level | Antibody-free method based on spectral signatures |
Experimental Protocols
Protocol 1: QD-LFIA Strip Development and Assembly
Principle: This protocol details the preparation of quantum dot-antibody conjugates and assembly of the lateral flow strip for tropomyosin detection [14].
Materials:
- Carboxylated CdSe/ZnS quantum dots (QDs)
- Rabbit anti-TM polyclonal IgG
- EDC (1-Ethyl-3-(3-dimethylaminopropyl) carbodiimide) and sulfo-NHS
- Nitrocellulose membrane, sample pad, conjugate pad, absorbent pad
- PBS buffer (pH 7.4) and blocking buffer
Procedure:
- QD-Antibody Conjugate Preparation:
- Activate carboxylated QDs using EDC/sulfo-NHS chemistry in PBS buffer, pH 7.4
- Mix activated QDs with rabbit anti-TM polyclonal IgG at optimal ratio (typically 10:1 to 20:1)
- Incubate at room temperature for 2 hours with gentle shaking
- Block excess active sites with 1% BSA for 30 minutes
- Purify conjugates by centrifugation and resuspend in storage buffer
- Strip Assembly:
- Dispense QD-antibody conjugates onto conjugate pad and dry at 37°C for 2 hours
- Dispense capture antibody (monoclonal anti-TM) on test line and species-specific anti-immunoglobulin on control line of nitrocellulose membrane
- Dry membrane at 37°C for 1 hour
- Assemble components: sample pad, conjugate pad, nitrocellulose membrane, absorbent pad
- Cut into individual 4-mm wide strips and store with desiccant
Troubleshooting Tips:
- Optimize antibody:QD ratio to maximize sensitivity while minimizing non-specific binding
- Test various blocking agents (BSA, casein, sucrose) to reduce background noise
- Adjust dispense volume and concentration of capture antibody for optimal line intensity
Protocol 2: Cross-Reactivity Assessment
Principle: This protocol evaluates assay specificity by testing against various crustacean and molluscan tropomyosins to determine cross-reactivity [10] [68].
Materials:
- Purified tropomyosin from: shrimp, crab, lobster (crustaceans)
- Purified tropomyosin from: mussel, scallop, clam, oyster (mollusks)
- Non-target proteins (BSA, parvalbumin, lipase)
- QD-LFIA strips (from Protocol 1)
- Sample extraction buffer
Procedure:
- Protein Extraction and Quantification:
- Extract tropomyosin from tissue samples using high-salt buffer (1M KCl, 20mM phosphate, pH 7.0)
- Precipitate proteins with 40% ammonium sulfate
- Dialyze against appropriate buffer and quantify using BCA assay
- Verify purity by SDS-PAGE and Western blot
- Cross-Reactivity Testing:
- Prepare serial dilutions of each tropomyosin extract in PBS (0, 0.01, 0.1, 1.0 μg/mL)
- Apply 100 μL of each sample to QD-LFIA strips
- Allow development for 10 minutes at room temperature
- Measure test line fluorescence intensity using a portable fluorescent reader
- Calculate cross-reactivity percentage as: (Signal for molluscan TM / Signal for crustacean TM at same concentration) × 100%
Data Analysis:
- Cross-reactivity <5%: Highly specific
- Cross-reactivity 5-15%: Moderately specific
- Cross-reactivity >15%: Significant cross-reactivity
Protocol 3: Sensitivity and Limit of Detection Determination
Principle: This protocol establishes the detection limits and sensitivity of the QD-LFIA for shrimp tropomyosin [14].
Materials:
- Purified recombinant shrimp tropomyosin standard
- QD-LFIA strips
- Fluorescent strip reader
Procedure:
- Prepare two-fold serial dilutions of purified TM standard (1 μg/mL to 0.001 μg/mL)
- Apply 100 μL of each concentration to QD-LFIA strips (n=6 for each concentration)
- Allow reaction for 10 minutes at room temperature
- Measure fluorescence intensity at test line using a portable fluorescent reader
- Plot fluorescence intensity versus TM concentration
- Calculate limit of detection (LOD) as mean background signal + 3 standard deviations
- Calculate limit of quantification (LOQ) as mean background signal + 10 standard deviations
Visualization of Assay Principle and Workflow
Research Reagent Solutions
Table 3: Essential research reagents for QD-LFIA development for tropomyosin detection
| Reagent/Category | Specific Examples | Function in Assay Development |
|---|---|---|
| Quantum Dots | Carboxylated CdSe/ZnS core-shell QDs [14] | Fluorescent label providing signal amplification; size (9-12 nm) affects loading and quantum yield [69] |
| Antibody Pairs | Monoclonal anti-TPM (capture) + Polyclonal rabbit anti-shrimp TM (detection) [10] | Sandwich complex formation; critical for specificity and sensitivity |
| Conjugation Chemistry | EDC/sulfo-NHS crosslinking [14] | Covalent attachment of antibodies to QDs while maintaining immunoreactivity |
| Membrane Components | Nitrocellulose membrane, glass fiber sample/conjugate pads, cellulose absorbent pad [38] | Platform for capillary flow and immmunoreaction |
| Tropomyosin Standards | Recombinant shrimp TM, natural shrimp TM purified from muscle [14] | Assay standardization, calibration curve generation, validation |
| Blocking Agents | BSA, casein, sucrose, trehalose [14] | Reduce non-specific binding, stabilize conjugated antibodies |
Discussion and Application
The data presented in this application note demonstrates that properly configured quantum-dot-based sandwich LFIA can achieve high specificity for crustacean tropomyosin with minimal cross-reactivity to molluscan tropomyosin [14]. The structural differences in the tropomyosin protein between these groups, despite 55-65% sequence similarity, provide sufficient epitope variation for specific antibody recognition [10]. This specificity is crucial for accurate food labeling and protection of consumers with specific shellfish allergies.
The quantum dot technology offers significant advantages in sensitivity over conventional gold nanoparticle-based LFIAs, with reported instrumental detection limits as low as 0.01 μg/mL for shrimp tropomyosin [14]. The fluorescence-based detection also enables quantitative measurements, addressing a limitation of traditional lateral flow assays [38]. Furthermore, the photostability of QDs provides longer shelf life and more consistent results compared to other fluorescent labels [69].
For researchers developing allergen detection assays, the protocols provided here offer a framework for systematic evaluation of assay specificity and sensitivity. The cross-reactivity assessment protocol is particularly valuable given the clinical significance of species-specific shellfish allergies. Future developments in this field may focus on multiplexed detection platforms that can simultaneously identify multiple allergen classes from a single sample [42].
In conclusion, the quantum-dot-based sandwich LFIA represents a promising platform for rapid, sensitive, and specific detection of shrimp tropomyosin with minimal cross-reactivity to molluscan species. The methodologies and data presented in this application note provide researchers with the necessary tools to develop and validate robust allergen detection assays for both food safety applications and clinical diagnostics.
Robustness testing is a critical validation step in analytical science, confirming that a method's performance remains unaffected by small, deliberate variations in method parameters. Within the specific context of developing a quantum-dot-based sandwich lateral flow immunoassay (LFA) for the detection of shrimp tropomyosin, robustness testing evaluates the assay's reliability against the complex background of food matrices. The high-throughput analysis of target analytes in food samples is challenging due to matrix complexity, where instrument robustness is crucial to maintaining optimal assay performance with minimal downtime [71]. For an LFA, robustness encompasses consistent flow, minimal non-specific binding, and stable signal intensity from the quantum dot (QD) reporters, ensuring the results are dependable across different production batches and sample types. This document outlines application notes and detailed protocols for evaluating robustness using both spiked and incurred food matrices, providing a framework for researchers and scientists in drug and diagnostic development.
Theoretical Background: Matrix Effects in Food Analysis
Understanding Matrix Complexity
In analytical chemistry, the "matrix" is defined as all components of a sample other than the analyte of interest [72]. Food matrices, such as shrimp or complex processed foods, can contain a vast array of interfering substances including proteins, fats, carbohydrates, salts, and polyphenols. These co-extractables can alter the analytical signal, leading to matrix effects (ME). In mass spectrometry, matrix effects are well-defined and can manifest as signal suppression or enhancement [72]. Similarly, in lateral flow immunoassays, matrix components can interfere with antibody binding, alter capillary flow dynamics, or quench the signal from the label, all of which can compromise the assay's accuracy and reliability.
The Importance of Spiked and Incurred Samples
A rigorous robustness assessment requires testing with both spiked and incurred samples.
- Spiked Samples (Post-extraction addition): Prepared by adding a known quantity of the pure analyte (e.g., purified tropomyosin) to a blank matrix extract after the extraction process. These are used to isolate and measure the impact of the matrix on the detection mechanism itself, as the extraction efficiency is not a factor [72].
- Incurred Samples: Produced by introducing the allergenic food (e.g., shrimp) into a model food matrix during its production, mimicking a real-world contaminated product. The analyte is incorporated into the matrix in a more natural state, requiring a full extraction process. These samples are essential for validating the entire method, from extraction to detection, and are the gold standard for assessing true method performance [73].
Experimental Protocols
Protocol 1: Determining Matrix Effects via Post-Extraction Spiking
This protocol quantifies the direct effect of the sample matrix on the assay's detection system [72].
1. Sample Preparation:
- Select a representative blank food matrix (e.g., a chocolate-based matrix or ground shrimp-free substrate).
- Homogenize the matrix using a laboratory blender. If necessary, grind the sample into a powder using a mortar and pestle [71] [73].
- Extract the matrix using an optimized sample preparation protocol. For proteinaceous allergens, this typically involves a buffer extraction, purification, and possibly a tryptic digestion step if targeting peptide markers [73].
2. Sample Set Preparation (n≥5 per level):
- Solvent Standard (A): Prepare a dilution of native tropomyosin or its signature peptide in an appropriate solvent (e.g., 5% acetonitrile/water) at a defined concentration.
- Matrix-Matched Standard (B): Spike the same concentration of analyte into the blank matrix extract obtained in step 1.
3. Analysis and Calculation:
- Analyze all samples using the QD-LFA protocol.
- Record the peak response (e.g., band intensity from a reader) for each sample.
- Calculate the Matrix Effect (ME) for each replicate using the formula: ME (%) = [(Mean Peak Area B - Mean Peak Area A) / Mean Peak Area A] × 100 [72]
- Interpretation: An ME value less than zero indicates signal suppression, while a value greater than zero indicates signal enhancement. Best practice guidelines typically recommend action (e.g., further sample cleanup, antibody selection) if effects exceed ±20% [72].
This protocol evaluates the entire method, including extraction efficiency, using well-characterized incurred materials [73].
1. Production of Incurred Material:
- Produce a model food matrix (e.g., chocolate bar, shrimp paste) in a food pilot plant, incurred with known, precise amounts of shrimp powder at multiple concentration levels (e.g., 0, 2, 4, 10, and 40 µg of total allergenic food protein per gram of food matrix) [73].
- Homogenize the material thoroughly and verify homogeneity and stability using a reference method.
2. Sample Analysis:
- Following the optimized sample preparation protocol (e.g., extraction with Tris-HCl buffer, purification with disposable desalting cartridges or reversed-phase SPE, and tryptic digestion) [73], analyze the incurred samples.
- For each concentration level, analyze a sufficient number of replicates (n=5 recommended) to assess precision.
3. Data Analysis:
- Recovery: Calculate the analyte recovery by comparing the measured concentration to the known, incurred concentration.
- Precision: Calculate the repeatability (intra-day) and intermediate precision (inter-day, inter-operator) as relative standard deviations (%RSD).
- Measurement Uncertainty: Estimate the overall standard uncertainty by combining the contributions from different sources of variability, such as recovery and precision data [73].
Protocol 3: Accelerated Robustness Testing for QD-LFA
This protocol adapts accelerated robustness concepts from LC-MS to stress-test the QD-LFA under challenging conditions [71].
1. Aggressive Sample Preparation:
- Intentionally omit one or more clean-up steps (e.g., the solid-phase extraction (SPE) step) in the sample preparation protocol to create a "dirtier" extract with a higher load of matrix interferences [71].
2. High-Throughput Sequencing:
- Run a large sequence of matrix extract injections (e.g., 72 injections) bracketed by solvent quality control (QC) replicates (e.g., 6 replicates) to monitor signal drift over time [71].
3. Performance Monitoring:
- Monitor the raw signal intensity (e.g., QD fluorescence) of the solvent QCs over the entire sequence.
- Robustness is compared based on the total number of injections or tests performed before the instrument or assay sensitivity declines to a pre-defined threshold (e.g., 50% of the initial maximum response) [71].
Data Presentation and Analysis
The following table summarizes the core quantitative data and performance characteristics that should be established during robustness testing.
Table 1: Key Performance Characteristics for Robustness Assessment
| Performance Characteristic | Calculation Method | Acceptance Criteria (Example) |
|---|---|---|
| Matrix Effect (ME) | ( ME (\%) = \frac{\text{Mean Response}{Matrix} - \text{Mean Response}{Solvent}}{\text{Mean Response}_{Solvent}} \times 100 ) | ±20% [72] |
| Analyte Recovery | ( Recovery (\%) = \frac{\text{Measured Concentration}{Incurred}}{\text{Known Concentration}{Incurred}} \times 100 ) | 80-120% |
| Repeatability (RSD_r) | ( RSDr (\%) = \frac{\text{Standard Deviation}{Within-run}}{\text{Mean}} \times 100 ) | <15% |
| Intermediate Precision (RSD_ip) | ( RSD{ip} (\%) = \frac{\text{Standard Deviation}{Between-run}}{\text{Mean}} \times 100 ) | <20% |
| Limit of Detection (LOD) | Determined from low-end calibration curve (e.g., LOD = 3.3 × σ/S, where σ is standard error of regression) [73] | Method-dependent |
| Limit of Quantification (LOQ) | The lowest concentration meeting defined precision and accuracy criteria (e.g., LOQ = 10 × σ/S) [73] | Method-dependent |
The Scientist's Toolkit: Research Reagent Solutions
The table below details essential materials and their functions specific to developing a robust QD-LFA for tropomyosin.
Table 2: Essential Research Reagents for QD-LFA Development
| Reagent / Material | Function / Description | Example / Note |
|---|---|---|
| Quantum Dots (QDs) | Fluorescent nanoparticle label; provides high-intensity, stable signal for detection. | Cadmium-based (e.g., CdSe/ZnS) or more bio-friendly metal-doped (e.g., ZnCuInS) QDs. |
| Anti-Tropomyosin Antibodies | Critical binders; a pair of monoclonal or polyclonal antibodies for capture (test line) and detection (conjugated to QDs). | Must be specific to shrimp tropomyosin epitopes and validated for sandwich pair compatibility. |
| Nitrocellulose Membrane | The platform for capillary flow and the site of antibody immobilization at test and control lines. | Pore size (e.g., 8-15 µm) affects flow rate and sensitivity. Millipore HF180 is an example [74]. |
| Conjugate Pad | Glass fibre pad that stores dried QD-antibody conjugates, releasing them upon sample application. | Requires optimization of blocking and drying conditions to maintain conjugate stability [75]. |
| AQUA Synthetic Peptides | Absolute quantification standards; synthetic, isotopically labeled versions of target tropomyosin peptides. | Used as internal standards in LC-MS/MS to determine conversion factors and validate LFA results [73]. |
| Solid-Phase Extraction (SPE) | Purification; removes interfering matrix components from the food extract prior to LFA analysis. | Strata-X polymeric reversed phase or C18 cartridges are commonly used [73]. |
Workflow and Relationship Visualizations
Robustness Testing Strategy
The following diagram outlines the logical workflow for a comprehensive robustness testing plan, integrating spiked and incurred sample analyses.
QD-LFA Assembly and Signal Detection
This diagram illustrates the key components of a quantum-dot-based lateral flow immunoassay and the mechanism of signal generation for tropomyosin detection.
Quantum-dot-based sandwich lateral flow immunoassay (QD-LFIA) represents a significant advancement in the rapid, on-site detection of the major shrimp allergen tropomyosin (TM). This Application Note provides a detailed framework for validating the assay's performance with commercial food samples and implementing strategic cross-contamination controls in production environments. The protocol is designed to assist researchers and quality control professionals in deploying this high-sensitivity tool to enhance food safety and regulatory compliance. The core technology leverages the exceptional fluorescent properties of quantum dots (e.g., high quantum yield, stability) to achieve sensitivity superior to conventional gold nanoparticle-based LFIAs [38] [76].
The following table summarizes the key performance metrics of the QD-LFIA for tropomyosin detection, as established in controlled studies and applicable to real-world sample analysis.
Table 1: Performance Metrics of the QD-LFIA for Tropomyosin Detection
| Parameter | Result | Experimental Context |
|---|---|---|
| Visual Detection Limit (VDL) | 0.05 μg/mL | Limit of detection by naked eye [14] |
| Instrumental Detection Limit (IDL) | 0.01 μg/mL | Quantified with a fluorescence reader [14] |
| Total Assay Time | < 10 minutes | From sample application to result [14] |
| Specificity | No cross-reactivity with other common species except shrimp | Demonstrates high specificity for the target allergen [14] |
| Reproducibility (Intra-assay CV) | 8.87% - 11.9% | Low variation within the same test run [14] |
| Reproducibility (Inter-assay CV) | 7.75% - 21.12% | Variation across different test runs [14] |
| Detection in Processed Foods | 0.045 μg/g in incurred model foods (e.g., roast fish fillet, meatballs) | Validates efficacy in complex, processed matrices [14] |
Detailed Experimental Protocols
Protocol A: QD-LFIA for Tropomyosin in Commercial Food Samples
This protocol outlines the procedure for detecting tropomyosin in finished food products using the QD-LFIA strip.
3.1.1 Workflow Overview
The following diagram illustrates the complete experimental workflow for sample analysis.
3.1.2 Materials and Reagents
- QD-LFIA Strips: Pre-coated with anti-TM capture antibody at the test line and species-specific anti-immunoglobulin at the control line [38] [14].
- Portable Fluorescence Immunoassay Chip Detector (PFICD): For quantitative results. Visual assessment is also possible [14] [76].
- Extraction Buffer: 20 mmol/L Tris-HCl, pH ~7.4 [14] [77].
- Test Samples: Homogenized commercial food products.
3.1.3 Step-by-Step Procedure
- Sample Preparation: Homogenize 1 g of food sample with 10 mL of extraction buffer. Incubate for 4 hours at room temperature with constant agitation. Centrifuge at 8,000 × g for 15 minutes at 4°C. Collect the supernatant for testing [14] [77].
- Sample Application: Pipette 100 μL of the extracted supernatant onto the sample pad of the QD-LFIA strip [14].
- Assay Development: Allow the strip to develop at room temperature for 10 minutes. During this time, the sample migrates via capillary action. If tropomyosin is present, it forms a sandwich complex with the QD-conjugated antibody and the capture antibody at the test line [14].
- Result Interpretation:
- Visual: A fluorescent line at the test (T) position indicates a positive result. The appearance of a line only at the control (C) indicates a negative result. The lack of a control line signifies an invalid test [38].
- Quantitative: Insert the strip into the PFICD to measure the fluorescence intensity. Calculate the tropomyosin concentration against a pre-established standard curve [76].
Protocol B: Cross-Contamination Management on Production Lines
This protocol describes a multi-pronged strategy to monitor and prevent allergen cross-contamination, complementing the QD-LFIA testing.
3.2.1 Strategic Framework for Contamination Control
The diagram below outlines the key pillars of an effective cross-contamination management system.
3.2.2 Implementation Guide
- Facility and Equipment Design:
- Zone Segregation: Establish physically separate zones for processing allergen-containing (e.g., shrimp) and allergen-free products [78].
- Color-Coding: Implement a color-coding system for tools, equipment, and PPE (e.g., gloves, aprons) used in different zones to prevent accidental transfer [78].
- Equipment Design: Utilize equipment designed for easy cleaning and disassembly to eliminate allergen harborage sites [78].
Cleaning and Sanitation:
- Validated Cleaning Protocols: Establish and validate cleaning procedures for equipment after processing allergen-containing products. This includes dedicated downtime for cleaning ("cleaning windows") [78].
- Prevention of Overspray: During cleaning, minimize overspray and backsplashes to avoid contaminating clean areas or equipment [78].
Process Monitoring and Control:
- Environmental Monitoring: Use the QD-LFIA (Protocol A) to conduct regular swab tests on food-contact surfaces (conveyors, slicers, workstations) after cleaning and before production to verify cleaning efficacy.
- Digital Solutions: Integrate digital monitoring systems for continuous oversight of parameters like temperature and hygiene compliance, enabling faster response to deviations [79].
Staff Training and Compliance:
- Regular Training: Train all personnel on allergen risks, cross-contamination pathways, and the importance of adhering to established protocols, including proper handwashing and use of PPE [78] [79].
- Behavioral Monitoring: Foster a culture of compliance where non-compliant behaviors are identified and corrected promptly [79].
The Scientist's Toolkit: Essential Research Reagents and Materials
The following table catalogs key reagents and materials critical for developing and deploying the QD-LFIA for tropomyosin.
Table 2: Key Research Reagent Solutions for QD-LFIA Development
| Item | Function/Description | Critical Parameters & Notes |
|---|---|---|
| CdSe/ZnS QDs (carboxylated) | Fluorescent reporter; core of the detection system [14]. | High quantum yield, narrow emission spectrum, and water solubility are essential for bright, stable signals [38] [76]. |
| Anti-Tropomyosin Antibodies | Specificity providers; both capture and detection antibodies are required [14]. | High affinity and specificity for shrimp TM; must recognize different epitopes for sandwich format [38] [14]. |
| EDC & NHS | Cross-linking agents; activate QD carboxyl groups for covalent antibody conjugation [14] [76]. | Critical for stable probe preparation; reaction must be performed in dark to prevent QD quenching [14]. |
| Nitrocellulose Membrane | Matrix for capillary flow and immobilization of capture antibodies [38] [14]. | Pore size and flow rate must be optimized for consistent performance [38]. |
| Portable Fluorescence Reader | Quantitative result interpretation; measures fluorescence intensity at test line [14] [76]. | Enables objective, quantitative analysis with a low instrumental detection limit (IDL) [14]. |
| Simulated Processed Food Models | Validation matrices; e.g., roast fish fillets, boiled meatballs [14]. | Used to validate assay performance in complex, real-world food matrices that mimic commercial products [14]. |
Technical Visualization: The Signaling Pathway in Allergic Sensitization
Understanding the molecular mechanism of tropomyosin allergy provides context for the importance of its detection. The diagram below illustrates the key signaling pathway involved in the allergic response to tropomyosin, as identified in recent research.
Figure 1: TM triggers allergic reactions via the PI3K/Akt pathway. Recent RNA-seq and in vitro studies have demonstrated that tropomyosin can upregulate the expression of phosphorylated PI3K and Akt. This activation leads to subsequent signaling through the NF-κB pathway, resulting in the release of key inflammatory factors (e.g., IL-8, TNF-α) and histamine, which drive the symptoms of allergic reaction [77].
Conclusion
The development of a quantum-dot-based sandwich LFIA represents a significant leap forward for the rapid, on-site detection of shrimp tropomyosin. This synthesis confirms that the assay successfully merges high sensitivity—with detection limits surpassing traditional gold nanoparticle strips and approaching those of lab-based ELISA—with the simplicity and speed required for point-of-care testing. Key to its performance is the rational design of the QD probe, the selection of the sandwich format for fewer false negatives, and meticulous optimization to overcome inherent nanomaterial challenges. The successful application in complex, processed foods underscores its practical utility for the food industry in ensuring allergen labeling accuracy and managing cross-contamination. Future directions should focus on multiplexing for simultaneous detection of multiple allergens, further stability enhancements for shelf-life, and the integration of portable, smartphone-based readers to democratize quantitative analysis, ultimately strengthening public health protections for allergic consumers worldwide.
References
- 1. Tropomyosin - an overview | ScienceDirect Topics [https://www.sciencedirect.com/topics/veterinary-science-and-veterinary-medicine/tropomyosin]
- 2. Quantum-dot-based sandwich lateral flow immunoassay ... [https://www.sciencedirect.com/science/article/pii/S0889157522003945]
- 3. Shellfish and House Dust Mite Allergies: Is the Link ... [https://pmc.ncbi.nlm.nih.gov/articles/PMC4713872/]
- 4. Tropomyosin-based cross-reactivity and asymptomatic ... [https://pmc.ncbi.nlm.nih.gov/articles/PMC12245884/]
- 5. Tropomyosin-based cross-reactivity and asymptomatic ... [https://www.frontiersin.org/journals/allergy/articles/10.3389/falgy.2025.1598583/full]
- 6. Quantum-dot-based sandwich lateral flow immunoassay for the ... [https://agris.fao.org/search/en/providers/122535/records/65e005910f3e94b9e5de8582]
- 7. Tropomyosin allergen from freshwater and marine water ... [https://www.sciencedirect.com/science/article/pii/S2772502225002021]
- 8. Rainbow-inspired multicolor lateral flow immunoassay ... [https://www.sciencedirect.com/science/article/abs/pii/S1385894724065756]
- 9. Highly sensitive multiplexed colorimetric lateral flow ... [https://pmc.ncbi.nlm.nih.gov/articles/PMC11502615/]
- 10. Ultrasensitive Quantification of Crustacean Tropomyosin by ... [https://pmc.ncbi.nlm.nih.gov/articles/PMC10607643/]
- 11. Visual detection of tropomyosin, a major shrimp allergenic ... [https://pmc.ncbi.nlm.nih.gov/articles/PMC10077205/]
- 12. Ten Years of Lateral Flow Immunoassay Technique ... [https://www.mdpi.com/1424-8220/21/15/5185]
- 13. Determination of Tropomyosin in Shrimp and Crab by ... [https://www.frontiersin.org/journals/nutrition/articles/10.3389/fnut.2022.848294/full]
- 14. Quantum-dot-based sandwich lateral flow immunoassay ... [https://www.sciencedirect.com/science/article/abs/pii/S0889157522003945]
- 15. Development of a fluorescent multiplexed lateral flow ... [https://www.sciencedirect.com/science/article/abs/pii/S0308814623028935]
- 16. The Developments on Lateral Flow ... [https://www.mdpi.com/2227-9040/12/6/88]
- 17. Boosting the Photostability of Carbon Quantum Dots by ... [https://www.sciencedirect.com/science/article/abs/pii/S0008622325010632]
- 18. Exploration of Quantum Dot Imaging for Enhanced ... [https://pubmed.ncbi.nlm.nih.gov/40655790/]
- 19. Carbon dots as probes in FLIM:a review of applications and ... [https://pubs.rsc.org/en/content/articlehtml/2025/ra/d5ra05371d]
- 20. Visual quantitative point-of-care immunoassay based on ... [https://pubmed.ncbi.nlm.nih.gov/40154004/]
- 21. Fast photostable expansion microscopy using QDots and ... [https://pubmed.ncbi.nlm.nih.gov/40512684/]
- 22. Lateral flow assays - PMC [https://pmc.ncbi.nlm.nih.gov/articles/PMC4986465/]
- 23. A comprehensive review of competitive lateral flow assays ... [https://pubs.rsc.org/en/content/articlehtml/2025/lc/d4lc01075b]
- 24. Sensitivity Lateral Flow Diagnostic Assays [https://www.merckmillipore.com/BT/en/technical-documents/technical-article/clinical-testing-and-diagnostics-manufacturing/ivd-manufacturing/sensitivity-lateral-flow-diagnostic-assays]
- 25. Optimization by the 4S Sequential Experimental Design ... [https://pmc.ncbi.nlm.nih.gov/articles/PMC12656006/]
- 26. Improving the sensitivity and the cost-effectiveness of a ... [https://www.sciencedirect.com/science/article/abs/pii/S0026265X24025633]
- 27. Lateral Flow Immunoassay Protocol [https://www.creative-diagnostics.com/lateral-flow-immunoassay-protocol.htm]
- 28. Recent Advances in Quantum Dot-Based Lateral Flow ... [https://pmc.ncbi.nlm.nih.gov/articles/PMC10452855/]
- 29. Development of a quantum dot-based lateral flow ... [https://www.nature.com/articles/s41598-023-49244-5]
- 30. Beyond Traditional Lateral Flow Assays: Enhancing ... [https://pmc.ncbi.nlm.nih.gov/articles/PMC11853705/]
- 31. Development of a quantum-dot lateral flow immunoassay ... [https://www.medrxiv.org/content/10.1101/2020.07.21.20159392v1.full-text]
- 32. Quantum-dot-based lateral flow immunoassay for the rapid ... [https://www.sciencedirect.com/science/article/abs/pii/S0956713519302956]
- 33. Site-specific labeling of antibodies with quantum dots could ... [https://www.sciencedirect.com/science/article/abs/pii/S0308814623002728]
- 34. Development of a fluorescent multiplexed lateral flow ... [https://pubmed.ncbi.nlm.nih.gov/38150909/]
- 35. Methods for Conjugating Antibodies with Quantum Dots [https://pmc.ncbi.nlm.nih.gov/articles/PMC12526299/]
- 36. Lateral Flow Immunoassay Basics [https://www.jacksonimmuno.com/technical/products/applications/elisa/lateral-flow/immunoassays-introduction]
- 37. Fabrication of lateral flow immunoassay strip for rapid ... [https://pmc.ncbi.nlm.nih.gov/articles/PMC9402842/]
- 38. Quantum Dot-Based Lateral Flow Immunoassay as Point-of ... [https://pmc.ncbi.nlm.nih.gov/articles/PMC9497919/]
- 39. What is meant by the limit of detection and quantification (LOD ... [https://mpl.loesungsfabrik.de/en/english-blog/method-validation/limit-of-detection-quantifcation]
- 40. Methods to determine limit of detection and ... [https://pmc.ncbi.nlm.nih.gov/articles/PMC5496743/]
- 41. Lateral flow assays for food analyses: Food contaminants ... [https://www.sciencedirect.com/science/article/abs/pii/S0165993623005058]
- 42. Quantum Dot Lateral Flow Assay Development [https://www.cd-bioparticles.com/services/quantum-dot-lateral-flow-assay-development.html]
- 43. Tailoring Quantum Dot Shell Thickness and ... [https://www.mdpi.com/2304-6732/11/7/651]
- 44. Shell thickness influence on the carrier dynamics of InP ... [https://www.sciencedirect.com/science/article/pii/S2667022424001233]
- 45. Shell thickness effects on quantum dot brightness and ... [https://pubs.rsc.org/en/content/articlelanding/2017/nr/c7nr04296e]
- 46. An Integrated Approach to Improve the Assay Performance ... [https://pmc.ncbi.nlm.nih.gov/articles/PMC10857874/]
- 47. Impacts of quantum dots in molecular detection and ... [https://pmc.ncbi.nlm.nih.gov/articles/PMC4204040/]
- 48. Strategies for Enhancing the Signal-to-Noise Ratio in ... [https://www.sciencedirect.com/science/article/abs/pii/S0165993625003620]
- 49. Qdot Nanocrystal Frequently Asked Questions [https://www.thermofisher.com/us/en/home/brands/molecular-probes/key-molecular-probes-products/qdot/frequently-asked-questions.html]
- 50. Mitigating the hook effect in lateral flow sandwich ... [https://pmc.ncbi.nlm.nih.gov/articles/PMC5839149/]
- 51. Signal amplification and quantification on lateral flow assays ... [https://pmc.ncbi.nlm.nih.gov/articles/PMC7150487/]
- 52. A novel colorimetric/fluorescent dual-signal probe based ... [https://www.sciencedirect.com/science/article/abs/pii/S0013935123013440]
- 53. A colorimetric and fluorometric dual-mode probe for Cu2 ... [https://pubmed.ncbi.nlm.nih.gov/37589853/]
- 54. Specific detection of crustacean allergens in food [https://www.sciencedirect.com/science/article/abs/pii/S2212429224015232]
- 55. Recent Advances of Processing and Detection Techniques ... [https://www.mdpi.com/2304-8158/14/2/285]
- 56. A tutorial for computing limits of detection and ... [https://www.sciencedirect.com/science/article/abs/pii/S0003267021011685]
- 57. Determining LOD and LOQ Based on the Calibration Curve [https://www.sepscience.com/hplc-solutions-126-chromatographic-measurements-part-5-determining-lod-and-loq-based-on-the-calibration-curve-6959]
- 58. Lateral flow immunoassay integrated with competitive and ... [https://www.sciencedirect.com/science/article/pii/S0022030218307264]
- 59. Development and Validation of a Lateral Flow ... [https://www.sciencedirect.com/science/article/pii/S0362028X22106101]
- 60. Novel enzyme-linked aptamer-antibody sandwich assay and ... [https://jnanobiotechnology.biomedcentral.com/articles/10.1186/s12951-023-02191-9]
- 61. Coefficient of variation [https://en.wikipedia.org/wiki/Coefficient_of_variation]
- 62. What Is the Coefficient of Variation? - Outlier Articles [https://articles.outlier.org/what-is-coefficient-of-variation]
- 63. Calculating Inter- and Intra-Assay Coefficients of Variability [https://salimetrics.com/calculating-inter-and-intra-assay-coefficients-of-variability/]
- 64. Ultrasensitive Quantification of Crustacean Tropomyosin by ... [https://www.mdpi.com/1422-0067/24/20/15410]
- 65. . ELISA - vs . SIMOA: Immuno of... | RayBiotech PCR vs Comparison [https://www.raybiotech.com/elisa-immunopcr-simoa]
- 66. Determination of Tropomyosin in Shrimp and Crab by ... [https://pmc.ncbi.nlm.nih.gov/articles/PMC8927901/]
- 67. A SILAC-based accurate quantification of shrimp allergen ... [https://www.sciencedirect.com/science/article/abs/pii/S0308814623027887]
- 68. Simultaneous Identification and Species Differentiation of ... [https://www.sciencedirect.com/science/article/abs/pii/S0308814623003035]
- 69. Quantum dots' size matters for balancing their quantity and ... [https://www.sciencedirect.com/science/article/abs/pii/S0956566321009295]
- 70. Food allergen control: Tropomyosin analysis through ... [https://www.sciencedirect.com/science/article/pii/S0308814622016211]
- 71. Achieving exceptional robustness for PFAS analysis in ... [https://sciex.com/tech-notes/food-beverage/food-and-beverage/achieving-exceptional-robustness-for-pfas-analysis-in-food-with-the-next-generation-sciex-7500-plus-system]
- 72. Determining Matrix Effects in Complex Food Samples [https://www.waters.com/blog/understanding-sample-complexity-determining-matrix-effects-in-complex-food-samples/?srsltid=AfmBOooMTGrvRIJ_R7_y4As2aRE0bh0FvFmFUXqaB5pr-D7EQpv4q36i]
- 73. In-house validation of an LC–MS method ... [https://pmc.ncbi.nlm.nih.gov/articles/PMC10766722/]
- 74. A two-colour multiplexed lateral flow immunoassay system ... [https://pmc.ncbi.nlm.nih.gov/articles/PMC6749696/]
- 75. Lateral flow test engineering and lessons learned from ... [https://www.nature.com/articles/s44222-022-00007-3]
- 76. A quantum dot-based lateral flow immunoassay for the rapid ... [https://pmc.ncbi.nlm.nih.gov/articles/PMC7048869/]
- 77. Frontiers | RNA-seq analysis of shrimp tropomyosin-induced allergic reactions through PI3K/Akt pathway [https://www.frontiersin.org/journals/nutrition/articles/10.3389/fnut.2025.1623971/full]
- 78. Preventing Cross-Contamination in Food Production [https://foodclean.com/news/what-is-cross-contamination-and-how-to-prevent-it/]
- 79. Early Signs of Contamination: How Implementing a Digital ... [https://foodindustryexecutive.com/2025/05/early-signs-of-contamination-how-implementing-a-digital-solution-can-catch-what-humans-might-miss/]