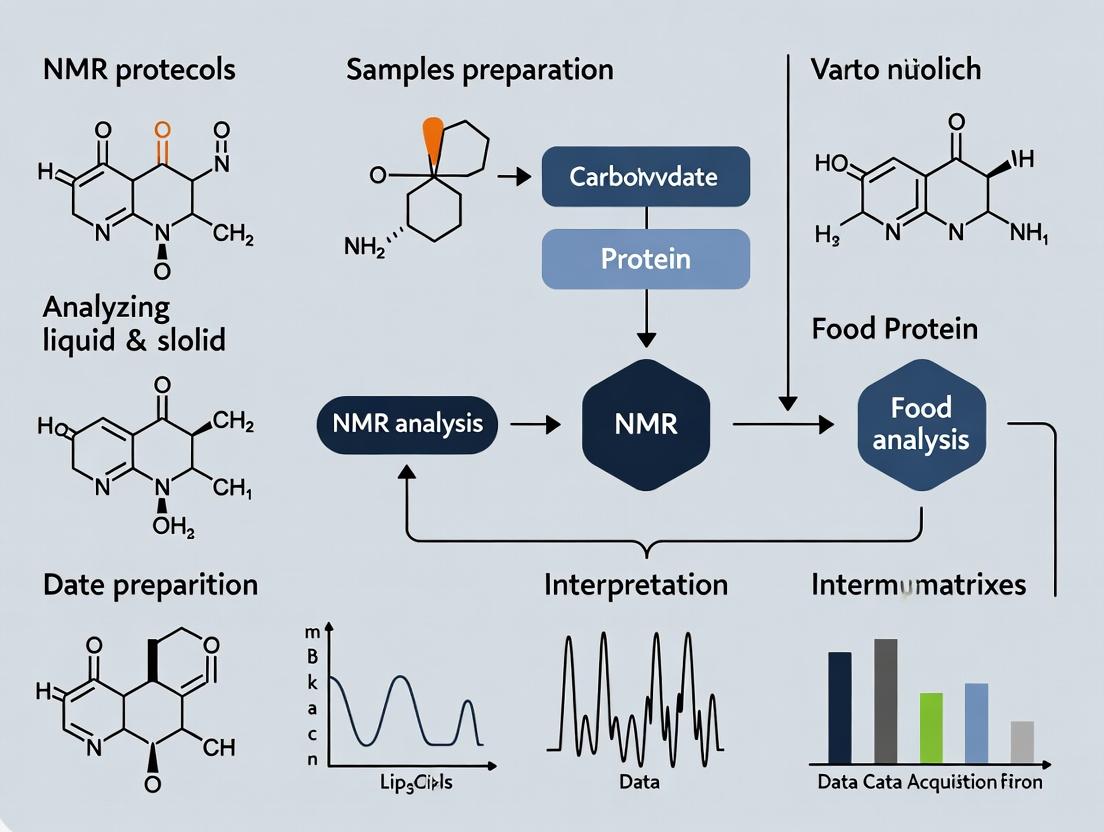
Comprehensive NMR Protocols for Food Analysis: From Liquid Beverages to Solid Matrices in Pharmaceutical Development
This article provides a systematic guide to Nuclear Magnetic Resonance (NMR) spectroscopy protocols tailored for the complex analysis of both liquid and solid food matrices, with applications in pharmaceutical and...
Comprehensive NMR Protocols for Food Analysis: From Liquid Beverages to Solid Matrices in Pharmaceutical Development
Abstract
This article provides a systematic guide to Nuclear Magnetic Resonance (NMR) spectroscopy protocols tailored for the complex analysis of both liquid and solid food matrices, with applications in pharmaceutical and nutraceutical research. It covers foundational principles distinguishing liquid- and solid-state NMR, detailed methodological workflows for diverse food samples (e.g., juices, oils, dairy, grains, tissues), practical troubleshooting for common experimental challenges, and validation strategies against complementary techniques like MS and HPLC. Aimed at researchers and drug development professionals, it serves as a resource for ensuring reproducibility, optimizing data quality, and leveraging food NMR for bioavailability, metabolite profiling, and formulation studies.
Understanding NMR Fundamentals: Key Principles for Liquid vs. Solid Food Matrices
Within the framework of a thesis on NMR protocols for food matrices research, understanding core NMR physics is paramount. Nuclear Magnetic Resonance (NMR) spectroscopy is a non-destructive analytical technique that exploits the magnetic properties of certain nuclei. For food science, it provides unparalleled insight into molecular structure, dynamics, composition, and interactions within complex liquid (e.g., juices, oils) and solid (e.g., cheese, starch) matrices. The fundamentals of spin, relaxation, and chemical shift directly inform the development of quantitative and qualitative NMR protocols for analyzing components like lipids, proteins, carbohydrates, and water.
Core Physics Principles & Relevance to Food
Nuclear Spin and Energy States
Nuclei with non-zero spin (I ≠ 0), such as ¹H, ¹³C, ³¹P, possess angular momentum and a magnetic moment. When placed in a strong external magnetic field (B₀), these magnetic moments align with the field, splitting into discrete energy states (e.g., for I=1/2: parallel (α, lower energy) and anti-parallel (β, higher energy)). The population difference between these states gives rise to net magnetization, the observable signal source.
Relevance to Food: The intrinsic sensitivity of a nucleus dictates detection limits. ¹H is the most sensitive and abundant, ideal for high-throughput profiling of oils and juices. Low-natural-abundance nuclei like ¹³C require longer acquisition times but provide direct carbohydrate backbone information.
Resonance, Larmor Frequency, and Chemical Shift
The Larmor frequency (ω₀ = γB₀) is the frequency at which nuclei precess about B₀. γ is the gyromagnetic ratio, nucleus-specific. The exact resonance frequency of a nucleus is influenced by its local electronic environment, which "shields" it from B₀. This shift, the chemical shift (δ), is reported in parts per million (ppm) relative to a reference compound. It is the primary diagnostic parameter for identifying functional groups.
Relevance to Food: Chemical shift assignments are fingerprints for food components. For example, in ¹H NMR of oils, the olefinic proton signal (δ ~5.3 ppm) indicates unsaturated fatty acids, while terminal methyl groups appear at ~0.9 ppm. In solid-state NMR, chemical shift anisotropy provides information on molecular order in semi-crystalline starches.
Relaxation: T₁ and T₂
After excitation by a radiofrequency pulse, the spin system returns to equilibrium via relaxation processes.
- Spin-Lattice (Longitudinal) Relaxation (T₁): Recovery of magnetization along B₀. Energy is dissipated to the surrounding "lattice."
- Spin-Spin (Transverse) Relaxation (T₂): Dephasing of magnetization in the plane perpendicular to B₀ due to interactions among spins.
Relevance to Food: Relaxation times are sensitive probes of molecular mobility and physical state.
- T₂ is crucial for distinguishing water populations in food matrices: tightly bound water in protein gels has a short T₂ (~1-10 ms), while free "bulk" water in a solution has a long T₂ (>100 ms).
- T₁ measurements can monitor fat crystallization and solid fat content.
Quantitative Data on NMR-Active Nuclei in Food Research
Table 1: Key NMR-Active Nuclei for Food Component Analysis
| Nucleus | Spin (I) | Natural Abundance (%) | Gyromagnetic Ratio (γ) (10⁷ rad T⁻¹ s⁻¹) | Relative Sensitivity* | Key Food Applications |
|---|---|---|---|---|---|
| ¹H | 1/2 | 99.98 | 26.75 | 1.00 | Profiling lipids, metabolites, water mobility, authentication (e.g., olive oil). |
| ¹³C | 1/2 | 1.11 | 6.73 | 1.76×10⁻⁴ | Molecular backbone structure of carbohydrates, proteins; tracking isotopic enrichment. |
| ³¹P | 1/2 | 100.00 | 10.84 | 0.066 | Phospholipids in membranes, energy metabolites (ATP, phosphates), phosphorylation state. |
| ²H | 1 | 0.0115 | 4.11 | 1.45×10⁻⁶ | Site-specific deuterium distribution for authenticity (e.g., wine, honey), water diffusion. |
| ²³Na | 3/2 | 100.00 | 7.08 | 0.093 | Sodium mobility and binding in processed foods, salt content. |
*At constant field for equal number of nuclei.
Application Notes & Experimental Protocols
Protocol A: Quantitative ¹H NMR for Lipid Oxidation in Oils
Objective: To quantify primary (hydroperoxides) and secondary (aldehydes) oxidation products in edible oils.
Principle: Hydroperoxides generate distinct ¹H NMR signals for -OOH (~8-10 ppm, broad) and bis-allylic protons. Aldehydic protons (e.g., from hexanal) resonate at ~9.5-9.8 ppm.
Materials: See Scientist's Toolkit below.
Procedure:
- Sample Preparation: Weigh 50 mg of oil into an NMR tube. Add 600 µL of deuterated chloroform (CDCl₃) containing 0.03% (v/v) tetramethylsilane (TMS) as internal standard and lock solvent. Vortex until homogeneous.
- Instrument Setup: Load sample into a 400+ MHz NMR spectrometer. Lock, tune, and match. Set temperature to 298 K.
- Pulse Sequence: Use a simple 1D ¹H pulse sequence (zg) with full relaxation. Key parameters:
- Spectral Width (SW): 20 ppm
- Number of Scans (NS): 32-64
- Relaxation Delay (D1): 20-25 seconds (≥ 5*T₁ to ensure full relaxation for quantification)
- Acquisition Time (AQ): 4 seconds
- Data Processing: Apply exponential line broadening (0.3 Hz). Fourier transform. Phase and baseline correct. Reference spectrum to TMS (δ = 0 ppm).
- Quantification: Integrate relevant peaks. For primary oxidation, integrate the hydroperoxide -OOH region (δ 8.0-10.0). Quantify using the internal standard method:
Concentration (mmol/kg) = (A_x / A_IS) * (N_IS / N_x) * (W_IS / W_sample) * 1000Where A=integral, N=number of protons, W=weight (mg).
Protocol B: T₂ Relaxometry for Water Distribution in Cheese
Objective: To characterize the distribution and mobility of water populations in a semi-solid cheese matrix.
Principle: The Carr-Purcell-Meiboom-Gill (CPMG) pulse sequence measures T₂ relaxation. A multi-exponential decay curve can be deconvoluted to identify distinct water pools with different mobilities.
Procedure:
- Sample Preparation: Cut a cylindrical core (diameter ~10 mm) from cheese block. Trim to fit a 10 mm NMR tube precisely. Seal tube to prevent dehydration.
- Instrument Setup: Use a low-field benchtop NMR spectrometer or high-field with gradient probe. Set temperature to controlled setting (e.g., 20°C).
- Pulse Sequence: CPMG sequence.
- Echo Time (τ): 0.2 - 1.0 ms (shorter τ detects faster relaxing components).
- Number of Echoes: 2000-10000 to fully capture decay.
- Recycle Delay (D1): > 5*T₁ (~5-10 seconds).
- Number of Scans: 8-16.
- Data Processing: Fit the decay curve (M(t) = Σ M₀ᵢ exp(-t/T₂ᵢ)) using Inverse Laplace Transform (ILT) or multi-exponential fitting algorithms. Identify 2-4 distinct T₂ components.
- Interpretation: Assign T₂ components: T₂₁ (~1-10 ms) → water tightly bound to proteins; T₂₂ (~20-100 ms) → water entrapped in casein network; T₂₃ (>100 ms) → free or bulk water. Changes in populations reflect aging, syneresis, or ingredient substitution.
Protocol C: High-Resolution Magic Angle Spinning (HR-MAS) NMR for Semi-Solid Foods
Objective: To obtain high-resolution ¹H NMR spectra from intact, semi-solid food samples (e.g., fruit tissue, spreads) without solvent extraction.
Principle: Rapid spinning (~2-6 kHz) of the sample at the "magic angle" (54.74°) relative to B₀ averages anisotropic interactions (dipolar coupling, chemical shift anisotropy), which otherwise cause severe line broadening in solids and viscous samples.
Procedure:
- Sample Preparation: Precisely weigh 10-20 mg of tissue (e.g., strawberry, avocado) or semi-solid. Place into a 4 mm zirconia HR-MAS rotor. Add 10-20 µL of D₂O for lock. Insert Kel-F cap.
- Instrument Setup: Install HR-MAS probe. Set spin rate to 4000 Hz. Adjust air flow for stable spinning. Lock, tune, match. Set temperature (e.g., 4°C to minimize metabolism).
- Pulse Sequence: Use a 1D ¹H sequence with pre-saturation for water suppression (e.g., noesygppr1d). Key parameters:
- Spectral Width: 12-16 ppm
- NS: 128
- D1: 2-4 seconds
- Spinning Rate: Stable at 4000-5000 Hz.
- Data Processing: Apply mild line broadening. Fourier transform. Phase, baseline, and reference (e.g., to internal lactate CH₃ at δ 1.33 ppm).
Visualizations
Title: Basic NMR Experiment Workflow
Title: Linking NMR Physics to Food Analysis Applications
The Scientist's Toolkit
Table 2: Essential Research Reagents & Materials for Food NMR
| Item | Function & Specification in Food NMR | Example Use Case |
|---|---|---|
| Deuterated Solvents | Provides a field-frequency lock signal; dissolves/extracts food components without adding interfering ¹H signals. Must be selected based on food matrix polarity. | CDCl₃ for oils, D₂O for aqueous extracts, DMSO-d₆ for polyphenols. |
| Internal Chemical Shift Reference | Provides a known ppm reference point within the sample. Must be inert and soluble. | Tetramethylsilane (TMS, δ 0.00 ppm) in organic solvents; 3-(trimethylsilyl)propionic acid-d₄ sodium salt (TSP, δ 0.00 ppm) in D₂O. |
| Internal Quantitative Standard | A compound of known concentration added to the sample for absolute quantification via peak integration. | Maleic acid, hexamethyldisiloxane (HMDSO), or specific deuterated internal standards. |
| HR-MAS Rotors & Caps | Specialized sample holders that spin at the magic angle. Rotors are typically zirconia; caps are Kel-F or PEEK. | Analyzing intact fruit, vegetable, or cheese tissue without extraction. |
| NMR Tubes | High-precision glassware. Quality affects spectral resolution. | 5 mm tubes for standard liquids; 10 mm for bulk materials; susceptibility-matched tubes for inhomogeneous samples. |
| pH Adjusters & Buffers | Control sample pH, as chemical shift of many nuclei (¹H, ³¹P) is pH-sensitive. Must be deuterated or NMR-silent. | Deuterated phosphate buffers (pH meter reading uncorrected for isotope effect). |
| Cryoprobes & Probes | Specialized detector technology that increases sensitivity by cooling the electronics, reducing noise. | Essential for detecting low-concentration metabolites or using low-γ nuclei (¹³C) in complex foods. |
Within the broader thesis on NMR protocols for food matrices research, understanding the divide between solution-state and solid-state NMR under Magic Angle Spinning (MAS) is foundational. For liquid foods (e.g., juices, oils, beverages), solution-state NMR provides high-resolution molecular dynamics data. For solid or semi-solid food matrices (e.g., proteins, starch granules, cell walls, heterogeneous mixtures), solid-state MAS-NMR is indispensable for analyzing rigid, immobile components. This application note details protocols for both, framed within contemporary food science research.
Core Principles & Quantitative Comparison
Table 1: Key Operational & Performance Parameters
| Parameter | Solution-State NMR | Solid-State MAS-NMR |
|---|---|---|
| Sample State | True liquid, soluble molecules | Solids, semi-solids, gels, powders |
| Mobility Requirement | High (tumbling rapidly) | Low/immobile (static or slow) |
| Typical Field Strength | 400 - 1000 MHz | 400 - 1200 MHz |
| Key Technique | Pulse-FT NMR | Cross-Polarization (CP), High-Power Decoupling, MAS |
| MAS Spinning Rate | Not Applied | 10 - 110 kHz (typical for foods) |
| Spectral Resolution | High (linewidths < 1 Hz) | Lower (linewidths 10-200 Hz) |
| Primary Interactions | J-coupling, chemical shift | Chemical shift anisotropy, dipole-dipole, quadrupole |
| Key Isotopes | ¹H, ¹³C (natural abundance) | ¹³C, ¹⁵N, ³¹P (often isotopically enriched) |
| Typical Experiment Time | Seconds to minutes | Hours to days |
| Primary Food Matrix Applications | Metabolic profiling, adulteration, authenticity of liquids. | Protein structure, starch retrogradation, lipid crystallization, cell wall architecture. |
Table 2: Recent Application Data in Food Research (2022-2024)
| Application | NMR Type | Key Metric | Result |
|---|---|---|---|
| Milk Protein Conformation | Solid-State CP/MAS ¹³C | % β-sheet in casein | 22.4% ± 1.1% (Fresh) vs 28.7% ± 1.3% (Spray-dried) |
| Olive Oil Adulteration | Solution-State ¹H NMR | Limit of Detection for sunflower oil | 3.2% (w/w) |
| Bread Staling Study | Solid-State CP/MAS ¹³C | C1 peak ratio (double/single helix) | Increased from 0.85 to 1.42 over 7 days |
| Fruit Juice Metabolomics | Solution-State ¹H NMR | Number of quantified metabolites | >40 compounds per sample |
| Drug-Nutrient Interaction (Vitamin B12) | Solid-State MAS ¹⁵N | Chemical Shift Change upon binding | Δδ = 5.8 ppm |
Detailed Experimental Protocols
Protocol 1: Solution-State ¹H NMR for Liquid Food Metabolic Profiling
Application: Quantitative analysis of sugars, organic acids, amino acids in fruit juice.
- Sample Preparation: Centrifuge juice at 14,000 x g for 10 min. Mix 540 µL of supernatant with 60 µL of D₂O containing 0.1% (w/w) TSP-d₄ (sodium 3-(trimethylsilyl)propionate-2,2,3,3-d₄) as chemical shift reference (δ 0.00 ppm) and quantitation standard. Transfer to 5 mm NMR tube.
- Instrument Setup:
- Spectrometer: 500 MHz or higher.
- Probe: Inverse detection cryoprobe for sensitivity.
- Temperature: 298 K.
- Pulse Sequence: 1D NOESY-presat (noesygppr1d) for water suppression.
- Acquisition Parameters: Spectral width = 20 ppm, Offset = 4.7 ppm (on water), Relaxation delay = 4 s, Mixing time = 10 ms, Acquisition time = 3 s, Number of scans = 64.
- Data Processing: Apply exponential line broadening (0.3 Hz). Fourier transform. Phase and baseline correct. Reference to TSP-d₄ at 0.0 ppm. Integrate peaks relative to TSP for quantification.
Protocol 2: Solid-State CP/MAS ¹³C NMR for Starch Retrogradeation in Bread
Application: Monitoring changes in starch crystallinity during staling.
- Sample Preparation: Lyophilize bread crumb and gently grind to a fine, homogeneous powder. Avoid gelatinization. Pack ~100 mg into a 4 mm zirconia MAS rotor with Kel-F cap.
- Instrument Setup:
- Spectrometer: 400 MHz (¹H Larmor frequency) solid-state system.
- Probe: 4 mm H/X CP/MAS probe.
- MAS Spinning Rate: Set to 10,000 Hz (± 5 Hz). Ensure stable spinning.
- Pulse Sequence: Ramped ¹H-¹³C Cross-Polarization with high-power ¹H decoupling (SPINAL-64).
- Key Parameters: ¹H 90° pulse = 3.5 µs, Contact time = 2 ms (optimize for carbohydrate C1), Recycle delay = 2 s, Spectral width = 40 kHz, Number of scans = 2048.
- Data Processing: Apply 50-100 Hz line broadening. Fourier transform. Phase correct. Reference the high-field peak of adamantane (external standard) to 38.5 ppm. Deconvolute C1 region (95-105 ppm) to quantify amorphous vs. ordered crystalline components.
Diagrams & Visualizations
Solution-State NMR Food Analysis Workflow
Solid-State CP/MAS NMR Food Analysis Workflow
Decision Logic: Choosing NMR Technique for Food Matrices
The Scientist's Toolkit: Essential Research Reagents & Materials
Table 3: Key Reagent Solutions for Food NMR Protocols
| Item | Function in Protocol | Example/Concentration |
|---|---|---|
| Deuterated Solvent (D₂O) | Provides lock signal for spectrometer; dilutes sample. | 99.9% D₂O, with or without chemical shift reference. |
| Chemical Shift Reference | Provides a known resonance for spectral calibration. | TSP-d₄ (δ 0.00 ppm for ¹H in water), DSS. Adamantane (for solid-state ¹³C). |
| MAS Rotor | Holds solid sample and spins at the magic angle (54.74°). | 4 mm zirconia rotor with drive cap (for ~10-15 kHz spinning). |
| Cryoprobe | Increases sensitivity by cooling receiver coils. | 5 mm ¹H-optimized cryoprobe for solution-state. |
| Cross-Polarization (CP) Reagents | Enhances sensitivity for low-γ nuclei (e.g., ¹³C) in solids. | N/A (technique). Requires high-power ¹H channel. |
| High-Power Decoupling Reagent | Removes heteronuclear dipolar coupling during acquisition in solids. | N/A (technique). SPINAL-64 or TPPM sequences. |
| Lyophilizer | Removes water from solid/semi-solid foods without heating, preserving structure. | Freeze-dry sample prior to grinding for MAS rotor. |
Application Notes: NMR Analysis of Food Matrices
Within the broader thesis on developing universal NMR protocols for liquid and solid food matrices, the identification and quantification of target analytes are paramount. Nuclear Magnetic Resonance (NMR) spectroscopy provides a unique, non-destructive platform for simultaneous multi-analyte detection, crucial for authenticity screening, nutritional profiling, and metabolomic studies. High-resolution solution-state ¹H NMR is the primary workhorse for liquid foods and extracts, while solid-state techniques like Cross-Polarization Magic Angle Spinning (CP/MAS) ¹³C NMR are essential for intact solid matrices. The following notes and protocols detail targeted approaches for key molecular classes.
Table 1: Key NMR Chemical Shift Regions for Food Target Analytes
| Analyte Class | Representative Molecules | Key ¹H NMR Chemical Shift (δ, ppm) | Key ¹³C NMR Chemical Shift (δ, ppm) | Primary NMR Experiment |
|---|---|---|---|---|
| Water | H₂O | 4.7 - 4.9 (suppressed) | - | Presaturation, NOESY-presat |
| Lipids | Triacylglycerides, Fatty Acids | 0.88 (terminal CH₃), 1.28 (-(CH₂)n-), 2.02 (CH₂-CH=CH-), 2.30 (CH₂-COOR), 5.34 (CH=CH) | 14.1 (terminal CH₃), 22.7-34.2 (CH₂ chain), 127-130 (CH=CH), 172-174 (C=O) | ¹H 1D, ¹³C DEPT, DOSY |
| Carbohydrates | Sucrose, Glucose, Fructose, Starch | 3.2 - 4.2 (ring H), 5.0 - 5.5 (anomeric H) | 60-65 (C6), 70-78 (C2,C3,C4,C5), 90-110 (anomeric C) | ¹H 1D, ¹H-¹³C HSQC, TOCSY |
| Proteins | Amino Acids, Peptides | 0.8-1.4 (Val, Leu, Ile CH₃), 3.1-3.3 (Lys ε-CH₂), 6.8-7.5 (His, Phe, Tyr aromatic) | 20-40 (aliphatic C), 55-65 (Cα), 170-180 (carbonyl C) | ¹H 1D, ¹H-¹³C HMBC, CP/MAS ¹³C (solids) |
| Minor Metabolites | Organic Acids, Phenolics, Alkaloids | Variable: 2.4-2.6 (organic acid CH₂), 6.5-8.0 (phenolic/aromatic) | Variable: 25-50 (organic acids), 115-160 (phenolic aromatics) | ¹H 1D, J-resolved, ¹H-¹³C HSQC |
Experimental Protocols
Protocol 1: High-Resolution Solution ¹H NMR for Liquid Foods (e.g., Juice, Milk)
Objective: Simultaneous quantification of sugars, organic acids, amino acids, and minor metabolites.
- Sample Preparation: Mix 300 µL of liquid food with 300 µL of phosphate buffer (pH 7.0, 100 mM in D₂O) containing 0.1% w/w trimethylsilylpropanoic acid (TSP) as internal chemical shift (δ = 0 ppm) and quantitation reference. Centrifuge at 14,000 x g for 10 min at 4°C. Transfer 550 µL of supernatant to a 5 mm NMR tube.
- Data Acquisition: Using a 600 MHz spectrometer equipped with a cryoprobe:
- Experiment: ¹H 1D with presaturation (NOESYGPPR1D, Bruker).
- Spectral Width: 20 ppm.
- Offset Frequency: Set on the water resonance (~4.7 ppm) for presaturation.
- Relaxation Delay (D1): 5 s.
- Number of Scans (NS): 64-128.
- Temperature: 298 K.
- Data Processing: Apply exponential line broadening of 0.3 Hz. Fourier transform, phase, and baseline correct. Calibrate spectrum to TSP at 0 ppm. Integrate target analyte regions and reference to TSP for quantitative analysis.
Protocol 2: CP/MAS ¹³C NMR for Solid Foods (e.g., Starch, Meat, Seed)
Objective: Structural characterization of macromolecular components (proteins, carbohydrates, lipids) in native solid matrices.
- Sample Preparation: Precisely weigh 100 mg of freeze-dried, homogenized solid food. Pack into a 4 mm zirconia MAS rotor. Ensure consistent packing density between samples.
- Data Acquisition: Using a solid-state NMR spectrometer with a 4 mm CP/MAS probe:
- Experiment: ¹³C CP/MAS.
- MAS Rate: 12 kHz.
- Contact Time: 2 ms (optimizes polarization transfer for CH/CH₂ groups).
- Recycle Delay: 3 s.
- ¹H Decoupling: SPINAL-64 during acquisition.
- Number of Scans: 2000-4000.
- Spectral Width: 300 ppm.
- Set chemical shift reference externally to the methylene signal of adamantane (δ = 38.48 ppm).
- Data Processing: Apply exponential line broadening (50-100 Hz). Fourier transform and phase. Manually assign peaks to chemical classes based on Table 1.
Visualizations
Title: NMR Workflow for Liquid & Solid Food Analysis
Title: Metabolic Pathway Convergence for Food Quality
The Scientist's Toolkit: Key Research Reagent Solutions
Table 2: Essential Materials for Food-Targeted NMR
| Item | Function & Rationale |
|---|---|
| Deuterated Solvent (D₂O) | Provides field-frequency lock for the spectrometer; used as the primary solvent for solution-state NMR of food extracts. |
| Chemical Shift Reference (e.g., TSP-d₄, DSS-d₆) | Provides a known, sharp internal signal (δ = 0 ppm) for precise chemical shift calibration and quantification. |
| pH Buffer in D₂O (e.g., Phosphate, 100 mM) | Controls sample pH, ensuring consistent chemical shifts for pH-sensitive analytes (e.g., organic acids, histidine). |
| MAS Rotors (4 mm, Zirconia) | Holds solid food samples for MAS experiments; zirconia is mechanically strong and NMR-inactive. |
| External Shift Reference (e.g., Adamantane) | Used to calibrate chemical shifts in solid-state CP/MAS experiments where internal references are impractical. |
| Cryogenically Cooled Probe (Cryoprobe) | Increases signal-to-noise ratio by >4x, enabling detection of low-concentration minor metabolites in complex food matrices. |
Within the broader thesis on NMR protocols for food research, a fundamental axiom is that the physical state of the sample matrix dictates the optimal nuclear magnetic resonance (NMR) experiment. The choice between liquid-state, high-resolution magic-angle spinning (HR-MAS), or solid-state NMR, and the specific nucleus targeted (¹H, ¹³C, ³¹P), hinges on matrix properties like viscosity, water content, and molecular mobility. This application note provides a structured decision framework and detailed protocols for researchers in food science and related fields.
The selection of an NMR technique is guided by the sample's macroscopic state and the specific research question. The following table consolidates key quantitative parameters and applications for each approach.
Table 1: NMR Technique Selection Guide Based on Food Matrix Properties
| Matrix State | Typical Food Samples | Recommended NMR Technique | Key Quantitative Parameters (Typical Range) | Primary Information Obtained |
|---|---|---|---|---|
| True Liquid | Juices, oils, beverages, extracts, solution of metabolites | Liquid-State ¹H NMR | • Field Strength: 400-900 MHz• Acquisition Time: 2-4 sec• 90° Pulse: 5-15 µs• Relaxation Delay (D1): 1-5 sec | Quantitative metabolite profiling, molecular structure, reaction monitoring. |
| Semi-Solid / Viscous | Fruit tissues, cheese, soft gels, meat, dough | HR-MAS ¹H NMR | • MAS Rate: 2-6 kHz• Temperature: 0-10 °C• Sample Volume: 10-50 µL• Spectral Width: 12-20 ppm | High-resolution spectra from intact tissues, spatial distribution (with imaging), metabolic profiling. |
| Solid / Dry | Seeds, bone, dry powders, crystalline additives, packaging materials | Solid-State NMR (CP-MAS) | • MAS Rate: 10-15 kHz• Contact Time (¹H-¹³C CP): 1-2 ms• ¹H 90° Pulse: 3-4 µs• Recycle Delay: 2-5 sec | Polymer structure, crystallinity, molecular dynamics, composite material interactions. |
| Targeted Molecular Analysis | Phospholipids (milk, egg), energy metabolites (ATP), phosphate additives | ³¹P NMR (Liquid or HR-MAS) | • Spectral Width: 50 ppm• Referencing: 0 ppm (external 85% H₃PO₄)• Relaxation Delay: 2-10 sec (long T1) | Phospholipid composition, phosphorylation states, phospholipid metabolism. |
| Complex Mixture Analysis | Any of the above for structural elucidation | 2D NMR (e.g., COSY, HSQC) | • HSQC: ¹JCH ~ 145 Hz• t1 increments: 128-256• Scans per t1: 2-8 | Molecular connectivity, assignment of overlapped signals, metabolite identification. |
Detailed Experimental Protocols
Protocol 1: Standard ¹H NMR Profiling of a Liquid Food Extract (e.g., Fruit Juice)
Objective: To obtain a quantitative metabolic profile.
- Sample Preparation: Mix 300 µL of juice (or aqueous extract) with 300 µL of phosphate buffer (pH 7.4, 100 mM) in D₂O containing 0.1% (w/w) sodium 3-(trimethylsilyl)propionate-2,2,3,3-d4 (TSP) as a chemical shift reference (δ 0.00 ppm) and quantitation standard.
- Instrument Setup: Load sample into a 5 mm NMR tube. Set probe temperature to 298 K. Lock, shim, and tune the probe.
- Pulse Sequence: Use a 1D NOESY-presaturation sequence (noesygppr1d) to suppress the residual water signal. Key parameters:
- Pulse Program:
noesygppr1d - Spectral Width (SW): 20 ppm
- Number of Scans (NS): 64
- Relaxation Delay (D1): 4.0 sec
- Mixing Time: 0.01 sec
- Acquisition Time (AQ): 4.0 sec
- Receiver Gain (RG): Set to optimal
- Pulse Program:
- Processing: Apply exponential line broadening (0.3 Hz), Fourier transform, phase correction, and baseline correction. Reference spectrum to TSP at 0.00 ppm.
Protocol 2: HR-MAS ¹H NMR of Intact Semi-Solid Tissue (e.g., Apple Cortex)
Objective: To analyze metabolites in native tissue state.
- Sample Preparation: Using a cork borer, obtain a cylindrical tissue core (e.g., 4 mm diameter). Using a scalpel, cut a ~4 mm length to fit a 50 µL HR-MAS rotor. Add 10 µL of D₂O containing TSP for lock and reference.
- Instrument Setup: Insert the rotor into the HR-MAS probe. Set the magic angle precisely (54.74°). Set sample temperature to 277 K (4°C) to minimize enzymatic degradation. Set MAS rate to 4 kHz.
- Pulse Sequence: Use a sequence with pre-saturation and spoil gradients (cpmgpr1d) to suppress broad macromolecular signals.
- Pulse Program:
cpmgpr1d(with τ = 1 ms, n = 100) - Spectral Width (SW): 16 ppm
- Number of Scans (NS): 128
- Relaxation Delay (D1): 2.0 sec
- MAS Rate: 4000 Hz
- Pulse Program:
- Processing: Apply a line broadening of 0.5 Hz, Fourier transform, phase, and baseline correction. Reference to TSP.
Protocol 3: Solid-State ¹³C CP-MAS NMR of a Dry Food Component (e.g., Starch)
Objective: To investigate molecular structure and dynamics in a solid.
- Sample Preparation: Pack ~100 mg of powdered sample into a 4 mm zirconia rotor with a Kel-F cap.
- Instrument Setup: Insert rotor into double-resonance MAS probe. Set MAS rate to 12,500 Hz. Calibrate ¹H and ¹³C pulse lengths. Set contact time for cross-polarization (CP).
- Pulse Sequence: Use a standard CP-MAS sequence with high-power ¹H decoupling (e.g., tppm15).
- Pulse Program:
cp - ¹H 90° Pulse: 3.5 µs
- Contact Time: 1500 µs
- Spectral Width (SW): 40 kHz (approx. 300 ppm for ¹³C)
- Number of Scans (NS): 2048
- Recycle Delay (D1): 3 sec
- MAS Rate: 12,500 Hz
- Pulse Program:
- Processing: Apply a line broadening of 50-100 Hz, Fourier transform, and phase correction. Reference the ¹³C scale to the methylene signal of glycine (δ 43.1 ppm) as an external standard.
Visualized Workflows
Title: NMR Technique Selection Workflow for Food Matrices
Title: Core Steps in a Generic NMR Experiment Protocol
The Scientist's Toolkit: Key Research Reagent Solutions
Table 2: Essential Materials for Food NMR Analysis
| Item | Function/Benefit | Example Application |
|---|---|---|
| D₂O (Deuterium Oxide) | Provides field-frequency lock signal for the NMR spectrometer; used as a solvent for hydration. | Preparing buffer for liquid extracts; adding to HR-MAS rotors for lock. |
| Chemical Shift Reference | Provides a known, sharp signal for precise chemical shift calibration (δ scale). | TSP-d4 (sodium salt) for aqueous samples; DSS for complex mixtures; glycine for solid-state ¹³C. |
| pH Buffer in D₂O | Maintains consistent sample pH, which prevents chemical shift drifting of acid-sensitive metabolites (e.g., citrate, amino acids). | 100-200 mM phosphate buffer, pH 7.4, for reproducible metabolic profiling. |
| HR-MAS Rotors & Caps | Specialized rotors that spin samples at the magic angle (54.74°) to average anisotropic interactions. | Analyzing intact tissue samples (fruit, muscle) without solvent extraction. |
| 4 mm Zirconia MAS Rotors | Robust rotors for high-speed spinning (≥10 kHz) required for solid-state CP-MAS experiments. | Analyzing crystalline or rigid components like starch, cellulose, or bone. |
| Cryogenically Cooled Probes | NMR probes cooled with liquid helium to reduce electronic noise, dramatically increasing sensitivity (Signal-to-Noise Ratio). | Detecting low-concentration metabolites or reducing experiment time for high-throughput studies. |
Application Notes & Protocols in NMR-Based Food Research
Nuclear Magnetic Resonance (NMR) spectroscopy is a non-destructive, quantitative analytical platform uniquely suited for the comprehensive analysis of complex food matrices. Its ability to provide detailed molecular fingerprints makes it indispensable for modern food science research, particularly within the framework of a thesis developing unified protocols for both liquid and solid foods. The following applications highlight its versatility.
1.1 Authenticity & Origin Verification NMR metabolomics fingerprints are powerful tools for detecting food fraud and verifying geographical origin. Statistical models built from NMR data of authentic samples can flag adulterated products.
- Key Protocol: NMR-Based Olive Oil Authenticity Screening
- Sample Preparation: Weigh 180 µL of olive oil into a 3 mm NMR tube. Add 60 µL of deuterated chloroform (CDCl₃) containing 0.03% v/v tetramethylsilane (TMS) as an internal standard for chemical shift referencing and quantification.
- NMR Acquisition: Perform ¹H NMR spectroscopy at 298 K using a standard 1D NOESY-presaturation pulse sequence (noesygppr1d) to suppress the residual water signal. Typical parameters: spectral width 20 ppm, acquisition time 4 s, relaxation delay 2 s, 64 scans.
- Data Analysis: Phase and baseline correct spectra. Align to TMS (δ 0.00 ppm). Integrate spectral bins (e.g., δ 0.04 ppm width). Export data for multivariate analysis (Principal Component Analysis - PCA, Orthogonal Partial Least Squares-Discriminant Analysis - OPLS-DA).
1.2 Food Metabolomics for Quality & Processing NMR profiles the full complement of low-molecular-weight metabolites (e.g., sugars, amino acids, organic acids), enabling the monitoring of fermentation, ripening, and processing effects.
- Key Protocol: Metabolite Extraction from Solid Food (Fruit/Vegetable) for NMR
- Homogenization: Flash-freeze sample in liquid N₂ and lyophilize. Grind to a fine powder.
- Extraction: Weigh 50 mg of powder into a microtube. Add 1 mL of cold extraction solvent (D₂O:CD₃OD, 1:1, pH 6.0 buffered with phosphate buffer). Vortex for 1 min, sonicate in ice bath for 15 min.
- Centrifugation & Collection: Centrifuge at 14,000 x g for 15 min at 4°C. Transfer 700 µL of supernatant to a 5 mm NMR tube.
- NMR Acquisition: Use a 1D presaturation pulse sequence (zgpr) for water suppression. Employ a 2D ¹H-¹³C Heteronuclear Single Quantum Coherence (HSQC) experiment for metabolite identification.
1.3 Shelf-Life and Stability Studies NMR tracks degradation products and compositional changes over time under various storage conditions, providing kinetic models for shelf-life prediction.
- Key Quantitative Data from Shelf-Life Studies:
Table 1: NMR-Monitored Compound Degradation in Fruit Juice During Storage (40°C)
*Negative rate indicates formation.Compound Initial Conc. (mg/L) Concentration after 30 days (mg/L) Degradation Rate (%/day) Ascorbic Acid 450.0 ± 12.5 285.4 ± 18.2 1.22 Fructose 25,100 ± 350 24,950 ± 420 0.02 Formic Acid 5.5 ± 0.8 18.7 ± 2.1 -0.80*
1.4 Nutrient Bioaccessibility NMR can simulate and monitor the digestive process in vitro to quantify the release of nutrients from the food matrix.
- Key Protocol: In Vitro Digestion Monitored by NMR
- Oral Phase: Mix 1 g food with 1 mL simulated salivary fluid (SSF), incubate 2 min.
- Gastric Phase: Adjust to pH 3.0, add pepsin in simulated gastric fluid (SGF). Incubate 2h at 37°C with agitation. An aliquot is taken for ¹H NMR analysis ("Gastric Digest").
- Intestinal Phase: Adjust to pH 7.0, add pancreatin and bile salts in simulated intestinal fluid (SIF). Incubate 2h. Centrifuge to separate soluble (bioaccessible) fraction.
- NMR Analysis: Acquire ¹H NMR spectra of the soluble fraction. Quantify target nutrients (e.g., polyphenols, vitamins) by integrating signals against an internal standard (e.g., DSS). Bioaccessibility (%) = (Conc. in soluble fraction / Conc. in original food) x 100.
Diagrams
Diagram Title: NMR Food Authenticity Workflow
Diagram Title: NMR Monitoring of In Vitro Digestion
The Scientist's Toolkit: Key Research Reagent Solutions
Table 2: Essential Materials for NMR-Based Food Research Protocols
| Item | Function & Rationale |
|---|---|
| Deuterated Solvents (D₂O, CD₃OD, CDCl₃) | Provides a field-frequency lock for the NMR spectrometer and minimizes intense solvent proton signals that would obscure analyte signals. |
| Internal Standards (TMS, DSS) | Chemical shift reference (TMS in organic solvents, DSS in water) and quantitative standard for absolute concentration determination. |
| Buffered Salts (e.g., K₂HPO₄/NaH₂PO₄ in D₂O) | Maintains consistent pH during NMR analysis of aqueous extracts, preventing chemical shift drift of acid/base-sensitive metabolites. |
| Simulated Digestive Fluids (SSF, SGF, SIF) | Standardized enzymatic and chemical mixtures that mimic human digestion for reproducible bioaccessibility studies. |
| NMR Tube Cleaners & Ovens | Ensures removal of all residual analytes to prevent cross-contamination between samples, critical for high-sensitivity studies. |
| Specialized NMR Probes (e.g., Cryoprobes, HR-MAS) | Cryoprobes increase sensitivity for low-concentration metabolites. HR-MAS probes allow direct analysis of semi-solid foods (e.g., cheese, fruit flesh) with minimal preparation. |
Step-by-Step NMR Protocols: From Sample Prep to Data Acquisition for Diverse Foods
Within the broader thesis on Nuclear Magnetic Resonance (NMR) protocols for liquid and solid food matrices, sample preparation is the foundational step that dictates data quality, reproducibility, and analytical scope. The strategic choice between non-destructive and destructive methodologies directly influences the ability to perform longitudinal studies, preserve sample integrity, or achieve maximum analyte extraction. This application note details the criteria, protocols, and quantitative outcomes for both strategies, providing a structured framework for researchers in food science and related fields.
Strategic Comparison & Quantitative Data
Table 1: Comparative Analysis of Preparation Strategies for Food Matrices
| Parameter | Non-Destructive Strategy | Destructive Strategy |
|---|---|---|
| Primary Goal | Preserve native state for repeated measures or further analysis. | Achieve complete homogenization and analyte extraction. |
| Sample Integrity | Maintained; physically and chemically unaltered. | Irreversibly altered or consumed. |
| Typical Methods | Minimal processing, sub-sampling, gentle packing for HR-MAS NMR. | Grinding, lyophilization, solvent extraction, acid/alkaline hydrolysis. |
| NMR Suitability | High-Resolution Magic Angle Spinning (HR-MAS) for semi-solids; intact liquid NMR. | Standard solution-state NMR; solid-state NMR for powders. |
| Throughput | Moderate to High (less processing). | Variable (can be high for automated extraction). |
| Key Advantage | Monitors metabolic changes over time in the same sample. | Higher sensitivity and resolution for low-concentration metabolites. |
| Key Limitation | Reduced sensitivity for low-abundance metabolites; matrix effects. | Loss of spatial/structural information; introduction of extraction artifacts. |
| Representative Recovery* (%) | ~100% (sample preserved) | 75-95% (analyte-dependent) |
| CV for Repeatability | 2-5% (for homogeneous liquids) | 5-15% (depends on extraction efficiency) |
*Recovery refers to the theoretical yield of the native sample state (Non-Destructive) vs. the efficiency of analyte transfer to the NMR tube (Destructive).
Detailed Experimental Protocols
Protocol A: Non-Destructive Preparation for HR-MAS NMR of Semi-Solid Foods (e.g., Cheese, Fruit Tissue)
Objective: To prepare a semi-solid food sample for metabolic profiling without altering its native physical state, enabling the detection of intact lipids, metabolites, and small molecules.
Materials:
- HR-MAS NMR system with 4mm zirconia rotors and Kel-F caps.
- Biopsy corer or punch tool (1-4 mm diameter).
- Pre-saturated D₂O solution (for lock signal).
- Trimethylsilylpropanoic acid (TSP-d₄) in D₂O (optional, as internal chemical shift reference if capillary is used).
Methodology:
- Sub-Sampling: Using a clean biopsy corer, extract a cylindrical plug (typically 10-30 mg) from the interior of the food matrix to avoid surface contaminants.
- Loading: Immediately place the intact tissue plug into a clean 4mm HR-MAS rotor.
- Lock Reference: Add 10-20 μL of D₂O to the rotor. For quantitative studies, insert a glass capillary containing a reference compound (e.g., TSP in D₂O) alongside the sample.
- Sealing: Carefully cap the rotor to prevent sample leakage and dehydration.
- NMR Acquisition: Insert the rotor into the HR-MAS probe. Set the magic angle precisely (54.74°) and spinning speed to 2-6 kHz to minimize anisotropic line broadening.
- Data Collection: Run standard 1D ¹H NMR experiments (e.g., NOESY-presat for water suppression).
Protocol B: Destructive Preparation for Solution-State NMR of Complex Solid Foods (e.g., Cereal Grains, Meat)
Objective: To comprehensively extract both polar and non-polar metabolites from a heterogeneous solid food matrix for high-resolution solution-state NMR analysis.
Materials:
- Freeze-dryer (Lyophilizer).
- High-performance ball mill or cryogenic grinder.
- Ultrasonic cell disruptor.
- Centrifuge and vortex mixer.
- NMR solvents: D₂O, CD₃OD, buffer salts, 0.05% w/v TSP-d₄ (internal standard).
Methodology:
- Homogenization & Lyophilization:
- Snap-freeze the sample in liquid nitrogen.
- Lyophilize for 48 hours or until completely dry.
- Pulverize the lyophilized material using a ball mill to a fine, homogeneous powder.
Biphasic Solvent Extraction (Modified Bligh & Dyer):
- Weigh 50 mg of powdered sample into a centrifuge tube.
- Add a 2:1:0.8 (v/v/v) mixture of CD₃OD:D₂O:Chloroform-d (total volume ~3.8 mL). Note: Chloroform-d is hazardous; use in fume hood.
- Vortex vigorously for 1 minute, then sonicate in an ice bath for 15 minutes.
- Centrifuge at 12,000 x g for 20 minutes at 4°C. This yields a two-phase system: methanol/water (polar) top layer and chloroform (non-polar) bottom layer.
Phase Separation & Preparation:
- Carefully separate the two phases using a Pasteur pipette.
- Transfer each phase to separate vials and evaporate under a gentle stream of nitrogen.
- For the polar phase: Reconstitute the dried extract in 600 μL of phosphate buffer (0.1 M, pH 7.0) in D₂O containing 0.05% TSP-d₄.
- For the non-polar phase: Reconstitute in 600 μL of CDCl₃/CD₃OD (2:1 v/v) containing 0.05% Tetramethylsilane (TMS).
- Centrifuge any insoluble residue at 16,000 x g for 10 minutes.
NMR Acquisition: Transfer 550 μL of the clear supernatant to a standard 5mm NMR tube. Acquire 1D ¹H NMR spectra with appropriate water or solvent suppression.
Visualization of Decision Pathway and Workflows
Title: Decision Pathway for Sample Preparation Strategy Selection
Title: Non-Destructive HR-MAS NMR Workflow
Title: Destructive Extraction NMR Workflow
The Scientist's Toolkit: Research Reagent Solutions
Table 2: Essential Materials for NMR Sample Preparation of Food Matrices
| Item | Function in Protocol | Key Consideration |
|---|---|---|
| HR-MAS Rotor (4mm) | Holds semi-solid samples for magic angle spinning. | Use zirconia for strength; ensure caps seal properly to prevent dehydration. |
| D₂O (Deuterium Oxide) | Provides NMR field frequency lock signal. | Degree of deuteration (99.9%) impacts lock stability. Pre-saturate with sample analytes if needed. |
| TSP-d₄ (Trimethylsilylpropanoic acid-d₄) | Internal chemical shift reference (δ 0.00 ppm) and quantitative standard for aqueous phases. | Must be chemically inert; binds to proteins, so use with caution in protein-rich matrices. |
| CD₃OD (Deuterated Methanol) | Extraction solvent for polar metabolites; provides NMR lock for organic phases. | Hygroscopic; store over molecular sieves to prevent H₂O contamination. |
| Chloroform-d | Extraction solvent for lipids and non-polar metabolites. | Toxic; use in fume hood. Stabilized with silver foil or amylene. |
| Phosphate Buffer in D₂O (pH 7.0) | Standardizes pH for polar extracts, minimizing chemical shift variation. | Use potassium salts to avoid precipitate in the NMR tube. |
| Cryogenic Mill | Homogenizes tough, fibrous, or fatty foods into a fine powder at liquid N₂ temperatures. | Prevents thermal degradation of labile metabolites during grinding. |
| Ultrasonic Disruptor | Enhances cell lysis and metabolite extraction efficiency via cavitation. | Use with cooling to prevent heat-induced chemical degradation. |
This application note details nuclear magnetic resonance (NMR) spectroscopy protocols for analyzing liquid food matrices, framed within a broader thesis on developing standardized NMR methodologies for food matrices. The focus is on solvent selection, buffering strategies, and internal referencing to ensure reproducibility and accurate metabolite quantification in complex liquid foods.
Solvent Choice and Sample Preparation Protocols
General Considerations
The primary solvent for NMR analysis of liquid foods is deuterated water (D₂O) or deuterated solvents that match the sample's native matrix. The goal is to minimize chemical shift perturbations and maintain molecular interactions similar to the native state.
Detailed Protocols by Matrix
Protocol A: Fruit/Vegetable Juice Analysis
- Centrifugation: Centrifuge 1 mL of raw juice at 14,000 × g for 20 minutes at 4°C to remove particulate matter.
- pH Measurement: Record the pH of the clarified supernatant.
- Buffering: Mix 540 µL of supernatant with 60 µL of a 1 M phosphate buffer solution (prepared in D₂O, pD 7.0). For acidic juices (pH < 3.5), use a citrate buffer (pD 4.0).
- Reference Standard: Add 10 µL of a 10 mM 3-(trimethylsilyl)propionic-2,2,3,3-d₄ acid sodium salt (TSP-d₄) or 0.1% (w/w) DSS-d₆ (2,2-dimethyl-2-silapentane-5-sulfonate-d₆) solution.
- Final Volume: Transfer 600 µL of the mixture to a 5 mm NMR tube.
Protocol B: Milk (Bovine) Analysis
- Defatting: Centrifuge 1.5 mL of milk at 5,000 × g for 30 minutes at 4°C. Carefully skim off the fat layer.
- Protein Removal: Add 300 µL of deuterated acetonitrile (CD₃CN) to 600 µL of defatted milk. Vortex for 1 minute.
- Precipitation: Incubate at -20°C for 20 minutes, then centrifuge at 14,000 × g for 15 minutes at 4°C.
- Buffering & Referencing: Combine 540 µL of the clear supernatant with 60 µL of 1 M phosphate buffer in D₂O (pD 7.0) and 10 µL of 10 mM TSP-d₄.
- Final Volume: Transfer to NMR tube.
Protocol C: Wine (Still) Analysis
- Alcohol Reduction (Optional): For high-resolution spectra of low-concentration metabolites, use a gentle stream of nitrogen or argon to evaporate ethanol to <5% (v/v).
- Buffering: Mix 540 µL of (treated) wine with 60 µL of 1 M phosphate buffer in D₂O. Adjust buffer to pD 3.2 using DCl to match wine pH and minimize chemical shift drift.
- Reference Standard: Add 10 µL of 50 mM sodium formate (HCOONa) in D₂O as an internal chemical shift reference (δ 8.44 ppm). Note: DSS/TSP can bind polyphenols; formate is preferred.
- Final Volume: Transfer to NMR tube.
Protocol D: Edible Oil Analysis
- Solvent Choice: Use deuterated chloroform (CDCl₃) for lipid-soluble components.
- Sample Preparation: Dissolve 50-100 mg of oil directly in 600 µL of CDCl₃.
- Reference Standard: Add 5 µL of 0.1% (v/v) tetramethylsilane (TMS) as internal reference (δ 0.00 ppm).
- Vortex: Ensure complete homogenization.
Solvent and Buffer Selection Table
Table 1: Recommended Solvent and Buffer Systems for Liquid Food NMR Analysis.
| Food Matrix | Primary Deuterated Solvent | Recommended Buffer | Target pD | Internal Reference | Key Rationale |
|---|---|---|---|---|---|
| Fruit/Vegetable Juice | D₂O (90%) | Phosphate or Citrate | 7.0 or 4.0 | TSP-d₄ / DSS-d₆ | Suppresses water peak, stabilizes pH for sugars/acids. |
| Milk | D₂O (with CD₃CN prep) | Phosphate | 7.0 | TSP-d₄ | Removes proteins/fats, mimics physiological pH. |
| Wine | D₂O | Phosphate | 3.2 | Sodium Formate | Matches native low pH, avoids polyphenol binding to DSS. |
| Edible Oil | CDCl₃ | Not Applicable | N/A | TMS | Native solvent for lipophilic compounds. |
Referencing and Quantitative Standards
Internal Reference Standards
A 0.5 mM final concentration of DSS is optimal for 1D ¹H NMR quantification. For 2D experiments or when binding is a concern (e.g., wine), use an external reference in a coaxial insert.
Protocol for Quantitative ¹H NMR (qNMR)
- Standard Solution: Precisely prepare a 10.0 mM stock of DSS in D₂O.
- Spiking: Add a known volume (e.g., 30 µL) of DSS stock to 570 µL of buffered sample.
- Acquisition: Use a 1D NOESY-presat pulse sequence (noesygppr1d) with sufficient relaxation delay (D1 ≥ 5 * T1, typically 25-30 seconds).
- Processing: Apply exponential line broadening (0.3 Hz), zero-filling, and careful manual phasing and baseline correction.
- Quantification: Integrate target metabolite peaks and the DSS methyl singlet at 0.00 ppm. Calculate concentration using: Cmet = (Imet / IDSS) * (NDSS / Nmet) * CDSS, where I=integral, N=number of protons.
The Scientist's Toolkit
Table 2: Essential Research Reagent Solutions for NMR of Liquid Foods.
| Item | Function / Explanation |
|---|---|
| D₂O (99.9% D) | Primary NMR solvent for aqueous foods; provides deuterium lock signal. |
| Potassium Phosphate Monobasic/Dibasic (dried) | For preparing biologically relevant phosphate buffer solutions in D₂O. |
| DSS-d₆ (or TSP-d₄) | Primary internal chemical shift (δ 0.00 ppm) and quantification standard for aqueous samples. |
| Sodium Formate | Alternative internal reference for acidic matrices (e.g., wine) where DSS binding occurs. |
| TMS in CDCl₃ | Internal chemical shift standard (δ 0.00 ppm) for lipid/oil analysis in organic solvents. |
| CD₃CN (Deuterated Acetonitrile) | Used as a protein-precipitating agent for milk/serum prior to aqueous NMR. |
| DCl / NaOD (40% in D₂O) | For precise pD adjustment of buffer and sample solutions in the NMR tube. |
| 3 mm or 5 mm NMR Tubes | High-quality, matched tubes are critical for spectral reproducibility and shimming. |
| Coaxial Insert (e.g., Wilmad) | Contains a separate reference (e.g., DSS in D₂O) for external referencing, avoiding sample interactions. |
Experimental Workflow and Data Analysis
NMR Analysis Workflow for Liquid Foods
Decision Tree for Solvent and Reference Selection
Application Notes: NMR in Complex Food Matrices
This document details specialized protocols for preparing semi-solid and heterogeneous food matrices (e.g., yogurt, cheese, fruit/vegetable purees) for Nuclear Magnetic Resonance (NMR) analysis within a broader thesis on foodomics. The primary challenge is rendering these complex, non-liquid systems into homogeneous samples suitable for high-resolution NMR while preserving the native metabolite profile. Effective homogenization and solvent extraction are critical for achieving reproducible and quantitative data in metabolomics studies aimed at quality control, authenticity, nutritional profiling, and bioactive compound discovery.
Key Challenges:
- Physical Heterogeneity: Non-uniform distribution of fats, proteins, carbohydrates, and water.
- Macromolecular Interference: High concentrations of proteins and polysaccharides can broaden NMR signals.
- Metabolite Stability: Enzymatic and oxidative degradation during processing.
- Solvent Compatibility: Extraction efficiency varies with solvent polarity and matrix composition.
Table 1: Comparison of Homogenization Techniques for Semi-Solid Foods
| Technique | Equipment | Typical Conditions | Best For (Matrix) | Key NMR Outcome (¹H) |
|---|---|---|---|---|
| Rotor-Stator | Polytron, Ultra-Turrax | 10,000-25,000 rpm, 1-3 min, 4°C | Yogurt, Purees (high water) | Good homogeneity; moderate macromolecular removal. |
| Bead Milling | Bead Beater | 0.5-1.0 mm beads, 2x 60 sec cycles | Plant/Meat Purees, Firm Cheese | Excellent cell disruption; potential heat generation. |
| Cryogrinding | Cryomill | Liquid N₂ cooling, 5 min at 30 Hz | Hard Cheese, Frozen Purees | Preserves labile metabolites; optimal for lipid profiling. |
| Ultrasonication | Probe Sonicator | 20 kHz, 50% amplitude, 30 sec pulses on ice | Soft Cheese, Emulsions | Enhances solvent extraction; risk of radical formation. |
Table 2: Solvent Systems for Metabolite Extraction Prior to NMR
| Solvent System (Ratio) | Target Metabolite Classes | Protocol (Sample:Solvent) | Post-Extraction NMR Sample Prep |
|---|---|---|---|
| Methanol:Water (4:1) | Polar metabolites (sugars, amino acids, organic acids) | 1:10 (w/v), vortex, sonicate 15 min, centrifuge 15k g, 15 min | Lyophilize, resuspend in D₂O phosphate buffer (pH 7.0) |
| Chloroform:Methanol:Water (1:2.5:1) | Biphasic; Polar + Lipids (Folch) | 1:20 (w/v), vortex, sonicate, add H₂O & CHCl₃, centrifuge | Separate phases. Polar: lyophilize. Lipid: dry under N₂, dissolve in CDCl₃. |
| Acetonitrile:Water (1:1) | Broad polar range, deproteination | 1:8 (w/v), vortex 2 min, -20°C for 1h, centrifuge 15k g, 20 min | Lyophilize, resuspend in D₂O buffer. |
| Perchloric Acid (0.6 M) | Acid-stable metabolites, removes ions | 1:5 (w/v), homogenize, centrifuge, neutralize with KOH/K₂CO₃ | Centrifuge to remove KClO₄ ppt, lyophilize supernatant, resuspend in D₂O. |
Experimental Protocols
Protocol 1: Comprehensive Metabolite Profiling of Yogurt
Objective: To extract and analyze both polar and non-polar metabolites from yogurt for ¹H NMR.
Materials: See Scientist's Toolkit. Method:
- Homogenization: Weigh 2.0 g of yogurt into a 50 mL Falcon tube. Add 20 mL of ice-cold chloroform:methanol mixture (1:2 v/v). Immediately homogenize using a rotor-stator homogenizer at 15,000 rpm for 90 seconds on ice.
- Biphasic Separation: Add 6 mL of ice-cold LC-MS grade water and 8 mL of chloroform. Vortex vigorously for 2 minutes. Centrifuge at 4,000 g for 20 minutes at 4°C to achieve phase separation.
- Polar Phase Collection: Carefully collect the upper aqueous-methanol layer (~80% of volume) into a round-bottom flask. Freeze in liquid nitrogen and lyophilize for 48 hours.
- Lipid Phase Collection: Collect the lower chloroform layer via Pasteur pipette. Transfer to a glass vial and evaporate to dryness under a gentle stream of nitrogen gas.
- NMR Sample Preparation (Polar): Reconstitute the lyophilized polar extract in 600 µL of NMR buffer (50 mM phosphate buffer in D₂O, pH 7.0, containing 0.5 mM TSP-d₄ as chemical shift reference). Centrifuge at 18,000 g for 10 minutes. Transfer 550 µL to a 5 mm NMR tube.
- NMR Sample Preparation (Lipid): Dissolve the dried lipid extract in 600 µL of CDCl₃ containing 0.05% v/v TMS. Transfer to a 5 mm NMR tube.
- NMR Acquisition: Acquire ¹H NMR spectra at 298 K using a NOESY-presat pulse sequence (for polar) or a simple 1D pulse sequence (for lipid) on a 600 MHz spectrometer. Use 128 scans and 4 prior dummy scans.
Protocol 2: Solid-Phase Extraction (SPE) for Purée Phenolic Acids
Objective: To isolate and concentrate phenolic acids from fruit/vegetable purees for targeted NMR quantification.
Materials: Puree sample, solid-phase extraction (SPE) system, C18 SPE cartridges (500 mg), acidified water (0.1% Formic acid), acidified methanol (MeOH with 0.1% FA), lyophilizer. Method:
- Crude Extract: Homogenize 5 g of puree with 25 mL of 80% aqueous methanol (acidified) using bead milling (2 x 45 sec). Centrifuge at 12,000 g for 15 min. Collect supernatant.
- SPE Conditioning: Condition a C18 SPE cartridge with 5 mL methanol, followed by 5 mL acidified water. Do not let the column dry.
- Loading: Dilute the crude supernatant 1:1 with acidified water. Load onto the conditioned cartridge at a flow rate of ~1-2 mL/min.
- Washing: Wash with 5 mL of acidified water to remove sugars and other polar interferences.
- Elution: Elute the target phenolic acids with 5 mL of acidified methanol. Collect eluent.
- Concentration: Evaporate the eluent under reduced pressure at 35°C. Resuspend the dried residue in 550 µL of 50:50 D₂O:MeOD-d₄ for NMR analysis with suppression of residual water/OH signals.
The Scientist's Toolkit
Table 3: Essential Research Reagent Solutions & Materials
| Item | Function in Protocol |
|---|---|
| D₂O-based Phosphate Buffer (50 mM, pD 7.0) | Provides a stable, deuterated locking solvent for NMR; minimizes pH variation. |
| Internal Standard (TSP-d₄) | Chemical shift reference (set to 0.0 ppm) and quantification standard for aqueous NMR. |
| Internal Standard (TMS) | Chemical shift reference (0.0 ppm) for organic solvent (CDCl₃) NMR. |
| Deuterated Solvents (D₂O, CDCl₃, MeOD-d₄) | Provides the lock signal for the NMR spectrometer; minimizes huge solvent proton signals. |
| Folch Solvent (CHCl₃:MeOH 2:1 v/v) | Gold-standard biphasic solvent system for comprehensive lipid and polar metabolite extraction. |
| C18 SPE Cartridges | Selective solid-phase extraction to isolate mid- to non-polar metabolites (e.g., phenolics) from complex polar mixtures. |
| Cryomill & Liquid Nitrogen | Enables brittle fracture of hard/frozen samples, preventing thermal degradation of metabolites. |
| Lyophilizer (Freeze Dryer) | Gently removes water and volatile solvents from extracts without heat degradation. |
Visualizations
Title: NMR Prep Workflow for Yogurt Metabolites
Title: Homogenization & Extraction Protocol Selector
Application Notes
Solid-state Nuclear Magnetic Resonance (ssNMR) is an indispensable tool for elucidating the molecular structure and dynamics of complex food matrices. Within the broader thesis on NMR protocols for food research, this document details specialized preparation techniques for solid and semi-solid foods, which present unique challenges including sample heterogeneity, thermal instability, and the presence of multiple phases. Effective sample preparation is critical for achieving high-resolution Magic Angle Spinning (MAS) NMR spectra. Cryogrinding preserves labile components, selective lipid extraction simplifies spectra for component-specific analysis, and meticulous MAS rotor packing ensures sample stability and spinning reliability. These protocols are foundational for investigating starch retrogradation in grains, protein conformation in meats, and cell wall architecture in plant tissues.
Detailed Protocols
Protocol 1: Cryogenic Grinding for Solid Foods
Objective: To homogenize solid food samples into a fine, uniform powder while minimizing thermal degradation and preserving native molecular structures. Materials: Liquid nitrogen, mortar and pestle (pre-chilled) or cryogenic impact mill, insulated gloves, safety goggles, vacuum lyophilizer. Procedure:
- Pre-cooling: Submerge a portion of the sample (e.g., 5-10g of grain, freeze-dried meat, plant tissue) and the grinding apparatus (mortar/pestle or mill vial/balls) in liquid nitrogen for at least 5 minutes.
- Grinding: Transfer the frozen sample to the pre-chilled mortar. Using the pestle, apply firm, repetitive pressure to fracture the material. Continuously replenish liquid nitrogen to keep the sample submerged or fully frozen during the entire grinding process (typically 3-5 minutes).
- Alternative (Mechanical Mill): For harder tissues, use a certified cryogenic mill. Load the frozen sample and pre-chilled grinding balls into the mill chamber. Set parameters: e.g., 2 cycles of 2 minutes at 15 Hz.
- Drying: Transfer the resulting fine powder to a lyophilization vessel. Lyophilize for 24-48 hours to remove all traces of water and residual liquid nitrogen.
- Storage: Store the dried powder in a desiccator at -20°C until further use.
Protocol 2: Sequential Solvent Extraction of Lipids
Objective: To selectively remove interfering lipid signals and concentrate on the carbohydrate or protein matrix, or to isolate lipids for separate analysis. Materials: Cryoground sample, chloroform, methanol, deionized water, centrifuge tubes, vortex mixer, bench-top centrifuge, nitrogen evaporator. Procedure:
- Weighing: Accurately weigh 100 mg of cryoground powder into a 2 mL microcentrifuge tube.
- Bligh & Dyer Extraction: Add a solvent mixture of chloroform:methanol (2:1 v/v, 1.5 mL). Vortex vigorously for 2 minutes.
- Phase Separation: Add 0.4 mL of deionized water, vortex for 30 seconds. Centrifuge at 10,000 x g for 5 minutes at room temperature.
- Collection: Carefully pipette the lower, organic (chloroform) layer containing the lipids into a clean, pre-weighed vial. Retain the upper aqueous layer and the interfacial pellet.
- Re-extraction: Repeat steps 2-4 on the residual pellet twice, pooling the organic layers.
- Drying: Evaporate the combined chloroform extracts under a gentle stream of nitrogen gas. The resulting lipid film can be re-dissolved for solution NMR or analyzed directly.
- Pellet Recovery: The defatted, dried pellet is now suitable for ssNMR analysis of the structural matrix.
Protocol 3: Packing a 4 mm MAS NMR Rotor
Objective: To uniformly and securely pack the prepared solid food powder into an ssNMR rotor for stable, high-speed magic angle spinning. Materials: Dried sample powder (cryoground or lipid-extracted), 4 mm zirconia MAS NMR rotor with caps, packing tool/funnel, micro-spatula, precision balance. Procedure:
- Weighing: Tare the empty rotor on a precision balance. The target sample mass for a 4 mm rotor is typically 30-60 mg, depending on rotor volume and sample density.
- Filling: Using a funnel, add small increments of powder into the rotor cavity. Gently tap the rotor on the bench after each addition to settle the powder.
- Packing: Use a flat-ended packing tool to apply consistent, mild pressure to compact the powder evenly. Avoid creating air pockets or overly dense regions. The goal is a uniform fill height.
- Capping: When the rotor is filled to ~80-90% of its depth, clean the sealing surfaces. Place the rotor cap (and spacer, if used) and press it firmly into place using the capping tool. Ensure it is seated evenly.
- Final Check: Wipe the rotor exterior clean. Verify the cap is secure. The rotor is now ready for insertion into the MAS NMR probe.
Data Tables
Table 1: Optimized Parameters for Cryogrinding Various Food Matrices
| Food Matrix | Recommended Grinding Tool | LN2 Soak Time (min) | Grinding Time (min) | Resulting Particle Size (µm) |
|---|---|---|---|---|
| Hard Wheat Grain | Impact Mill | 10 | 2 x 2 min cycles | < 50 |
| Freeze-dried Beef Muscle | Mortar & Pestle | 5 | 3-4 | 50-100 |
| Leafy Plant Tissue (Spinach) | Mortar & Pestle | 3 | 2-3 | 100-200 |
| Nuts (Almond) | Impact Mill | 15 | 3 x 2 min cycles | < 100 |
Table 2: Typical Lipid Extraction Yields from Select Food Tissues
| Sample Type | Initial Mass (mg) | Total Lipid Mass Extracted (mg) | Yield (% w/w) | Primary Lipid Classes Identified via NMR |
|---|---|---|---|---|
| Whole Grain Oat Flour | 100 | 7.2 ± 0.5 | 7.2% | Triacylglycerides, Phospholipids |
| Defatted Soy Flour | 100 | 1.1 ± 0.2 | 1.1% | Phospholipids, Sterols |
| Chicken Breast (freeze-dried) | 100 | 2.8 ± 0.4 | 2.8% | Phospholipids, Cholesterol |
| Avocado Pulp (freeze-dried) | 100 | 48.5 ± 2.1 | 48.5% | Triacylglycerides, Fatty Acids |
Visualizations
Sample Preparation Workflow for Solid Food ssNMR
MAS Rotor Packing Protocol for Stable Spinning
The Scientist's Toolkit
Table 3: Essential Research Reagent Solutions & Materials
| Item | Function/Application in Protocol |
|---|---|
| Liquid Nitrogen | Cryogen for embrittling samples, preventing thermal degradation during grinding. |
| Zirconia MAS Rotors (4mm) | Chemically inert, mechanically strong vessels for holding samples during high-speed magic angle spinning. |
| Deuterated Chloroform (CDCl₃) | Common NMR solvent for reconstituting lipid extracts; provides lock signal for solution NMR. |
| Chloroform-Methanol (2:1 v/v) | Standard Bligh & Dyer solvent mixture for quantitative extraction of total lipids from complex matrices. |
| Zirconia/Silicon Nitride Grinding Balls | Used in cryogenic impact mills for efficient, high-energy grinding of hard food tissues. |
| Packing Tool/Plunger | Flat-ended tool for evenly compacting powdered samples into MAS rotors to ensure homogeneity. |
| Capping Tool | Device to apply even pressure when sealing rotor caps, preventing cap ejection during spinning. |
| Kel-F or Vespel Rotor Caps/Spacers | Create airtight seal on the rotor; spacer allows for packing more sample or adjusting volume. |
Within the broader thesis on NMR protocols for food matrices, these advanced 2D NMR experiments provide a non-targeted, comprehensive molecular fingerprint of complex liquid and semi-solid foods. They move beyond 1D ( ^1H ) NMR to resolve spectral overlap, establish through-bond connectivities, and differentiate chemical groups, enabling the detection of adulteration, authentication of origin, assessment of processing effects, and monitoring of spoilage or fermentation.
J-Resolved (JRES) Spectroscopy separates chemical shift (δ) and scalar coupling (J) into two dimensions, yielding a "pseudo-2D" spectrum that simplifies crowded 1D spectra. It is invaluable for identifying metabolite families in fruit juices, wines, and honey.
Correlation Spectroscopy (COSY) identifies pairs of scalar-coupled protons (typically ( ^3J_{HH} )) within three bonds. It maps spin systems in sugars, amino acids, and organic acids, crucial for profiling olive oil, beer, and dairy products.
Total Correlation Spectroscopy (TOCSY) transfers magnetization across entire spin systems via isotropic mixing, revealing all protons within a coupled network, even without direct coupling. This is key for identifying entire molecules like complex oligosaccharides in milk or polysaccharides in plant extracts.
Heteronuclear Single Quantum Coherence (HSQC) correlates directly bonded ( ^1H ) and ( ^{13}C ) nuclei, providing a clean, well-dispersed map of C-H groups. It is foundational for metabolite identification in complex matrices like coffee, tomato puree, or wine, offering high specificity.
The integrated use of these experiments creates a powerful fingerprinting platform, transforming NMR into a high-information tool for foodomics.
Table 1: Key Parameters and Applications of Advanced NMR Experiments for Food Fingerprinting
| Experiment | NMR Nuclei Observed | Primary Information Gained | Typical Acquisition Time (for Food Sample) | Key Application in Food Analysis |
|---|---|---|---|---|
| 2D J-Resolved | ( ^1H ) (F2), J-coupling (F1) | Chemical shift & multiplicity separated | 10-25 min | Simplifying complex spectra of fruit juices, honey; identifying metabolite classes. |
| 2D COSY | ( ^1H )-( ^1H ) | Through-bond (³JHH) correlations | 15-45 min | Mapping sugar anomeric protons, lipid chains in oils, amino acids in cheese/meat. |
| 2D TOCSY | ( ^1H )-( ^1H ) | Total through-bond correlations within a spin system | 20-60 min | Revealing complete spin systems of polyphenols, peptides, oligosaccharides (e.g., in milk). |
| 2D ( ^1H )-( ^{13}C ) HSQC | ( ^1H ) (F2), ( ^{13}C ) (F1) | Direct ( ^1H )-( ^{13}C ) one-bond correlations | 30-90 min (non-uniform sampling can reduce) | Definitive metabolite ID in coffee, wine; tracking fermentation products. |
Table 2: Typical Sample Preparation Protocols for Different Food Matrices
| Food Matrix | Primary Preparation Step | Required NMR Buffer/Solvent | Special Considerations for 2D Experiments |
|---|---|---|---|
| Fruit Juice/Wine | Centrifugation (13,000 rpm, 10 min), pH adjustment | D₂O Phosphate Buffer (pH 6.0, 7.4) + 0.1% TSP | For HSQC, ensure sufficient volume (~600 µL) for good shimming. |
| Honey/Syrup | Dilution (1:1 w/w) with warm D₂O buffer, vortex, filter | D₂O Phosphate Buffer | High viscosity requires thorough mixing and longer relaxation delays. |
| Edible Oil | Direct analysis or dilution (1:5 v/v) | CDCl₃ + 0.03% TMS | No buffer needed. COSY/TOCSY essential for lipid profiling. |
| Solid Food (e.g., Tomato) | Freeze-dry, grind, polar/metabolite extraction (MeOH:H₂O), dry, reconstitute in D₂O buffer | D₂O Phosphate Buffer (pH 7.4) | Extract clarity is critical to avoid t₁ noise in 2D spectra. |
Detailed Experimental Protocols
Protocol 1: 2D J-Resolved Spectroscopy for Liquid Foods (e.g., Juice)
Objective: To decouple chemical shift and J-coupling information.
- Sample: 540 µL of centrifuged juice + 60 µL of D₂O phosphate buffer (0.1 M, pH 3.2) containing 0.1% TSP-d₄ (chemical shift reference) and 0.1% sodium azide.
- NMR Tube: Use 5 mm high-precision NMR tube.
- Spectrometer: 500 MHz or higher field strength with a triple-resonance inverse cryoprobe.
- Pulse Sequence:
jresgpprqf(Bruker) or equivalent. Uses a spin-echo to encode J-coupling. - Key Parameters:
- Spectral Width (F2, ( ^1H )): 12 ppm (e.g., -1 to 11 ppm)
- Spectral Width (F1, J): 50 Hz (e.g., -25 to +25 Hz)
- Data Points: 4k (F2) x 40 (F1)
- Scans per t1 increment: 4-8
- Relaxation Delay (D1): 2.0 s
- Total Acquisition Time: ~15 minutes.
- Processing: Apply sine-bell window functions in both dimensions. Perform a 45° tilt correction and symmetrization about F1. Project the tilted spectrum onto the F2 axis to obtain a "proton-decoupled" 1D spectrum.
Protocol 2: 2D COSY for Food Profiling (e.g., Olive Oil)
Objective: To identify scalar-coupled proton networks.
- Sample: 600 µL of oil directly in CDCl₃ in a 5 mm NMR tube.
- Pulse Sequence: Double-quantum filtered COSY (
cosygpppqf, Bruker). - Key Parameters:
- Spectral Width (F2 & F1): 12 ppm
- Data Points: 2k (F2) x 256 (t1 increments)
- Scans per increment: 8
- Relaxation Delay: 1.5 s
- Total Time: ~25 minutes.
- Processing: Apply squared sine-bell or QSINE window functions in both dimensions. Zero-filling to 1k in F1. Magnitude or absolute value mode presentation is common.
Protocol 3: 2D TOCSY with Water Suppression (e.g., Milk Whey)
Objective: To observe all protons within a coupled spin system.
- Sample: Whey protein filtrate in D₂O phosphate buffer (pH 7.0).
- Pulse Sequence:
dipsi2esgpph(Bruker) ormlevphpp(watergate version). - Key Parameters:
- Spectral Width: 12 ppm in both dimensions.
- Data Points: 2k (F2) x 256 (t1).
- Mixing Time: Critical parameter. Use 60-80 ms for small molecules, up to 100 ms for peptides.
- Scans: 16-32.
- Relaxation Delay: 2.0 s.
- Total Time: ~60 minutes.
- Processing: Use TPPI or States-TPPI for phase-sensitive data. Apply shifted sine-bell functions. Analyze cross-peak patterns to trace entire molecules.
Protocol 4: 2D ( ^1H )-( ^{13}C ) HSQC for Metabolite ID (e.g., Coffee Extract)
Objective: To correlate directly bonded ( ^1H ) and ( ^{13}C ) atoms.
- Sample: Lyophilized coffee extract reconstituted in D₂O buffer.
- Pulse Sequence:
hsqcetgp(Bruker) orhsqcetf3gpsi(sensitivity-enhanced, phase-sensitive). - Key Parameters:
- Spectral Width (F2, ( ^1H )): 12 ppm.
- Spectral Width (F1, ( ^{13}C )): 165 ppm (e.g., 0-165 ppm for aliphatic/aromatic).
- Data Points: 2k (F2) x 256 (t1).
- Scans: 32-64 (due to low ( ^{13}C ) nat. abundance).
- ( ^1J_{CH} ) Coupling Constant: Set to ~145 Hz.
- Relaxation Delay: 1.5 s.
- Optional: Use Non-Uniform Sampling (NUS) to cut time by 50-70%.
- Total Time: ~90 minutes (standard), ~30 min (NUS).
- Processing: Process with linear prediction in F1 and zero-filling. Use matched window functions (e.g., QSINE). Reference to TSP (( ^1H ): 0.0 ppm, ( ^{13}C ): 0.0 ppm) or solvent signal.
The Scientist's Toolkit: Essential Research Reagent Solutions
Table 3: Key Reagents and Materials for NMR-based Food Fingerprinting
| Item | Function & Rationale |
|---|---|
| D₂O (Deuterium Oxide), 99.9% | Primary solvent for aqueous food extracts; provides deuterium lock signal for spectrometer stability. |
| Deuterated Chloroform (CDCl₃) | Solvent for lipophilic food matrices (oils, fats). Contains TMS as internal reference. |
| Deuterated Methanol (CD₃OD) | Co-solvent for extraction of medium-polarity metabolites from solid foods. |
| Phosphate Buffer (in D₂O, pD 7.4) | Standardizes pH across samples, minimizing chemical shift variation for reproducible fingerprinting. |
| TSP-d₄ (Sodium trimethylsilylpropionate) | Chemical shift reference (0.0 ppm) for aqueous samples; deuterated to avoid extra ( ^1H ) signals. |
| TMSP-d₄ (3-(Trimethylsilyl)propionic-2,2,3,3-d4 acid) | Alternative to TSP, especially for samples below pH 5. |
| Sodium Azide (NaN₃) | Added to buffer (0.01-0.1%) to inhibit microbial growth in samples during long acquisitions. |
| 5 mm High-Precision NMR Tubes | Ensure sample spinning stability and spectral line shape quality, critical for 2D resolution. |
| Cryogenically Cooled Probes (e.g., TCI Cryoprobe) | Dramatically increases sensitivity (4x or more), enabling faster acquisition of 2D spectra on dilute analytes. |
| Non-Uniform Sampling (NUS) Software | Allows acquisition of a fraction of t1 increments, drastically reducing HSQC/TOCSY experiment time. |
Visualized Workflows and Relationships
NMR Fingerprinting Workflow for Food Analysis
Matching Analytical Problems to 2D NMR Solutions
Within the broader thesis on advanced NMR protocols for liquid and solid food matrices research, the establishment of robust, accurate, and precise quantitative NMR (qNMR) methodologies is foundational. This application note details the critical setup for qNMR using internal standards, enabling the determination of absolute concentrations of target analytes in complex food matrices, from fruit juices and wines (liquid) to powdered spices and cheeses (solid). This protocol is essential for researchers and drug development professionals requiring validated quantification for quality control, metabolomics, authenticity assessment, and pharmacokinetic studies.
The Scientist's Toolkit: Essential Reagent Solutions
Table 1: Key Research Reagent Solutions for qNMR
| Item | Function in qNMR |
|---|---|
| Certified qNMR Reference Standard | High-purity compound with known stoichiometry and certified purity (e.g., maleic acid, dimethyl sulfone, 1,4-bis(trimethylsilyl)benzene). Serves as the primary internal standard for quantification. |
| Deuterated Solvent (e.g., D₂O, CD₃OD, DMSO-d₆) | Provides the lock signal for the NMR spectrometer. Must be compatible with both the sample matrix and the internal standard. |
| Quantitative NMR Tube | Precision NMR tube (e.g., 5 mm) with consistent wall thickness and concentricity to ensure uniform magnetic field and reproducible results. |
| Electronic Reference (ERETIC) | An electronic signal generated by the spectrometer, used as an artificial internal standard, ideal for samples where adding a chemical standard is undesirable. |
| Relaxation Agent (e.g., Cr(acac)₃) | Paramagnetic complex added to reduce longitudinal relaxation times (T1), allowing for shorter recycle delays and faster data acquisition. |
| pH Buffer in D₂O | For aqueous samples, maintains consistent pH to ensure chemical shift stability of analytes, especially for pH-sensitive nuclei like ¹H. |
| Sealed Capillary with External Standard | Alternative method; a capillary tube containing a known concentration of standard in deuterated solvent, inserted into the NMR tube with the sample. |
Core Principles & Data Validation
The absolute concentration of an analyte ([Analyte]) is calculated using the equation:
[Analyte] = (I_A / I_IS) × (N_IS / N_A) × (MW_A / MW_IS) × [IS] × (P_IS / P_A)
Where:
- IA, IIS: Integrated areas of selected resonances for Analyte and Internal Standard.
- NA, NIS: Number of nuclei contributing to the respective integrated resonance.
- MWA, MWIS: Molecular weights of Analyte and Internal Standard.
- [IS]: Known molar concentration of the Internal Standard in the NMR tube.
- PIS, PA: Purity factors for the Internal Standard and Analyte (if known).
Table 2: Key Validation Parameters for qNMR Protocols
| Parameter | Target Value | Purpose & Rationale |
|---|---|---|
| Relaxation Delay (D1) | ≥ 5 x T1 (longest) | Ensures >99% magnetization recovery for accurate integration. |
| Pulse Angle | 30° or 45° | Good signal-to-noise ratio while minimizing saturation effects. |
| Number of Scans (NS) | To achieve S/N ≥ 150 | Ensures high precision in integration (<0.5% RSD). |
| Spectral Width | 20 ppm (for ¹H) | Ensures complete capture of all analyte and standard signals. |
| Acquisition Time | ≥ 3 sec | Provides sufficient digital resolution for accurate integration. |
| Line Broadening (LB) | 0.1 - 0.3 Hz | Optimizes S/N without excessively distorting line shape. |
Detailed Experimental Protocols
Protocol 4.1: qNMR for Liquid Food Matrices (e.g., Fruit Juice, Beverages)
Objective: To determine the absolute concentration of sucrose in orange juice.
Materials: Maleic acid (qNMR grade, purity 99.95±0.04%), D₂O with 0.75 mM DSS-d6 (for chemical shift reference), filtered orange juice, Cr(acac)₃ (optional), pH meter, volumetric glassware.
Procedure:
- Standard Solution Preparation: Precisely weigh (~10 mg) maleic acid into a tared 1 mL volumetric flask. Record exact mass (mIS). Dissolve and dilute to volume with D₂O to create Stock Solution A. Calculate exact concentration ([IS]stock).
- Sample Preparation: Mix 450 µL of filtered orange juice with 50 µL of Stock Solution A in an NMR tube. For better relaxation, add a crystal (~0.1 mg) of Cr(acac)₃. Mix thoroughly.
- NMR Acquisition:
- Load tube into a calibrated NMR spectrometer (e.g., 500 MHz).
- Set probe temperature to 298 K.
- Tune, match, lock, and shim the sample.
- Key Acquisition Parameters:
- Pulse Sequence: Single 90° pulse or zg30 (Bruker)
- Spectral Width: 20 ppm
- Center of Spectrum: 5 ppm
- Time Domain Points (TD): 64k
- Relaxation Delay (D1): 25 sec (assuming T1 < 5 sec)
- Number of Scans (NS): 16
- Acquisition Time: 3.27 sec
- Data Processing:
- Apply exponential multiplication (LB = 0.3 Hz).
- Fourier Transform.
- Phase and baseline correct meticulously.
- Reference spectrum to DSS signal at 0.00 ppm.
- Integrate the maleic acid vinyl proton signal (δ ~6.3 ppm, NIS=2) and the sucrose anomeric proton signal (δ ~5.4 ppm, NA=1).
- Calculation:
- Use the core equation with: IA (sucrose), IIS (maleic acid), NA=1, NIS=2, MWA=342.3 g/mol, MWIS=116.07 g/mol, [IS] = (mIS / MWIS) / 0.5 mL, P_IS=0.9995.
Protocol 4.2: qNMR for Solid Food Matrices (e.g., Ground Coffee, Powdered Spice)
Objective: To determine the absolute concentration of caffeine in ground coffee.
Materials: Dimethyl sulfone (DMSO₂, qNMR grade), CDCl₃, ultrasonic bath, centrifuge, precision balance.
Procedure:
- Extraction: Weigh 100 mg of finely ground coffee into a 2 mL microcentrifuge tube. Add 1.0 mL of CDCl₃ containing a precisely known concentration of DMSO₂ (e.g., 2.00 mM) as the internal standard. Sonicate for 20 minutes. Centrifuge at 10,000 rpm for 5 min.
- Sample Preparation: Transfer 600 µL of the clear supernatant directly into a 5 mm NMR tube.
- NMR Acquisition:
- Load and lock (CDCl₃) the sample.
- Key Acquisition Parameters:
- Pulse Sequence: zg30
- Spectral Width: 14 ppm
- D1: 30 sec
- NS: 64
- TD: 128k
- Data Processing & Calculation:
- Process as in Protocol 4.1.
- Reference to residual CHCl₃ at 7.26 ppm.
- Integrate the DMSO₂ methyl signal (δ ~3.0 ppm, NIS=6) and the caffeine methyl signal (δ ~3.3 ppm, NA=3 per methyl group; often use the singlet for one methyl).
- Apply the core equation, factoring in the exact volume/mass relationship from the extraction to report concentration as mg caffeine / g coffee.
Visualized Workflows
Diagram 1: Core qNMR Workflow for Concentration Determination
Diagram 2: The qNMR Quantification Principle
Solving Common NMR Challenges: Artifacts, Sensitivity, and Resolution in Food Analysis
Within the framework of a broader thesis on NMR methodologies for food matrices, effective water suppression is paramount, especially for high-moisture foods (>70% water). The intense solvent signal can obscure low-concentration metabolites, lipids, and flavor compounds. This document details three primary selective suppression techniques—PRESAT, WATERGATE, and Excitation Sculpting—providing application notes and standardized protocols for researchers and development professionals in food science and related fields.
The following table summarizes the key operational parameters, performance metrics, and optimal use cases for each technique based on current literature and experimental data.
Table 1: Comparative Analysis of Water Suppression Techniques for Food NMR
| Parameter | PRESAT (Pre-saturation) | WATERGATE (Water Suppression by Gradient-Tailored Excitation) | Excitation Sculpting |
|---|---|---|---|
| Core Principle | Selective RF saturation of water resonance during recovery delay. | Gradient-enhanced binomial pulse sequence (e.g., 3-9-19) to dephase water magnetization. | Dual pulsed-field gradient spin-echo; water signal is selectively not refocused. |
| Typical Suppression Factor | 10² - 10³ | 10³ - 10⁴ | 10³ - 10⁵ |
| Effective BW for Suppression | Very narrow (~50-100 Hz). | Moderate. Depends on pulse element (e.g., 3-9-19: ±500 Hz). | Wide. Effectively covers all water resonance offsets. |
| Impact on Exchangeable Protons | High (saturation transfer). | Minimal. | Minimal. |
| Susceptibility to B₀ Inhomogeneity | Low sensitivity. | Moderate sensitivity. | High sensitivity; requires good shimming. |
| Susceptibility to B₁ Inhomogeneity | High sensitivity. | Low sensitivity. | Low sensitivity. |
| Optimal Food Matrix | Simple liquids (e.g., beverages, juices). | Complex liquids & semi-solids (e.g., sauces, purees). | Well-shimmed liquids and soft solids (e.g., yogurt, gels). |
| Experiment Time Penalty | Minimal (uses recovery delay). | Moderate (due to gradient pulses). | Moderate (due to two gradient pulses). |
| Key Advantage | Simple, fast, low hardware demands. | Robust to B₁ inhomogeneity, good for exchangeable protons. | Excellent suppression, robust to B₁, frequency-selective only. |
Detailed Experimental Protocols
Protocol 3.1: PRESAT for Fruit Juice Metabolite Profiling
Objective: To suppress the water signal in orange juice for detection of sugars (e.g., sucrose, glucose, fructose) and organic acids (e.g., citrate, malate).
Materials:
- NMR spectrometer (≥ 400 MHz ¹H frequency).
- 5 mm NMR tube.
- Buffer: 100 mM Phosphate buffer (pH 3.2) in D₂O (for lock) containing 0.1% w/w TSP-d₄ (chemical shift reference δ 0.0 ppm).
- Sample: 450 µL filtered orange juice + 50 µL buffer.
Method:
- Sample Preparation: Mix juice and buffer thoroughly. Transfer 500 µL to a 5 mm NMR tube.
- Spectrometer Setup:
- Temperature: 300 K.
- Probe: Tuning and matching for ¹H.
- Lock and shim: Achieve optimal field homogeneity.
- Acquisition Parameters (1D ¹H):
- Pulse Sequence:
zgpr(Bruker) orpresat(Varian/Agilent). - Spectral Width (SW): 20 ppm.
- Center of Spectrum (O1): On the water resonance (~4.7 ppm).
- Saturation Power (SLVL/
p19): Low power, typically 50-80 Hz. - Saturation Time: Recovery delay (
d1) of 2-4 s. - Number of Scans (NS): 64-128.
- Acquisition Time: ~3 s.
- Pulse Sequence:
- Processing: Apply exponential line broadening (0.3 Hz), zero-filling, Fourier transform, and phase correction. Reference to TSP at 0.0 ppm.
Protocol 3.2: WATERGATE for Tomato Puree Analysis
Objective: To achieve strong water suppression in a semi-solid food matrix with minimal loss of signals from exchangeable protons (e.g., amines, amides).
Materials:
- NMR spectrometer with gradient system.
- 5 mm NMR tube.
- Buffer: As in Protocol 3.1.
- Sample: 450 µL centrifuged tomato puree supernatant + 50 µL buffer.
Method:
- Sample Preparation: Centrifuge puree at 14,000 g for 10 min. Mix supernatant with buffer.
- Spectrometer Setup: As in Protocol 3.1. Ensure Z-gradient is calibrated.
- Acquisition Parameters:
- Pulse Sequence:
WATERGATEusing a 3-9-19 binomial read pulse (zggpw5on Bruker). - Spectral Width (SW): 20 ppm.
- O1: Set to water resonance.
- Gradient Pulse (
p16/δ): 1 ms, shaped (sine bell). - Gradient Strength: ~10 G/cm for each of the two encoding gradients.
- Recovery Delay (
d1): 2 s. - Number of Scans (NS): 128.
- Pulse Sequence:
- Processing: As in Protocol 3.1. The WATERGATE sequence inverts all but water, so phase carefully.
Objective: To obtain high-quality spectra from a soft-solid dairy product with robust water suppression across the entire sample volume.
Materials & Sample Prep: As in Protocol 3.2, using plain yogurt.
Method:
- Spectrometer Setup: Excellent shimming is critical. Use
gradshimor equivalent. - Acquisition Parameters:
- Pulse Sequence:
NOESY-type presentation with excitation sculpting (noesygppr1don Bruker). - Spectral Width (SW): 20 ppm.
- Mixing Time (
d8): For suppression-only, set to 0.01 s. - Gradient Pulses: Two equal, shaped gradients (e.g., 1 ms sine) surrounding a 180° pulse.
- Gradient Strength: Typically 5-20 G/cm. Ratio often 80%:80% for spoil:rephase.
- Recovery Delay (
d1): 2 s. - NS: 128.
- Pulse Sequence:
- Processing: Standard processing. The sequence yields pure absorption mode spectra.
Visualization of Techniques
Diagram 1: Water Suppression Technique Selection Logic
The Scientist's Toolkit: Key Research Reagent Solutions
Table 2: Essential Materials for Water-Suppressed Food NMR
| Item | Function/Description | Key Consideration for Food Matrices |
|---|---|---|
| D₂O-based Buffer (e.g., 100 mM phosphate, pH 3.0-3.5) | Provides field-frequency lock for the spectrometer, controls pH to minimize chemical shift variation of analytes. | Low pH minimizes protein aggregation and broad signals. Use minimum volume (5-10%) to avoid excessive sample dilution. |
| Chemical Shift Reference (e.g., TSP-d₄, DSS-d₆) | Internal standard for chemical shift calibration (δ 0.0 ppm) and potential quantitative reference. | Must be inert and non-interacting with food components. TSP can bind to proteins; DSS may be preferred for protein-rich samples. |
| Susceptibility Matched NMR Tubes (e.g., 5 mm Wilmad 535-PP) | High-quality tubes with consistent wall thickness to maximize magnetic field homogeneity (shimming). | Critical for techniques sensitive to B₀ inhomogeneity like Excitation Sculpting. |
| Micro-volume Inserts/Capillaries | For use with limited sample volume, or to contain a coaxial reference standard. | Useful for precious or high-value food extracts. |
| Gradient Calibration Kit | Solutions for accurately calibrating the spectrometer's pulsed-field gradient strength (e.g., doped H₂O/D₂O). | Essential for the precise implementation of WATERGATE and Excitation Sculpting. Gradient accuracy impacts suppression. |
| Shim Solution (e.g., 10% D₂O in H₂O) | A test sample for manually or automatically optimizing (shimming) the magnetic field homogeneity. | Required daily. Food matrices, especially semi-solids, often degrade shim quality compared to neat solutions. |
Within the broader thesis exploring NMR protocols for liquid and solid food matrices, this document addresses a central challenge in solid-state NMR: signal broadening. In food science, analyzing solid components like starch granules, crystalline fats, dietary fibers, and protein aggregates is crucial for understanding structure-function relationships, nutrient bioavailability, and product stability. Magic Angle Spinning (MAS) and Cross-Polarization (CP) are indispensable techniques for obtaining high-resolution (^{13}\text{C}) and (^{15}\text{N}) spectra from such heterogeneous, often amorphous, food solids. The optimization of MAS speed and CP contact time is critical to overcome anisotropic interactions (chemical shift anisotropy, dipolar coupling) that cause severe line broadening, thereby enabling the quantification of minor components, mapping of molecular mobility, and studying of phase transitions in complex food systems.
The primary sources of line broadening in static solids are:
- Dipolar Couplings: Through-space magnetic interactions between nuclei.
- Chemical Shift Anisotropy (CSA): The dependence of chemical shift on molecular orientation relative to the magnetic field.
- Quadrupolar Interactions: For nuclei with spin > 1/2 (e.g., (^{2}\text{H}), (^{17}\text{O})).
MAS averages anisotropic interactions by spinning the sample at the "magic angle" (54.74°) relative to the magnetic field. The efficiency of averaging is dictated by the spinning speed ((ν\text{r})) relative to the magnitude of the interaction. CP enhances sensitivity of low-γ nuclei (like (^{13}\text{C})) by transferring polarization from abundant, high-γ nuclei (like (^{1}\text{H})), while simultaneously exploiting the (^{1}\text{H}) spin-lattice relaxation time ((T{1ρ})) to filter out signals from highly mobile components—a key feature for differentiating rigid and soft domains in food matrices.
Key Quantitative Data & Optimization Targets
The following tables summarize critical parameters and their target values for high-resolution SSNMR in food applications.
Table 1: Effect of MAS Speed on Resolution of Common Anisotropic Interactions
| Interaction Type | Typical Magnitude (kHz) in Food Solids | Minimum MAS Speed for Effective Averaging (kHz) | Recommended MAS Speed for High-Resolution (kHz) |
|---|---|---|---|
| (^{1}\text{H})-(^{13}\text{C}) Dipolar Coupling | 20-35 | > 5-7 | 12-15 (≥ Magnitude) |
| (^{13}\text{C}) CSA (Carbonyls) | 3-6 | > 3 | 10-14 |
| (^{1}\text{H})-(^{1}\text{H}) Dipolar Coupling | 50+ | > 50 (Very challenging) | 60-110 (Fast-MAS) |
| (^{14}\text{N}) Quadrupolar (Proteins) | 1000+ | Not averaged by MAS | Use CP or Special Sequences |
Table 2: Optimized Cross-Polarization Parameters for Food Components
| Food Matrix Component | Optimal CP Contact Time (ms) | Typical (^{1}\text{H}) (T_{1ρ}) (ms) | Primary Purpose of Analysis |
|---|---|---|---|
| Rigid Polymer (Crystalline Starch) | 1.5 - 2.5 | 10-15 | Crystallinity, chain packing |
| Semi-rigid Polymer (Gluten, Casein) | 0.8 - 1.5 | 5-10 | Protein secondary structure |
| Amorphous Carbohydrate (Glass) | 0.5 - 1.0 | 2-8 | Mobility, glass transition |
| Crystalline Lipid (β-polymorph) | 1.0 - 2.0 | 8-12 | Fatty acid packing, phase ID |
| Soft/ Mobile Phase (Oil, Water) | < 0.1 | < 1 | Often suppressed by CP |
Experimental Protocols
Protocol 1: Systematic Optimization of MAS Speed
Objective: Determine the MAS speed required to resolve key spectral regions in a complex solid food sample (e.g., whole-grain flour). Materials: 4 mm ZrO(_2) rotor, whole-grain flour sample (~50 mg), SSNMR spectrometer with MAS probe. Procedure:
- Set up a standard (^{13}\text{C}) CP/MAS experiment with a conservative contact time (e.g., 2 ms) and sufficient recycle delay (2-3 s).
- Acquire spectra at increasing MAS speeds: 5, 8, 10, 12, 14, and 60 kHz (if a 1.3 mm rotor is available).
- Process all spectra identically: apply Lorentzian line broadening (50-100 Hz), zero-filling, and Fourier transformation.
- Analysis: Measure the linewidth (FWHM) of a well-isolated peak (e.g., the C1 anomeric carbon of starch at ~100 ppm) at each speed. Plot MAS speed vs. linewidth. The speed at which linewidth plateaus near the theoretical limit is optimal for that component. Note the appearance of spinning sidebands, which diminish and move away from centerbands as speed increases.
Protocol 2: Determining Optimal CP Contact Time via (^{13}\text{C}) Signal Build-up
Objective: Characterize molecular mobility and quantify components in a multi-phase food system (e.g., cheese: protein, fat, calcium phosphate). Materials: 4 mm rotor, cheese sample cut to fit rotor, SSNMR spectrometer. Procedure:
- Set MAS speed to a fixed, optimized value (e.g., 12 kHz).
- Run a series of (^{13}\text{C}) CP/MAS experiments, incrementing the contact time (τ) from 0.01 ms to 10 ms in logarithmic steps (e.g., 0.01, 0.05, 0.1, 0.3, 0.5, 0.8, 1, 2, 3, 5, 8, 10 ms).
- Keep all other parameters constant (recycle delay, number of scans).
- Analysis: For characteristic peaks (e.g., lipid CH(2) at ~30 ppm, protein carbonyl at ~175 ppm), plot signal intensity I(τ) vs. τ. Fit the data to the CP dynamics equation: ( I(τ) = I0 [1 - \exp(-τ/T{CP})] \exp(-τ/T{1ρ}^H) ). The optimal contact time for maximum signal is approximately (τ{opt} ≈ T{CP} ). The decay constant (T_{1ρ}^H) provides a direct measure of local rigidity/mobility.
Diagram: Experimental Optimization Workflow
Title: Workflow for Optimizing MAS Speed and CP Contact Time
The Scientist's Toolkit: Essential Research Reagent Solutions
Table 3: Key Materials for SSNMR of Food Matrices
| Item | Function & Rationale |
|---|---|
| 4 mm Zirconia (ZrO₂) Rotor | Standard rotor for CP/MAS at speeds up to ~15 kHz. Compatible with ~50 mg of heterogeneous food powder or paste. |
| 1.3 mm MAS Rotor System | Enables "fast-MAS" (≥ 60 kHz) to directly average strong (^{1}\text{H})-(^{1}\text{H}) dipolar couplings, allowing for (^{1}\text{H})-detected experiments on solids. Requires < 5 mg sample. |
| Kel-F or Vespel Caps | Chemically inert end-caps for rotors. Essential to prevent sample contamination and ensure safe spinning. |
| Glycine (Powder Standard) | Primary external standard for chemical shift referencing ((^{13}\text{C}) carbonyl at 176.03 ppm) and for setting the magic angle. |
| Adamantane (Powder) | Secondary standard used to check (^{1}\text{H})→(^{13}\text{C}) CP efficiency and spectrometer resolution/linewidth. |
| Silicon Rubber (or HMDS) | Provides a sharp (^{29}\text{Si}) reference peak for magic angle adjustment and hardware calibration. |
| Deuterated Lock Solvent | e.g., Acetone-d6, DMSO-d6. Placed in a sealed capillary and co-axially inserted with the solid sample for instruments requiring a field/frequency lock. |
| High-Purity Drying Agent | e.g., P₂O₅ powder. For preparing "controlled humidity" samples to study water's plasticizing effect (e.g., on starch, proteins) without interference from liquid water signals. |
Application Notes: Dynamic range limitations in NMR spectroscopy present a significant challenge when analyzing complex food matrices, where highly concentrated compounds like triglycerides (in oils/fats) or sugars (e.g., sucrose in beverages) dominate the spectral signal. This obscures crucial low-concentration analytes (e.g., micronutrients, contaminants, or drug traces), compromising quantitative accuracy and metabolomic profiling. Effective suppression or separation of these dominant signals is essential for comprehensive matrix characterization within modern food research and drug-food interaction studies.
Quantitative Data Summary: Common Concentrations & NMR Parameters
| Matrix | Dominant Compound | Typical Concentration Range | ¹H NMR Chemical Shift (ppm) | Required Dynamic Range (Molar Ratio vs. Trace Analytes) |
|---|---|---|---|---|
| Edible Oils | Triglycerides (e.g., Triolein) | ~99% (w/w) | 0.88 (-CH₃), 1.29 (-(CH₂)n-), 2.02 (-CH₂-CH=CH-), 2.30 (-CH₂-COO-), 5.33 (-CH=CH-) | 10³ : 1 to 10⁵ : 1 |
| Soft Drinks | Sucrose / High-Fructose Corn Syrup | 5-12% (w/v) | Sucrose: 5.40 (anomeric H), 3.50-4.20 (ring H) | 10² : 1 to 10⁴ : 1 |
| Dense Foods (e.g., Nut Paste) | Triglycerides & Sugars | Fats: 40-60%, Sugars: 10-30% | Triglyceride & Sugar regions overlap | >10⁴ : 1 |
| Fortified Beverages | Lactose / Sugars | 4-8% (w/v) | Lactose: 4.46, 5.23 (anomeric H) | 10³ : 1 to 10⁴ : 1 |
Table 1: Key Research Reagent Solutions
| Item | Function & Rationale |
|---|---|
| Deuterated Solvent (e.g., CDCl₃, D₂O) | Provides lock signal; minimizes solvent proton interference. |
| Relaxation / Suppression Reagents (e.g., Cr(acac)₃, Gd-DOTA) | Paramagnetic agents that shorten T1 of dominant signals, aiding suppression via inversion recovery. |
| Standard Reference (e.g., TMS, DSS) | Provides chemical shift reference (0 ppm) and potential quantitative internal standard. |
| Buffer Salts (e.g., Phosphate buffer in D₂O, pD 7.4) | Maintains consistent pH/pD, critical for chemical shift stability of acids/bases. |
| Selective T1ρ or Saturation Reagents | Chemical exchange systems (e.g., ammonium ions) for selective saturation transfer to water/sugar signals. |
Experimental Protocols
Protocol 1: ¹D ¹H NMR with Double Suppression (Presaturation + T1 Filter) for Liquid Foods Objective: Attenuate dominant signals from both water and sugars/triglycerides to observe low-concentration metabolites.
- Sample Prep: Mix 450 µL of beverage (e.g., fruit juice) or lipid extract with 50 µL of D₂O containing 0.05% (w/v) DSS. Centrifuge at 14,000 x g for 5 min.
- NMR Setup: Load into 5 mm NMR tube. Use spectrometer (e.g., 600 MHz) with temperature control at 298 K.
- Pulse Sequence: Employ a 1D NOESY-presat sequence with an added inversion recovery module. Key parameters:
- Presaturation: Low-power irradiation at water (δ 4.7 ppm) and sugar anomeric (δ ~5.2-5.4 ppm) frequencies during relaxation delay (2.5 s).
- Inversion Recovery: Use a 180° pulse followed by a variable inversion time (Tᵢ). For triglyceride suppression, calculate Tᵢ = ln(2) * T1(triglyceride). Typical T1 of TG -CH₂- is ~0.5 s, thus Tᵢ ≈ 350 ms.
- Acquisition: 90° pulse, acquisition time 3.0 s. Total scans: 128.
- Processing: Apply 0.5 Hz exponential line broadening, Fourier transform, phase, and baseline correct. Reference DSS to 0 ppm.
Protocol 2: ²D ¹H-¹³C HSQC with Band-Selective Excitation for Spectral Dispersion Objective: Resolve signals in crowded regions by spreading peaks into a second dimension, separating trace analyte cross-peaks from intense background.
- Sample Prep: As in Protocol 1, but for solid foods (e.g., chocolate), use a standardized extraction: homogenize 1 g sample with 4 mL CDCl₃:MeOD-d₄ (2:1), centrifuge, collect supernatant.
- NMR Setup: Standard 5 mm inverse detection probe.
- Pulse Sequence: Use band-selective HSQC (e.g., seHSQC). Key parameters:
- Selective Excitation: Apply a shaped pulse (e.g., REBURP) centered on the aliphatic region (δ ¹H 0.5-2.5 ppm) to selectively observe correlations from triglycerides and trace aliphatic metabolites, excluding the noisy sugar/water region.
- ¹³C Decoupling: Use GARP4 during acquisition.
- Scan Count: 8-16 scans per t1 increment; 256 t1 increments.
- Spectral Windows: ¹H (F2): 12 ppm; ¹³C (F1): 80 ppm (focused on aliphatic/olefinic carbons).
- Processing: Use squared cosine window functions in both dimensions, zero-filling to 1k x 1k data points, and linear prediction in t1. Analyze cross-peak volumes with reference to an internal standard spike.
Visualizations
Title: NMR Workflow for Dominant Signal Management
Title: Cause-Effect Pathway for NMR Dynamic Range Issues
1. Introduction & Context Within the broader thesis on NMR protocols for food matrices, the reproducibility of chemical shifts is paramount for metabolite identification and quantification. In complex liquid foods like fruit juices and fermented products (e.g., wine, kombucha), variable pH and ionic strength are dominant sources of chemical shift instability. This document details standardized protocols to mitigate these effects, ensuring robust and comparable ¹H NMR data across studies.
2. Key Quantitative Effects: A Data Summary The following tables summarize the typical chemical shift perturbations (Δδ in ppm) for key metabolite resonances under varying conditions relevant to fruit juices and fermented beverages.
Table 1: Chemical Shift Perturbation (Δδ) of Selected Metabolites with pH Variation
| Metabolite | Nucleus | Functional Group | Δδ per pH unit (approx.) | Notes |
|---|---|---|---|---|
| Citric Acid | ¹H | CH₂ (AB system) | 0.05 - 0.10 | Highly sensitive near pKa (~3.1, 4.8, 6.4) |
| Lactic Acid | ¹H | CH₃ | 0.01 - 0.03 | Sensitive near pKa 3.86 |
| Acetic Acid | ¹H | CH₃ | 0.02 - 0.05 | Sensitive near pKa 4.76 |
| Histidine | ¹H | Imidazole C₂-H, C₄-H | >0.10 | Extreme sensitivity (pKa ~6.0) |
| Ethanol | ¹H | CH₃ | <0.005 | Largely insensitive |
Table 2: Chemical Shift Perturbation (Δδ) Due to Ionic Strength Changes (Salt Addition)
| Added Salt | Concentration Range | Typical Δδ Magnitude | Most Affected Metabolites |
|---|---|---|---|
| KCl | 0 - 500 mM | 0.001 - 0.015 ppm | Charged species, organic acids |
| NaCl | 0 - 500 mM | 0.001 - 0.020 ppm | Charged species, can cause slight bulk susceptibility shifts |
| Phosphate Buffer | 10 - 100 mM | <0.01 ppm (when pH matched) | Minimal when used for pH stabilization |
3. Core Experimental Protocols
Protocol 1: Standardized Sample Preparation for pH and Ionic Strength Stabilization
- Objective: To prepare fruit juice or fermented product NMR samples with controlled pH and consistent ionic strength.
- Materials: See "Scientist's Toolkit" below.
- Procedure:
- Clarification: Centrifuge beverage sample at 14,000 x g for 10 min at 4°C. Filter supernatant through a 0.45 μm PVDF membrane.
- Deuterium Lock & Reference: Mix 630 μL of clarified sample with 70 μL of D₂O. Add 10 mM of internal standard DSS-d₆ (final concentration ~1.0 mM). Vortex for 10 seconds.
- pH Measurement & Adjustment: Insert a micro-pH electrode directly into the NMR tube or a separate aliquot prepared identically. Record the native pH.
- pH Stabilization: Using microliter volumes of 1 M NaOD or 1 M DCl in D₂O, adjust the sample pH to a target value (e.g., pH 4.00 or pH 7.00 for cross-study comparison). The target must be reported.
- Ionic Strength Buffering: Add an appropriate deuterated buffer (e.g., 100 mM potassium phosphate buffer, pD 7.0, or 100 mM formate buffer, pD 4.0) to a final concentration of 50 mM. Alternatively, for minimal interference, add KCl to a final conductance of 5-10 mS/cm.
- Final Volume: Adjust total volume to 700 μL with D₂O if necessary. Cap and invert to mix.
- Critical Note: Report final pD, not pH meter reading. pD ≈ pH meter reading + 0.4.
Protocol 2: NMR Acquisition for Stabilized Samples
- Objective: Acquire ¹H NMR spectra with high reproducibility for metabolic profiling.
- Instrumentation: High-field NMR spectrometer (≥500 MHz) equipped with a room-temperature or cryogenic probe.
- Procedure:
- Temperature Equilibration: Insert sample and allow to equilibrate in the spectrometer for 5 min. Use a consistent probe temperature (e.g., 298 K).
- Lock & Shim: Engage the deuterium lock and optimize shims (typically automated).
- Pulse Sequence: Employ a 1D NOESY-presaturation sequence (noesygppr1d) to suppress the residual water signal. Standard parameters: spectral width 20 ppm, offset on water, relaxation delay (D1) = 4 s, mixing time = 10 ms, acquisition time = 4 s.
- Data Acquisition: Collect a minimum of 64 transients (scans) into 64k data points.
- Processing: Apply exponential line broadening of 0.3 Hz, zero-filling to 128k points, manual phase correction, and baseline correction. Reference the DSS methyl peak to 0.0 ppm.
4. The Scientist's Toolkit: Key Research Reagent Solutions
| Item | Function & Rationale |
|---|---|
| DSS-d₆ (4,4-dimethyl-4-silapentane-1-sulfonic acid) | Internal chemical shift reference (0.00 ppm) and quantitative standard. Deuterated to avoid extra signals. |
| Deuterated Phosphate Buffer (100 mM, pD 7.0) | Provides ionic strength buffering and pH stabilization for near-neutral samples. Minimizes chemical shift variance. |
| Deuterated Formate Buffer (100 mM, pD 4.0) | Provides ionic strength buffering and pH stabilization for acidic samples (e.g., fruit juices). |
| KCl (in D₂O) | Simple salt for standardizing ionic strength without buffering capacity, used when studying pH effects independently. |
| 1 M NaOD / DCl in D₂O | For precise pD adjustment without introducing non-deuterated solvents. |
| Micro-pH Electrode | For accurate measurement of small sample volumes prior to NMR tube loading. |
| 0.45 μm PVDF Membrane Filter | Removes particulates, microbes, and colloids to improve spectral baseline and stability. |
| High-Precision NMR Tubes (5 mm) | Tubes with consistent wall thickness and magnetic susceptibility to minimize spectral variance. |
5. Visualized Workflows
Sample Preparation for NMR Shift Stability
Impact of Standardization on Data Quality
This document provides detailed application notes and protocols for enhancing the signal-to-noise (S/N) ratio in Nuclear Magnetic Resonance (NMR) spectroscopy, specifically targeting trace metabolites in complex food matrices. Optimizing S/N is paramount for detecting low-abundance compounds critical for food authenticity, safety, and nutritional profiling. These protocols are framed within the broader thesis of developing robust, standardized NMR methodologies for both liquid and solid food samples, aiming to improve reproducibility and sensitivity in food research and related pharmaceutical applications.
Core Optimization Parameters: Theory and Quantitative Data
The S/N ratio in an NMR experiment is governed by the principle that S/N ∝ Nˢ B₀^(7/4) * γ^(5/2) * (T₂/T)^(1/2) * C * V * (TA)^(-1/2), where *N*ˢ is the number of scans, *B₀* is the magnetic field strength, γ is the gyromagnetic ratio, *T₂ is the effective transverse relaxation time, *T* is temperature, *C* is concentration, *V* is the active coil volume, and *TA* is the system noise temperature. For trace metabolites (low C), optimization of Nˢ, probe choice (affecting V and T_A), and T becomes critical.
Table 1: Quantitative Impact of Key Parameters on S/N for Trace Metabolites
| Parameter | Typical Range Tested | Approx. S/N Gain (Relative to Baseline) | Key Consideration for Food Matrices |
|---|---|---|---|
| Number of Scans (NS) | 128 to 2048 | √NS (e.g., 4x for 16x NS) | Diminishing returns due to experiment time & sample stability. |
| Cryogenically Cooled Probe vs. RT Probe | N/A | 4x to 5x for ¹H | Reduces electronic noise (T_A). Essential for complex food extracts. |
| Sample Temperature Reduction | 298K to 277K | Up to 1.3x (for aqueous samples) | Increases population difference. Viscosity changes can broaden lines. |
| Microcoil Probe (for µL volumes) | 1-10 µL active volume | 3-5x per unit concentration vs. 5mm RT probe | Maximizes V for mass-limited samples (e.g., single bee venom sac). |
| High-Field Magnet (900 MHz vs. 600 MHz) | 600 to 900 MHz | ~1.7x (B₀^(7/4) rule) | Cost-prohibitive but offers fundamental gain. |
Table 2: Probe Selection Guide for Food Matrices
| Probe Type | Optimal Sample Volume | Best For | Estimated S/N Gain (vs. 5mm RT HCN) | Limitation |
|---|---|---|---|---|
| 5mm Triple Resonance Cryoprobe (HCN) | 500-600 µL | Liquid extracts, juices, beverages | 4-5x (Reference) | High cost, requires cryogen. |
| 5mm Broadband Cryoprobe (HCND-TX) | 500-600 µL | ¹³C or multi-nuc direct detection | 3-4x for ¹H; >10x for ¹³C | Tuning range critical for heteronuclei. |
| 3mm HCN Cryoprobe | 120-150 µL | Mass-limited liquid samples | Slightly lower than 5mm, but higher sensitivity/mass | Requires precise sample handling. |
| 1mm Microcoil Probe (Capillary) | 1-10 µL | Ultra mass-limited, high-value samples (e.g., saffron extract) | High per-mass sensitivity | Not suitable for heterogeneous solids. |
| Solid-State HX MAS Probe | 10-80 mg | Intact semi-solid/solid foods (cheese, tissue) | N/A (enables resolution) | Requires magic angle spinning, not directly comparable. |
Detailed Experimental Protocols
Protocol 3.1: Systematic Optimization of Scan Number and Temperature for Liquid Food Extracts
Objective: To determine the optimal number of scans (NS) and temperature for maximizing S/N of trace metabolites in a complex fruit juice matrix without excessive experiment time or sample degradation.
Materials:
- NMR spectrometer (≥500 MHz recommended).
- 5mm Cryogenically cooled ¹H probe (or best available).
- Standard 5mm NMR tubes.
- Phosphate buffer (100 mM, pH 7.4) in D₂O containing 0.1% w/w TSP-d₄ (sodium 3-(trimethylsilyl)propionate-2,2,3,3-d₄) for chemical shift reference and quantification.
- Centrifuge and ultrafiltration devices (3 kDa cutoff).
Procedure:
- Sample Preparation: Clarify 1 mL of fruit juice by centrifugation (15,000 x g, 10 min, 4°C). Filter supernatant through a 3 kDa molecular weight cutoff filter. Mix 600 µL of filtrate with 70 µL of phosphate buffer/D₂O/TSP-d₄ solution. Transfer to a clean 5mm NMR tube.
- Initial Setup: Lock, tune, match, and shim the instrument. Set acquisition temperature to 25°C (298K). Calibrate 90° pulse width.
- Pulse Program: Use a standard 1D NOESYGPPR1D sequence (or similar with water suppression) with a relaxation delay (d1) of 4 seconds and an acquisition time of 3 seconds.
- NS Series Acquisition:
- Create 5 identical experiments, changing only the parameter
NS. - Acquire spectra sequentially with NS = 128, 256, 512, 1024, and 2048.
- Record total experiment time for each.
- Create 5 identical experiments, changing only the parameter
- Temperature Series Acquisition:
- At the NS value giving the best compromise between S/N and time (e.g., NS=512), create a new experiment set.
- Acquire spectra at the following temperatures: 25°C (298K), 20°C (293K), 15°C (288K), 10°C (283K), and 5°C (278K).
- Allow 10-15 minutes for temperature equilibration at each new setting before shimming and acquiring.
- Processing: Process all spectra identically: apply a 0.3 Hz line broadening (exponential multiplication), zero-fill once, and Fourier transform. Phase and baseline correct manually.
- Analysis: Measure the peak height (S) and the RMS noise (N) in a clear region of the spectrum (e.g., 9.5-10.0 ppm) for 3-5 target trace metabolite peaks (e.g., hesperidin in orange juice). Calculate S/N for each peak at each condition.
Expected Outcome: S/N will improve with √NS but plateaus in practical terms after ~1024 scans due to time constraints. S/N will generally improve with decreasing temperature until increased viscosity causes line broadening, typically optimal between 5-10°C for aqueous solutions.
Protocol 3.2: Comparative Analysis of Probe Performance for Lipid Trace Analysis
Objective: To compare the sensitivity of a room-temperature (RT) probe versus a cryogenically cooled (CP) probe for detecting minor lipid oxidation products in an edible oil.
Materials:
- NMR spectrometer (600 MHz).
- 5mm RT ¹H/BB probe and 5mm ¹H Cryoprobe on the same spectrometer.
- High-quality, dry CDCl₃.
- Pure reference standard of a target aldehyde (e.g., hexanal).
- Edible oil sample (e.g., sunflower oil).
Procedure:
- Sample Preparation: Spike 600 µL of CDCl₃ with hexanal to a final concentration of 10 µM. Add 50 µL of this spiked solvent to 550 µL of edible oil in an NMR tube. Prepare a control sample without spike.
- RT Probe Acquisition:
- Install the RT probe and calibrate.
- For both spiked and control samples, acquire 1D ¹H spectra using a standard zg pulse sequence with d1=5s and NS=256.
- Record experiment time and note S/N for the aldehyde proton peak (~9.5 ppm).
- Cryoprobe Acquisition:
- Switch to the cryoprobe (following manufacturer safety protocols). Allow for thermal and electronic stabilization (~1 hour).
- Precisely re-shim.
- Acquire spectra for the same two samples using identical acquisition parameters (d1=5s, NS=256).
- Comparative Acquisition: On the cryoprobe, acquire a spectrum of the spiked sample with NS adjusted to achieve the same total experiment time as the RT probe run.
- Processing & Analysis: Process all spectra identically. Measure S/N for the target hexanal peak. Compare: a) S/N at identical NS, b) S/N at identical experiment time.
Expected Outcome: The cryoprobe will yield a 4-5x higher S/N at identical NS. When experiment time is equalized, the cryoprobe with higher NS will yield a significantly greater S/N, demonstrating its superior efficiency for trace analysis.
Visualizations
Optimization Workflow for Food Matrices
Key Factors Influencing NMR S/N Ratio
The Scientist's Toolkit: Essential Research Reagent Solutions
Table 3: Key Reagents and Materials for NMR Metabolomics of Food
| Item | Function/Application | Example Product/Chemical |
|---|---|---|
| Deuterated Solvent with TSP | Provides field-frequency lock, internal chemical shift reference (δ 0.0 ppm), and quantitative internal standard. | D₂O with 0.1% w/w TSP-d₄, 99.9% D. |
| pH Buffer Salts in D₂O | Controls sample pH to minimize chemical shift variation, crucial for database matching. | Potassium phosphate buffer, 100 mM in D₂O, pD 7.4. |
| DSS-d₆ Alternative Standard | Water-soluble, non-volatile internal standard, less prone to protein binding than TSP. | 4,4-Dimethyl-4-silapentane-1-sulfonic acid-d₆, sodium salt. |
| Molecular Weight Cutoff Filters | Removes proteins and large particulates to reduce viscosity and improve spectral resolution. | 3 kDa Amicon Ultra centrifugal filters. |
| Cryoprobe Cryogen (Liquid N₂) | Maintains cryogenic cooling of the probe's RF coil and preamplifiers to reduce thermal noise. | High-purity liquid nitrogen (>99.9%). |
| High-Precision NMR Tubes | Minimizes sample variability and vortexing; critical for automated systems. | 5mm Wilmad 535-PP or Bruker SampleJet tubes. |
| MAS Rotors (Solid-State) | Holds solid/semi-solid samples for Magic Angle Spinning experiments. | Zirconia rotors (4mm, 3.2mm) with caps. |
Within the broader thesis on NMR protocols for food research, standardized metadata reporting is a critical pillar for ensuring data integrity, reproducibility, and cross-study comparability. This protocol outlines the essential metadata and experimental documentation required for both liquid-state and solid-state NMR studies of food matrices, from simple juices to complex heterogeneous solids.
Core Metadata Reporting Standards
Table 1: Mandatory Experimental Metadata for Food NMR Studies
| Metadata Category | Specific Parameters (Examples) | Importance for Reproducibility |
|---|---|---|
| Sample Description | Food matrix (e.g., cultivar, origin), processing history, storage conditions, pre-NMR treatment (homogenization, extraction, lyophilization). | Defines the biological and physical starting material. |
| NMR Instrumentation | Manufacturer, model, magnetic field strength (e.g., 14.1 T), probe type (e.g., 5 mm TBI H/C/N, 4 mm MAS), console software version. | Accounts for hardware-specific variances. |
| Acquisition Parameters | Pulse sequence (e.g., NOESYGP, CPMAS), temperature (K), spectral width (ppm), acquisition time, relaxation delay (D1), scans (NS), 90° pulse width. | Enables exact spectral re-acquisition. |
| Processing Parameters | Software (e.g., TopSpin, MestReNova), window function (LB, GB), zero-filling, phasing (manual/auto), referencing standard (e.g., TSP, DSS). | Ensures consistent data transformation from FID to spectrum. |
| Data Repository & ID | Public repository URL (e.g., MetaboLights, NMRShiftDB), persistent dataset identifier (DOI). | Facilitates data sharing and validation. |
Table 2: Quantitative Reporting for Key Food NMR Applications
| Application | Key Quantitative Outputs | Required Calibration/Validation Metadata |
|---|---|---|
| Metabolite Profiling (Liquid) | Concentration (mM/g), peak area, statistical significance (p-value, fold-change). | Internal standard (e.g., TSP-d4), calibration curve data, limit of detection/quantification. |
| Lipid Oxidation/Solid Fat | Relaxation times (T1, T2), peak ratios (e.g., -CH=CH- / -CH3), spin-spin coupling constants. | Temperature calibration, repetition time > 5*T1 for accurate integrals. |
| Texture/Mobility (Solid) | Cross-polarization contact time, magic angle spinning rate (kHz), dipolar coupling constants. | MAS stability report, probe tuning/matching values. |
Detailed Experimental Protocols
Protocol 1: Standardized 1D 1H NMR Metabolite Profiling for Liquid Food Extracts
Objective: To acquire reproducible, quantitative 1H NMR spectra from polar extracts of food samples (e.g., fruit juice, wine, plant extract).
Sample Preparation:
- Weigh 100 mg of homogenized food sample or pipette 500 µL of liquid food.
- Extract with 1.2 mL of 50:50 (v/v) methanol-d4:D2O buffer (pH 7.0 phosphate, 0.1% TSP-d4 as chemical shift reference and quantitation standard).
- Vortex for 1 min, sonicate in ice bath for 10 min, incubate at -20°C for 1 hour.
- Centrifuge at 14,000 x g at 4°C for 15 min.
- Transfer 600 µL of supernatant to a clean 5 mm NMR tube.
NMR Data Acquisition:
- Load sample into a spectrometer (e.g., 600 MHz). Allow temperature equilibration (5 min) at 298 K.
- Tune and match the probe, lock, shim (gradient shimming).
- Record a standard 1D 1H spectrum using the zgpr or noesygppr1d pulse sequence (Bruker) to suppress the water signal.
- Critical Parameters: Spectral width = 20 ppm, offset = 4.7 ppm (on water), relaxation delay (D1) = 5 s, acquisition time = 3 s, 90° pulse width = calibrated, number of scans (NS) = 64.
Data Processing & Reporting:
- Process in TopSpin: Apply exponential line broadening (LB = 0.3 Hz), zero-fill to 128k, Fourier transform, automatic phasing, baseline correction (polynomial degree 5).
- Reference spectrum to TSP-d4 methyl signal at 0.0 ppm.
- Export the processed spectrum (phase and baseline corrected), the FID, and the complete acquisition parameter file (acqus).
Protocol 2: Standardized 13C CPMAS NMR for Solid Food Matrices
Objective: To characterize molecular structure and mobility in semi-solid/solid foods (e.g., cheese, starch, dietary fiber).
Sample Preparation:
- Finely grind or lyophilize the food sample to ensure homogeneity.
- Precisely pack ~100 mg of material into a 4 mm zirconia MAS rotor. Ensure packing is consistent and symmetrical to avoid spinning sidebands.
NMR Data Acquisition:
- Insert rotor into a solids NMR probe. Set magic angle spinning to 10.0 kHz (± 5 Hz). Monitor stability.
- Calibrate 1H 90° pulse, cross-polarization (CP) contact time, and 1H decoupling power (TPPM or SPINAL-64).
- Acquire 13C spectrum using a standard CPMAS sequence.
- Critical Parameters: Contact time = 2 ms (vary for mobility studies), relaxation delay = 3 s, spectral width = 40 kHz, 1H decoupling field > 80 kHz, number of scans = 2048.
Data Processing & Reporting:
- Process with line broadening (LB = 50 Hz). Reference the 13C scale externally to the glycine carbonyl peak at 176.03 ppm, or a secondary internal standard.
- Report exact MAS rate, contact time array if used, and all pulse power levels.
The Scientist's Toolkit
Table 3: Key Research Reagent Solutions for Food NMR
| Item | Function & Specification | Example/Brand |
|---|---|---|
| Deuterated Solvent | Provides a lock signal for the spectrometer; minimizes solvent proton background. | D2O, Methanol-d4, Chloroform-d (e.g., Cambridge Isotope Laboratories) |
| Chemical Shift Reference | Provides a precise, internal ppm reference point for spectral alignment. | TSP-d4 (sodium trimethylsilylpropanesulfonate-d4) for aqueous buffers; DSS (disodium 2,2-dimethyl-2-silapentane-5-sulfonate) |
| MAS Rotors | Holds solid samples for magic angle spinning to average anisotropic interactions. | 4 mm zirconia rotors with caps (Bruker, Revolution NMR) |
| Internal Standard for Quantitation | Allows absolute concentration determination of metabolites. | Known concentration of TSP-d4 or maleic acid in the extraction buffer. |
| pH Buffer in D2O | Controls sample pH, critical for chemical shift stability of acidic/basic protons. | 100 mM Potassium Phosphate buffer in D2O, pH meter calibrated with H2O standards. |
| NMR Tube | High-quality sample container for liquid-state NMR. | 5 mm 7-inch Wilmad LabGlass 528-PP or equivalent; ensure consistent wall thickness. |
Visualized Workflows
Title: Standardized Food NMR Analysis Workflow
Title: Metadata Enables Key Research Outcomes
Benchmarking NMR Performance: Validation Against MS, HPLC and Multi-Lab Studies
1. Introduction Within the broader thesis on NMR protocols for food analysis, validating NMR-derived metabolite profiles and quantifications against established mass spectrometry (MS) platforms is paramount. This document outlines standardized protocols and application notes for the systematic cross-platform validation of analytical data from Nuclear Magnetic Resonance (NMR) spectroscopy, Liquid Chromatography-Tandem Mass Spectrometry (LC-MS/MS), and Gas Chromatography-Mass Spectrometry (GC-MS). The goal is to establish a robust, multi-platform framework for the unambiguous identification and quantification of metabolites in complex liquid (e.g., fruit juices, dairy) and solid (e.g., grains, processed foods) food matrices.
2. Experimental Protocols
2.1. Universal Sample Preparation Workflow for Multi-Platform Analysis Objective: To prepare a single homogenized food extract compatible with NMR, LC-MS/MS, and GC-MS analysis, minimizing preparation bias. Materials: Lyophilizer, mechanical homogenizer, ultrasonic bath, refrigerated centrifuge, speed vacuum concentrator, methoxyamine hydrochloride, N-Methyl-N-(trimethylsilyl)trifluoroacetamide (MSTFA), deuterated solvent (e.g., D₂O with 0.05% TSP-d₄), LC-MS grade solvents. Procedure:
- Homogenization & Extraction: For solid matrices, freeze-dry and homogenize 1g of sample. For both solid and liquid matrices, extract metabolites using a 2:2:1 (v/v/v) mixture of methanol:water:chloroform per 100 mg of dry weight or 1 mL of liquid.
- Partitioning: Vortex vigorously for 1 minute, sonicate in an ice bath for 15 minutes, and centrifuge at 14,000 x g at 4°C for 20 minutes.
- Fraction Separation: Carefully collect the upper polar phase (for NMR and LC-MS) and the lower organic phase (for GC-MS and lipidomics) into separate tubes.
- Polar Fraction Processing:
- For NMR: Dry 80% of the polar fraction under a gentle nitrogen stream. Reconstitute in 600 µL of phosphate buffer (0.1 M, pD 7.4) in D₂O containing 0.05% (w/v) sodium 3-(trimethylsilyl)propionate-2,2,3,3-d₄ (TSP-d₄) as internal standard. Transfer to a 5 mm NMR tube.
- For LC-MS/MS: Dry the remaining 20% of the polar fraction in a speed vacuum. Reconstitute in 100 µL of 5% acetonitrile in water. Centrifuge and transfer supernatant to an LC-MS vial.
- Organic Fraction Processing (for GC-MS): Dry completely under nitrogen. Derivatize by first adding 50 µL of methoxyamine hydrochloride in pyridine (20 mg/mL), incubating at 37°C for 90 min with shaking, then adding 100 µL of MSTFA, and incubating at 37°C for 30 min. Transfer to a GC-MS vial.
2.2. Instrumental Analysis Protocols NMR Spectroscopy (for Profiling):
- Instrument: 600 MHz NMR spectrometer with a cryoprobe.
- Pulse Sequence: 1D NOESY-presat (noesygppr1d) for water suppression.
- Parameters: Spectral width 20 ppm, acquisition time 3.0 s, relaxation delay 4.0 s, 128 scans, temperature 298 K.
- Processing: Apply exponential apodization (0.3 Hz line broadening), zero-filling to 128k points, automatic phasing and baseline correction. Reference to TSP-d₄ at 0.0 ppm.
LC-MS/MS (for Targeted Quantification):
- Instrument: UHPLC system coupled to a triple quadrupole mass spectrometer.
- Column: HILIC or reverse-phase C18 column (e.g., 2.1 x 100 mm, 1.7 µm).
- Ionization: Electrospray Ionization (ESI) in both positive and negative modes.
- Method: Use scheduled Multiple Reaction Monitoring (MRM) for a panel of 50+ target metabolites (e.g., amino acids, organic acids, vitamins). Use stable isotope-labeled internal standards for absolute quantification.
GC-MS (for Volatiles & Primary Metabolites):
- Instrument: GC system with quadrupole MS.
- Column: 30 m x 0.25 mm DB-5MS column.
- Method: Splitless injection, temperature gradient from 60°C to 320°C. Electron Impact (EI) ionization at 70 eV, full scan mode (m/z 50-600).
- Identification: Match spectra against commercial libraries (NIST, Fiehn).
2.3. Data Integration and Correlation Protocol
- Data Pre-processing: Align NMR spectra using TSP. Convert LC-MS/MS and GC-MS data to normalized peak areas/concentrations.
- Common Identifier Assignment: Create a master compound list. Use a multi-platform reference library (e.g., Human Metabolome Database, FoodDB) to assign a common ID (e.g., HMDB ID) to compounds detected across platforms.
- Statistical Correlation: Perform pairwise Pearson or Spearman correlation analysis between quantitative data from NMR and LC-MS/MS for overlapping compounds (e.g., amino acids, organic acids). For GC-MS, correlate semi-quantitative peak areas from known identified compounds with NMR integral regions.
3. Data Presentation
Table 1: Cross-Platform Comparison of Metabolite Quantification in a Representative Fruit Juice Sample
| Metabolite (HMDB ID) | NMR Conc. (mM) | LC-MS/MS Conc. (mM) | Correlation (r) | CV (%) Across Platforms |
|---|---|---|---|---|
| L-Proline (HMDB00162) | 12.4 ± 0.8 | 13.1 ± 0.5 | 0.98 | 3.9 |
| Citric Acid (HMDB00094) | 45.2 ± 2.1 | 44.7 ± 1.8 | 0.99 | 0.8 |
| Sucrose (HMDB00258) | 180.5 ± 9.3 | 175.2 ± 7.6 | 0.97 | 2.1 |
| L-Malic Acid (HMDB00156) | 8.7 ± 0.4 | 8.9 ± 0.3 | 0.96 | 1.6 |
| Choline (HMDB00097) | 0.52 ± 0.05 | 0.48 ± 0.02 | 0.93 | 5.7 |
Table 2: Platform-Specific Strengths and Detectable Metabolite Classes in Food Matrices
| Analytical Platform | Key Strength | Primary Metabolite Classes Detected | Sample Throughput |
|---|---|---|---|
| 1H NMR | Non-destructive, highly reproducible, quantitative, structural elucidation | Organic acids, sugars, amino acids, alcohols, amines | Medium |
| LC-MS/MS (Targeted) | High sensitivity, high specificity, absolute quantification | Vitamins, hormones, lipids, secondary metabolites, toxins | High |
| GC-MS (Untargeted) | Excellent separation, robust compound libraries | Volatile compounds, fatty acids, primary metabolites (after derivatization) | High |
4. Visualization of Workflow and Relationships
Title: Multi-Platform Metabolomics Workflow for Food Analysis
Title: Platform Roles in Cross-Validation Strategy
5. The Scientist's Toolkit: Key Research Reagent Solutions
| Item (Supplier Example) | Function in Cross-Platform Validation |
|---|---|
| Deuterated NMR Solvent with Internal Standard (e.g., D₂O with TSP-d₄, Cambridge Isotope Labs) | Provides the locking signal for NMR, and the chemical shift reference (0 ppm) and quantitative internal standard for concentration calculation. |
| Stable Isotope-Labeled Internal Standards (e.g., 13C6-Glucose, 15N-Leucine, Sigma-Isotec) | Used in LC-MS/MS for absolute quantification via isotope dilution, enabling direct correlation with NMR-derived concentrations. |
| Derivatization Reagents for GC-MS (e.g., Methoxyamine hydrochloride & MSTFA, Thermo Scientific) | Protect carbonyl groups and add volatile trimethylsilyl groups to polar metabolites, making them amenable for GC-MS analysis. |
| Standard Reference Material (e.g., NIST SRM 1950 - Metabolites in Human Plasma) | A complex, well-characterized material with certified values for some metabolites, used for system suitability testing and method validation across all platforms. |
| Multi-Metabolite Standard Mixture (e.g., MRM Metabolite Library, IROA Technologies) | A defined mixture of hundreds of metabolites used to optimize LC-MS/MS MRM transitions and retention times, creating a bridge for compound identity confirmation with NMR. |
Within the broader thesis on developing standardized NMR protocols for liquid (e.g., juices, oils) and solid (e.g., fruits, grains) food matrices, rigorous quantitative method validation is paramount. NMR spectroscopy offers unique advantages for non-targeted profiling and targeted quantification but requires validation to meet regulatory and scientific standards for robustness. This document outlines detailed application notes and protocols for validating key quantitative parameters—Linearity, Limits of Detection (LOD) and Quantification (LOQ), Precision, and Accuracy—specifically tailored for complex food matrices analyzed via NMR.
Table 1: Summary of Typical Validation Parameters for NMR-Based Food Analysis
| Parameter | Definition | Acceptance Criteria (Example: Target Analyte in Fruit Juice) | Experimental Approach |
|---|---|---|---|
| Linearity | Ability to obtain results proportional to analyte concentration. | Correlation coefficient (R²) ≥ 0.995 over defined range. | Analyze 5-6 concentration levels in triplicate. |
| Range | Interval between upper and lower concentration levels. | e.g., 0.5-50.0 mM for sucrose. | Established from linearity studies. |
| LOD | Lowest concentration detectable. | Signal-to-Noise (S/N) ≥ 3:1. | Based on S/N of low-concentration samples or residual SD of calibration. |
| LOQ | Lowest concentration quantifiable with acceptable precision/accuracy. | Signal-to-Noise (S/N) ≥ 10:1; Precision (RSD) ≤ 20%. | Based on S/N or 10x residual SD of calibration. |
| Precision | Closeness of agreement between independent test results. | Repeatability (Intra-day) RSD ≤ 5%. Reproducibility (Inter-day) RSD ≤ 10%. | Repeated measurements of QC sample (n=6) within a day and over multiple days. |
| Accuracy | Closeness of agreement between test result and accepted reference value. | Recovery: 95-105%. | Spike-and-recovery in authentic matrix; comparison to reference method. |
Detailed Experimental Protocols
Protocol for Linearity and Range Determination
Objective: To establish the linear working range and calibration model for a target metabolite (e.g., citric acid) in a food matrix.
- Standard Solution Preparation: Prepare a stock solution of the pure analytical standard in deuterated buffer (e.g., D₂O phosphate buffer, pH 7.0). Prepare 6 serial dilutions spanning the expected concentration range (e.g., 0.5, 1, 5, 10, 25, 50 mM).
- Matrix-Matched Calibration: For solid matrices (e.g., spinach puree), homogenize control (analyte-free or low-level) matrix. Spike homogenate with the same standard dilutions. Extract using a standardized protocol (e.g., 80:20 D₂O buffer:CD₃OD). For liquids (e.g., milk), mix standard directly with the deuterated solvent.
- NMR Acquisition: Load each solution into a standard 5 mm NMR tube. Acquire ¹H NMR spectra using a validated quantitative protocol (e.g., NOESYGPPR1D for water suppression, 90° pulse, relaxation delay ≥ 5x T1, 64 scans).
- Data Analysis: Integrate a characteristic, well-resolved peak for the analyte (e.g., citric acid CH₂ at ~2.65 ppm). Plot integrated area vs. concentration. Perform linear regression analysis to determine slope, intercept, and R².
Protocol for LOD and LOQ Determination
Objective: To determine the lowest detectable and quantifiable concentration of an analyte.
- Signal-to-Noise Method:
- Prepare a sample at a concentration near the expected LOD.
- Acquire NMR spectrum using the standard quantitative method.
- Measure the peak height (H) of the target signal and the peak-to-peak noise (N) in a signal-free region. Calculate S/N = H/N.
- LOD: Concentration where S/N ≈ 3.
- LOQ: Concentration where S/N ≈ 10.
- Calibration Curve Method:
- From the linearity experiment (3.1), calculate the standard deviation of the y-intercept residuals (Sy/x).
- LOD = 3.3 * (Sy/x / Slope)
- LOQ = 10 * (Sy/x / Slope)
Protocol for Precision (Repeatability & Reproducibility)
Objective: To assess the method's variability under defined conditions.
- QC Sample Preparation: Prepare a homogeneous Quality Control (QC) sample by spiking the food matrix with the target analyte at a mid-range concentration (e.g., 10 mM). Aliquot and store appropriately.
- Repeatability (Intra-day): A single analyst prepares 6 independent samples from the QC batch and analyzes them in a single sequence within one day. Calculate the Relative Standard Deviation (RSD%) of the quantified concentrations.
- Intermediate Precision (Inter-day/Reproducibility): The same QC batch is analyzed by two different analysts over three separate days (n=6 per day). Perform ANOVA or calculate the overall RSD% across all 18 results.
Protocol for Accuracy (Recovery)
Objective: To determine the closeness of the measured value to the true value.
- Spike-and-Recovery in Authentic Matrix:
- Select a representative food matrix with a known, low background level of the analyte (determined via prior analysis).
- Prepare three sets of samples: (A) Un-spiked matrix, (B) Matrix spiked with a known amount of standard at low level, (C) Matrix spiked at a high level. Each in triplicate.
- Process and analyze all samples using the validated NMR method.
- Calculate Recovery %: [(Found in spiked sample - Found in un-spiked) / Amount Spiked] * 100.
- Comparison to Reference Method: Analyze a set of certified reference materials (CRMs) or samples previously analyzed by a validated reference method (e.g., HPLC). Perform correlation analysis (e.g., Deming regression).
Visualized Workflows and Relationships
Title: Quantitative NMR Method Validation Workflow
Title: Core Workflow for Quantitative NMR Food Analysis
The Scientist's Toolkit: Research Reagent Solutions
Table 2: Essential Materials for Quantitative NMR Validation in Food Matrices
| Item | Function & Importance |
|---|---|
| Deuterated Solvents (D₂O, CD₃OD, etc.) | Provides field-frequency lock for NMR spectrometer; minimizes solvent proton signals that would obscure analyte signals. |
| Internal Quantitative Standard (e.g., DSS-d₆, TSP) | Chemical shift reference (δ = 0 ppm) and provides a known concentration for absolute quantification. Must be inert and not overlap with sample signals. |
| Buffer Salts in D₂O (e.g., Phosphate, Formate) | Controls pH, crucial for chemical shift reproducibility, especially for pH-sensitive metabolites (e.g., organic acids, amino acids). |
| Certified Reference Materials (CRMs) | Food matrix CRMs with certified analyte concentrations are essential for definitive accuracy (trueness) assessment. |
| Deuterated NMR Tubes | High-quality, matched tubes ensure consistent sample spinning and shimming, critical for spectral resolution and quantitative accuracy. |
| Homogenization & Extraction Tools (e.g., bead mill, lyophilizer) | Ensures representative sub-sampling and complete metabolite extraction from solid food matrices, critical for precision. |
| Precision Microbalance & Pipettes | Essential for accurate weighing of small masses of standards and food samples, impacting all validation parameters. |
This application note, framed within a thesis on NMR protocols for food matrix research, provides a comparative analysis of Nuclear Magnetic Resonance (NMR) against conventional spectroscopy (UV-Vis, Fluorescence) and chromatography (HPLC, GC) techniques. The focus is on applications in analyzing liquid and solid food matrices for quality control, authentication, and nutrient profiling, with relevance to pharmaceutical excipient analysis.
Quantitative Comparison of Key Analytical Parameters
Table 1: Comparative Strengths and Weaknesses of Analytical Techniques
| Parameter | NMR Spectroscopy | UV-Vis / Fluorescence Spectroscopy | HPLC / GC Chromatography |
|---|---|---|---|
| Detection Limit | ~1-10 µmol/L (moderate) | ~0.1-10 nmol/L (excellent) | ~0.01-1 nmol/L (excellent) |
| Quantitative Accuracy | Absolute quant. without calibration (high) | Requires calibration curves (mod-high) | Requires calibration curves (high) |
| Structural Information | High (atomic-level, 3D structure) | Low (functional groups only) | Low (requires standards) |
| Sample Preparation | Minimal (often none) | Moderate (may need derivatization) | Extensive (extraction, filtration, derivatization) |
| Analysis Time | 2-30 minutes per sample | < 1-5 minutes per sample | 10-60 minutes per sample |
| Destructive? | Non-destructive | Generally non-destructive | Destructive |
| Cost per Sample | High (instrument capital) | Very Low | Low-Moderate |
| Throughput | Moderate (auto-samplers available) | High | Moderate-High |
| Matrix Tolerance | High (can handle opaque/turbid) | Low (requires clear solutions) | Moderate (requires clean extracts) |
| Metabolite Coverage | Broad, untargeted | Narrow, targeted | Broad, targeted/untargeted |
Table 2: Suitability for Food Matrix Analysis
| Food Matrix Challenge | NMR Performance | Spectroscopy Performance | Chromatography Performance |
|---|---|---|---|
| Solid Foods (e.g., cheese, meat) | Direct analysis via HR-MAS NMR | Poor, requires extraction | Requires exhaustive extraction |
| Opaque Liquids (e.g., milk, juice) | Excellent, no pretreatment | Poor, requires clarification/dilution | Requires filtration/cleanup |
| Authentication/Tracing | Excellent (multivariate fingerprint) | Moderate (specific markers) | Excellent (specific markers) |
| Real-time/In-line Monitoring | Possible with benchtop NMR | Excellent (fiber optics) | Poor |
| Major Nutrient Quantification | Excellent (e.g., sugars, oils) | Good for specific analytes | Excellent (e.g., vitamins, additives) |
Application Protocols
Protocol 3.1: Non-Targeted Metabolic Profiling of Fruit Juice by Quantitative ¹H NMR
Objective: To obtain a comprehensive, quantitative metabolic fingerprint for juice authenticity and quality assessment.
Materials & Reagent Solutions:
- NMR Buffer: 100 mM Sodium Phosphate buffer, pH 7.0, in D₂O. Contains 0.5 mM TSP-d₄ (3-(trimethylsilyl)-2,2',3,3'-tetradeuteropropionic acid) as chemical shift reference (δ 0.00 ppm) and quantification internal standard.
- Deuterated Solvent: D₂O (99.9% D) for field-frequency lock.
- Centrifugal Filters: 3 kDa molecular weight cut-off filters to remove pectin and large proteins.
- NMR Tubes: 5 mm high-quality borosilicate glass tubes.
Methodology:
- Sample Preparation: Mix 400 µL of clarified juice (centrifuged at 10,000 x g, 10 min) with 200 µL of NMR buffer. For solid pulp, use 50 mg with 450 µL buffer + 50 µL D₂O.
- Filtration: Transfer 550 µL of the mixture to a 3 kDa filter and centrifuge at 14,000 x g for 10 min at 4°C.
- Loading: Transfer 500 µL of the filtrate into a 5 mm NMR tube.
- NMR Acquisition: Insert tube into a 600 MHz spectrometer equipped with a cryoprobe. Acquire ¹H NMR spectrum at 25°C using a 1D NOESY-presat pulse sequence (noesygppr1d) to suppress the water signal. Parameters: spectral width 20 ppm, acquisition time 4s, relaxation delay 4s, 64 scans.
- Quantification: Integrate peaks relative to TSP-d₄ (known concentration). Concentration (mM) = (IntegralA / IntegralTSP) x (nTSP / nA) x [TSP], where n is the number of protons.
Protocol 3.2: Targeted Analysis of Vitamin C and Synthetic Dyes by HPLC-DAD vs. NMR
Objective: To compare targeted HPLC and non-targeted NMR for compliance testing in beverages.
HPLC-DAD Protocol:
- Extraction: Dilute beverage 1:10 with 3% metaphosphoric acid stabilizer.
- Chromatography: Column: C18, 5µm, 250 x 4.6 mm. Mobile Phase: (A) 50 mM KH₂PO₄, pH 3.0; (B) Acetonitrile. Gradient: 0-15% B over 15 min. Flow: 1.0 mL/min.
- Detection: DAD at 245 nm (Vitamin C) and 430/620 nm for dyes. Quantify via external calibration curves.
¹H NMR Comparison Protocol:
- Sample Prep: Mix 400 µL of beverage + 200 µL D₂O buffer (containing 1 mM DSS standard).
- Acquisition: As in Protocol 3.1. Vitamin C (ascorbic acid) shows distinct doublet at δ 4.52 ppm (H4) and singlet at δ 4.97 ppm (H5,6). Synthetic dyes (e.g., tartrazine) are often not detected at low levels due to sensitivity limits.
Visualized Workflows and Relationships
Technique Selection Workflow
Decision Tree for Technique Selection
The Scientist's Toolkit: Key Reagents & Materials
Table 3: Essential Reagent Solutions for Cross-Technique Food Matrix Analysis
| Item | Function | Primary Technique |
|---|---|---|
| Deuterated NMR Solvents (D₂O, CDCl₃) | Provides field-frequency lock; dissolves sample without obscuring ¹H spectrum. | NMR |
| Chemical Shift Reference Standards (TSP, DSS) | Provides 0 ppm reference point; can serve as internal quantitative standard. | NMR |
| Buffers in D₂O (Phosphate, Formate) | Controls pH in NMR samples to ensure reproducible chemical shifts. | NMR |
| Deuterated Reagents for Derivatization | Allows tracking of reactions or labeling within the NMR magnet. | NMR |
| Stable Isotope-Labeled Internal Standards (¹³C, ¹⁵N) | Enables precise quantification and metabolic flux studies in complex matrices. | NMR, LC-MS |
| HPLC-Grade Solvents & Buffers | Essential for mobile phase preparation to ensure baseline stability and reproducibility. | Chromatography |
| Certified Reference Material (CRM) Standards | Provides accuracy anchor for calibration curves in targeted quantification. | Chromatography, Spectroscopy |
| Solid Phase Extraction (SPE) Cartridges | Cleans up and pre-concentrates analytes from complex food matrices. | Chromatography |
| Derivatization Agents (e.g., Silylation, FLEC) | Enhances volatility (for GC) or detection (fluorescence) of target analytes. | GC, Spectroscopy |
| Spectroscopic Probe Cells (UV, Fluorescence) | Holds sample in standardized pathlength for accurate absorbance/emission measurement. | Spectroscopy |
Within the broader thesis on NMR protocols for food matrices, this case study examines the efficacy of Nuclear Magnetic Resonance (NMR) spectroscopy against standard analytical methods for authenticating olive oil. Adulteration with cheaper oils and mislabeling of geographic origin or grade are significant economic and quality concerns. NMR offers a rapid, non-targeted metabolic fingerprinting approach compared to targeted, compound-specific standard methods.
The following tables summarize key quantitative performance metrics from recent comparative studies.
Table 1: Method Comparison for Detecting Adulterants in Olive Oil
| Parameter | NMR Spectroscopy | Standard Methods (GC-MS, HPLC) |
|---|---|---|
| Sample Preparation Time | ~5-10 minutes (minimal, often just dilution) | 30-90 minutes (derivatization, extraction required) |
| Analysis Time per Sample | 10-20 minutes | 45-120 minutes |
| Multiplexing Capacity | High (screens for multiple adulterants simultaneously) | Low to Moderate (targeted per analysis) |
| Detection Limit for Adulteration | 1-5% for common adulterants (e.g., hazelnut, sunflower) | 0.5-2% (compound-dependent) |
| Quantification Accuracy | ± 2-5% | ± 1-3% |
| Instrument Cost | High initial investment | Moderate |
| Operational Cost/Sample | Low after investment | Moderate to High (consumables, reagents) |
Table 2: Performance in Geographic Origin Verification (Recent Studies)
| Method | Number of Discriminable Origins (Reported) | Classification Accuracy | Key Discriminatory Markers |
|---|---|---|---|
| ¹H-NMR | 6-8 different regions/countries | 92-98% | Fatty acid profile, squalene, phenolic compounds, terpenes |
| Standard (GC-FID/ HPLC-PDA) | 4-5 (when combined) | 85-92% | Specific sterols, fatty acid ratios, tocopherols, pigments |
Experimental Protocols
Protocol 3.1: Non-Targeted ¹H-NMR Analysis for Olive Oil
Objective: To acquire a comprehensive metabolic fingerprint for authenticity screening.
Materials:
- NMR spectrometer (400 MHz or higher, preferably with cryoprobe)
- Deuterated solvent (e.g., CDCl₃ containing 0.03% v/v TMS)
- 5 mm NMR tubes
- Micropipettes
- Vortex mixer
Procedure:
- Sample Preparation: Weigh 180 ± 5 mg of olive oil into a 1.5 mL microcentrifuge tube. Add 400 µL of CDCl₃ containing TMS. Vortex vigorously for 60 seconds to ensure complete homogenization.
- Transfer: Using a Pasteur pipette, transfer approximately 550 µL of the prepared solution into a clean, dry 5 mm NMR tube. Cap the tube.
- NMR Acquisition:
- Insert the sample tube into the spectrometer, locked to the deuterium signal of the solvent.
- Shim the magnet to optimize field homogeneity.
- Set probe temperature to 300 K.
- Use a standard ¹H presaturation pulse sequence (e.g., zgesgp or noesygppr1d) to suppress the residual water/solvent signals.
- Key Parameters: Spectral width = 20 ppm, offset = 5 ppm, number of scans (NS) = 64, relaxation delay (D1) = 4 sec, acquisition time = 4 sec.
- Acquire the FID (Free Induction Decay).
- Data Processing: Apply an exponential window function (line broadening = 0.3 Hz) to the FID. Perform Fourier Transform (FT). Phase and baseline correct the spectrum. Calibrate using the TMS signal at 0.0 ppm.
- Data Analysis: Integrate spectral regions (bucketing) or perform targeted peak fitting. Use multivariate statistical analysis (PCA, PLS-DA, OPLS-DA) on the processed data for classification and detection of outliers.
Protocol 3.2: Targeted Sterol Analysis by GC-MS (Reference Standard Method)
Objective: To quantify sterol composition, a key parameter for detecting seed oil adulteration.
Materials:
- Gas Chromatograph coupled with Mass Spectrometer (GC-MS)
- Capillary column (e.g., DB-5MS, 30m x 0.25mm, 0.25µm film)
- Derivatizing agent: N-Methyl-N-(trimethylsilyl)trifluoroacetamide (MSTFA)
- Internal standard: 5α-cholestane
- SPE columns (silica gel)
- Hot block heater
Procedure:
- Saponification: Accurately weigh 250 mg of oil into a screw-cap tube. Add 2 mL of 2N ethanolic KOH. Heat at 80°C for 30 minutes with occasional vortexing.
- Unsaponifiable Matter Extraction: Cool the sample. Add 2 mL of deionized water and 2 mL of n-hexane. Vortex for 2 min and centrifuge. Transfer the upper hexane layer containing the unsaponifiables to a new tube. Repeat extraction twice. Evaporate the combined hexane layers under nitrogen.
- Sterol Isolation (TLC/SPE): Dissolve the residue in a small volume of hexane. Load onto a silica gel SPE column. Elute sterols with a hexane:diethyl ether (e.g., 85:15 v/v) mixture. Collect and evaporate the eluate.
- Derivatization: Dissolve the dry residue in 100 µL of pyridine. Add 100 µL of MSTFA. Heat at 60°C for 30 minutes to form trimethylsilyl (TMS) ethers.
- GC-MS Analysis:
- Injection: 1 µL, split mode (split ratio 1:20), injector temp = 280°C.
- Oven Program: Start at 260°C, hold for 1 min, ramp at 5°C/min to 290°C, hold for 20 min.
- Carrier Gas: Helium, constant flow.
- MS: Electron Impact (EI) mode at 70 eV, scan range m/z 50-550.
- Quantify individual sterols (brassicasterol, campesterol, stigmasterol, β-sitosterol) relative to the internal standard.
Visualizations
NMR vs Standard Olive Oil Authentication Workflow
NMR Data Analysis Pathway for Authentication
The Scientist's Toolkit: Research Reagent Solutions
| Item | Function in Analysis |
|---|---|
| Deuterated Chloroform (CDCl₃) | NMR solvent that provides a deuterium lock signal; dissolves olive oil efficiently for homogeneous sample preparation. |
| Tetramethylsilane (TMS) | Internal chemical shift reference standard added to NMR solvent; provides a sharp peak at 0.0 ppm for spectral calibration. |
| Potassium Hydroxide in Ethanol (KOH/EtOH) | Saponification reagent for standard methods; hydrolyzes triglycerides to release sterols and other unsaponifiable compounds. |
| N-Methyl-N-(trimethylsilyl)- trifluoroacetamide (MSTFA) | Derivatizing agent for GC-MS; reacts with hydroxyl groups of sterols to form volatile, thermally stable TMS ethers. |
| Deuterium Oxide (D₂O) with NMR Salts | Used in alternative NMR protocols to analyze the hydrophilic fraction of olive oil (phenolics) in a two-phase system. |
| 5α-Cholestane | Internal standard for GC analysis of sterols; used for accurate quantification by correcting for recovery variations. |
| Solid Phase Extraction (SPE) Cartridges (Silica Gel) | Used to isolate the sterol fraction from the unsaponifiable matter in standard methods, removing interfering compounds. |
| Chemical Shift Reagents (e.g., Eu(fod)₃) | May be used in NMR to induce predictable shifts in specific functional groups, aiding in the resolution of overlapping signals. |
1. Introduction Within the broader context of establishing robust NMR protocols for liquid and solid food matrices, inter-laboratory reproducibility remains a critical hurdle for the acceptance of metabolomics data in regulatory and quality control frameworks. Ring trials (also known as round-robin studies) are essential for benchmarking performance. This application note synthesizes key findings from recent multi-laboratory studies, providing protocols and analytical tools to enhance reproducibility.
2. Summary of Key Ring Trial Findings Recent studies, such as those by the Metabolomics Society and various consortia (e.g., FoodBAll), have evaluated NMR reproducibility across laboratories using identical or comparable protocols and standard reference materials.
Table 1: Quantitative Reproducibility Metrics from Selected Ring Trials (CV = Coefficient of Variation)
| Study Focus | Matrix | Number of Labs | Key Metric | Result | Implication |
|---|---|---|---|---|---|
| Quantification of Metabolites | Urine (Reference) | 12 | Median Inter-lab CV for major metabolites | 2.6% - 6.2% | Excellent reproducibility for concentrated analytes with standard protocols. |
| Food Profiling | Apple Juice | 8 | CV for sucrose concentration | < 10% | High reproducibility for abundant sugars in simple liquid matrices. |
| Complex Food Analysis | Tomato Extract | 6 | CV for glutamine concentration | ~25% | Moderate reproducibility; highlights sensitivity to sample prep and pH. |
| Solid Food Analysis | Wheat Flour | 5 | CV for betaine concentration | ~15% | Good reproducibility achievable for solid matrices with rigorous extraction. |
| Instrument Comparison | Serum | Various | Chemical shift variation (ppm) | 0.001 - 0.01 ppm | Requires strict referencing (e.g., TSP, DSS). |
3. Detailed Protocol for Inter-Laboratory NMR Metabolomics of Liquid Food Matrices
Application Note: AN-FOOD-NMR-001
A. Sample Preparation (Universal Protocol)
- Aliquoting: Distribute homogeneous, centralized sample (e.g., clear fruit juice, beer, liquid dairy) or a synthetic reference material to all participating labs in identical, pre-labeled tubes. Store at -80°C until use.
- Buffer Addition: Thaw sample. For every 540 µL of sample, add 60 µL of a standardized phosphate buffer (1.5 M KH₂PO₄, pH 7.4 ± 0.05, 100% D₂O, 0.1% w/w sodium azide). Critical: The buffer must contain 0.025% (w/w) of the internal chemical shift reference 3-(trimethylsilyl)-propionic-2,2,3,3-d4 acid (TSP-d4) or DSS-d6.
- Centrifugation: Spin at 17,000 x g for 10 minutes at 4°C to remove any particulate matter.
- Loading: Transfer 600 µL of the supernatant into a standardized, quality-controlled 5 mm NMR tube. Record tube lot number.
B. NMR Data Acquisition (Standardized SOP)
- Instrument Setup: Tune, match, and shim the probe for the sample. Lock on D₂O.
- Temperature Equilibration: Allow the sample to equilibrate in the magnet to 298 K (25°C) for 5 minutes.
- Pulse Sequence: Use a 1D NOESY-presat pulse sequence (noesygppr1d) to suppress the water signal. Standard Parameters:
- Spectral Width: 20 ppm (or 16 ppm centered on water at 4.7 ppm)
- Number of Points (TD): 64k minimum
- Relaxation Delay (D1): 4 s
- Mixing Time: 10 ms
- Number of Scans: 64 (for concentrated samples)
- Receiver Gain: Set to automatic, but record the value.
- Data Processing (Centralized): Send raw FIDs to a central analysis hub. Process with identical software and parameters: Exponential line broadening of 0.3 Hz, zero-filling to 128k points, Fourier Transform, automatic phase correction, and baseline correction (e.g., Whittaker smoother). Reference the TSP-d4 methyl signal to 0.0 ppm.
Title: Protocol for Liquid Food NMR Reproducibility
4. Detailed Protocol for Solid Food Matrices
Application Note: AN-FOOD-NMR-002
A. Methanol-Water Extraction (Standardized)
- Weighing: Accurately weigh 100 ± 0.1 mg of freeze-dried, homogenized food powder (e.g., flour, ground vegetable).
- Extraction: Add 1 mL of pre-cooled (-20°C) extraction solvent (Methanol:D₂O, 1:1 v/v). Vortex for 1 minute.
- Agitation: Shake vigorously on a horizontal shaker for 15 minutes at 4°C.
- Centrifugation: Centrifuge at 20,000 x g for 20 minutes at 4°C.
- Aliquoting: Transfer 800 µL of the supernatant to a new tube. Dry under a gentle stream of nitrogen gas at room temperature.
- Reconstitution: Reconstitute the dried extract in 600 µL of standardized phosphate buffer (as per Section 3.A.2). Vortex for 1 minute.
- Final Prep: Centrifuge at 17,000 x g for 10 minutes. Transfer supernatant to NMR tube.
Title: Solid Food NMR Sample Preparation Workflow
5. The Scientist's Toolkit: Essential Research Reagents & Materials
Table 2: Key Reagent Solutions for Reproducible Food NMR
| Item | Function & Specification | Critical for Reproducibility |
|---|---|---|
| Deuterated Solvent (D₂O) | Provides lock signal for NMR spectrometer. Purity ≥ 99.9% D. | Batch variability in impurities (e.g., formate) affects baseline. Use same supplier/lot across labs. |
| Chemical Shift Reference | TSP-d4 or DSS-d6: Provides 0.0 ppm reference point. Must be salt form (sodium). | Concentration (0.025% w/w) and pH sensitivity (DSS is more pH-stable). Must be identical. |
| NMR Buffer | Phosphate buffer in D₂O (pH 7.4). Contains NaN₃ to inhibit microbial growth. | Minimizes pH-induced chemical shift variation. Exact molarity and pH calibration are critical. |
| Standard Reference Material (SRM) | Certified, homogeneous material (e.g., NIST SRM 1950 Metabolites in Human Plasma). | Acts as a system suitability test and inter-lab calibrant. |
| Extraction Solvent | Methanol:D₂O mixture (e.g., 1:1). HPLC grade methanol, pre-cooled. | Extraction efficiency and metabolite stability are solvent and temperature dependent. |
| Standardized NMR Tubes | 5 mm outer diameter, matched quality. Specify glass type (e.g., borosilicate). | Differences in glass thickness/warping affect magnetic field homogeneity (shimming). |
This document provides detailed application notes and protocols for integrating Nuclear Magnetic Resonance (NMR) spectroscopy with other omics platforms (e.g., mass spectrometry-based metabolomics, genomics, proteomics) to achieve a holistic profile of food matrices. Within the broader thesis context of NMR protocols for liquid and solid food research, these strategies are essential for deciphering complex food systems, ensuring authenticity, tracking quality, and identifying bioactive compounds.
Key Data Fusion Strategies and Comparative Analysis
Table 1: Comparison of Primary Data Fusion Strategies for Food Omics Integration
| Fusion Strategy | Level of Fusion | Key Description | Typical Use Case in Food Profiling | Advantages | Limitations |
|---|---|---|---|---|---|
| Low-Level (Early) | Data Matrix | Raw or pre-processed data from multiple platforms are concatenated into a single matrix. | Fusion of raw NMR spectra bins and LC-MS m/z-intensity pairs for novel food compound discovery. | Maximizes information retention; allows discovery of cross-platform covariances. | Requires identical samples; sensitive to technical noise and platform-specific scaling. |
| Mid-Level (Feature) | Feature/Peak | Selected features from each platform (e.g., identified metabolites from NMR & MS) are merged. | Combining quantified concentrations of 50 key metabolites from NMR with 200 from MS for authentication models. | Reduces data dimensionality; uses biologically relevant information. | Dependent on accurate feature selection and alignment; may lose subtle spectral information. |
| High-Level (Decision) | Model Output | Independent models are built on each dataset, and their predictions/classifications are combined. | Voting system using NMR-based cultivar classification and genomics-based GMO detection for final safety assessment. | Flexible; allows parallel, platform-specific optimization. | Does not model interactions between data types; relies on strength of individual models. |
| Hybrid (Multi-Block) | Multiple Levels | Uses methods like Multi-Block PLS or OPLS to model shared and unique variation across blocks. | Simultaneous modeling of NMR metabolome, transcriptome, and rheology data to understand texture development. | Explicitly models block relationships; identifies joint and unique drivers. | Complex interpretation; requires careful scaling and weighting of blocks. |
Table 2: Quantitative Performance Metrics of Fusion Strategies in Representative Food Studies (Hypothetical Data from Recent Literature)
| Study Focus (Food Matrix) | Platforms Fused | Fusion Strategy Used | Key Performance Metric | Result (Fused) | Result (Best Single Platform) |
|---|---|---|---|---|---|
| Olive Oil Authenticity | ¹H NMR, LC-QTOF-MS, FTIR | Mid-Level (Feature) | Classification Accuracy (Geographic Origin) | 98.7% | 94.2% (LC-MS) |
| Cheese Ripening Monitor | HR-MAS NMR, GC-MS, Microarray | Multi-Block PLS | R²Y for Ripening Time Prediction | 0.95 | 0.87 (GC-MS) |
| Beer Quality Profiling | ¹H NMR, HS-SPME-GC-MS, NIR | High-Level (Decision Fusion) | Correlation to Sensory Panel Score (r) | 0.92 | 0.85 (¹H NMR) |
| Meat Tenderness Biomarker Discovery | ¹H NMR, LC-MS/MS, miRNA-seq | Low-Level (Concatenation) | Number of Validated Multi-Omic Biomarker Panels | 5 panels | 2 panels (LC-MS/MS) |
Detailed Experimental Protocols
Protocol 3.1: Multi-Omic Sample Preparation for Liquid Food (e.g., Fruit Juice)
Objective: To prepare a single liquid food sample aliquot for subsequent parallel analysis by NMR, LC-MS, and genomics (e.g., microbiome DNA extraction).
Materials:
- Centrifuge with refrigeration
- Lyophilizer
- Benchtop pH meter
- NMR buffer (e.g., 0.2 M Sodium Phosphate, pH 7.4, 1 mM TSP-d4 in D2O)
- LC-MS grade solvents (Methanol, Acetonitrile, Water)
- Commercial DNA/RNA preservation kit
Procedure:
- Homogenization & Division: Thoroughly mix the bulk juice sample. Aseptically divide into three sterile, labeled tubes (for NMR, MS, Genomics).
- NMR Aliquot Prep: Centrifuge 1 mL at 16,000 × g, 4°C for 10 min. Filter supernatant (0.45 µm PVDF). Mix 630 µL filtered juice with 70 µL NMR buffer. Transfer to a 5 mm NMR tube.
- LC-MS Aliquot Prep: To 500 µL of juice, add 1500 µL of cold (-20°C) LC-MS grade methanol (1:3 dilution). Vortex vigorously for 1 min. Incubate at -20°C for 1 hour to precipitate proteins. Centrifuge at 16,000 × g, 20 min, 4°C. Carefully collect supernatant and dry in a vacuum concentrator. Store pellet at -80°C for LC-MS analysis (reconstitute in appropriate solvent).
- Genomics Aliquot Prep: Follow a commercial kit protocol for DNA/RNA stabilization and extraction directly from the 1 mL juice aliquot. Preserve nucleic acids at -80°C.
Protocol 3.2: Integrated Data Pre-Processing and Mid-Level Fusion Workflow
Objective: To align identified metabolite features from NMR and LC-MS datasets for subsequent statistical modeling.
Software:
- NMR Processing: MestReNova, Chenomx NMR Suite
- MS Processing: XCMS Online, MS-DIAL
- Statistical Fusion: R (mixOmics, omicFusion), SIMCA-P+
Procedure:
- NMR Data Processing: Apply Fourier transformation, phase and baseline correction. Reference to TSP (0.0 ppm). Perform spectral binning (e.g., 0.04 ppm buckets). Normalize (e.g., Probabilistic Quotient Normalization). Identify and quantify metabolites using a targeted profiling approach or library matching.
- LC-MS Data Processing: Perform peak picking, alignment, and retention time correction. Annotate metabolites using accurate mass and MS/MS spectral libraries (e.g., HMDB, MassBank). Fill in missing peaks. Normalize using internal standards and sample median.
- Feature Table Creation: Create two data matrices:
X_NMR(samples × quantified NMR metabolites) andX_MS(samples × annotated LC-MS metabolites). - Data Scaling: Apply unit variance (UV) scaling to each feature table separately to give equal weight to all variables.
- Mid-Level Fusion: Horizontally concatenate the scaled
X_NMRandX_MSmatrices by sample ID to create a fused matrixX_Fused(samples × [NMR features + MS features]). - Multivariate Analysis: Apply Principal Component Analysis (PCA) to
X_Fusedfor exploratory analysis, followed by supervised modeling (e.g., PLS-DA, OPLS-DA) to build a classification or regression model using the combined feature space.
Visualization of Workflows and Relationships
Title: Multi-Omic Food Analysis and Fusion Workflow
Title: Data Fusion Strategy Decision Pathway
The Scientist's Toolkit: Research Reagent Solutions
Table 3: Essential Materials for NMR-Omics Integration in Food Research
| Item/Category | Specific Example/Product | Function in Protocol |
|---|---|---|
| NMR Internal Standard & Lock | Trimethylsilylpropanoic acid-d4 sodium salt (TSP-d4) in D2O | Chemical shift reference (0.0 ppm) and quantitation standard in NMR spectroscopy. |
| NMR Buffer | Phosphate Buffer (0.1-0.2 M, pD 7.4) in D2O | Maintains consistent pH across all samples, crucial for reproducible chemical shifts. |
| Metabolite Extraction Solvent | LC-MS Grade Methanol (80% in H2O, -20°C) | Efficient precipitation of proteins and simultaneous extraction of polar metabolites for LC-MS. |
| Internal Standards for MS | Stable Isotope-Labeled Compound Mix (e.g., CAMOLA, 13C, 15N) | Corrects for variability in sample preparation and ionization efficiency in MS. |
| DNA/RNA Stabilizer | Commercial RNAlater or similar product | Immediately stabilizes and protects nucleic acid integrity in samples for genomics. |
| Solid-Phase Extraction (SPE) | C18 and HILIC Cartridges (e.g., Waters, Agilent) | Fractionates complex food extracts to reduce matrix effects for both NMR and MS. |
| Chemical Shift Alignment Tool | Chenomx NMR Suite, icoshift (MATLAB) | Aligns NMR peaks across samples to correct for minor pH or cation shifts before fusion. |
| Multi-Block Analysis Software | SIMCA-P+ (Umetrics), mixOmics package (R) | Performs sophisticated statistical fusion (e.g., MB-PLS, DIABLO) on multi-omic blocks. |
Conclusion
NMR spectroscopy offers a uniquely versatile and information-rich platform for the analysis of both liquid and solid food matrices, providing critical insights for pharmaceutical researchers investigating nutraceuticals, drug-food interactions, and formulation stability. Mastering foundational principles, robust protocols, and troubleshooting strategies is essential for generating high-quality, reproducible data. While NMR excels in non-targeted profiling and quantification without extensive separation, its true power is realized when validated against and fused with complementary analytical techniques. Future directions point toward high-throughput, automated NMR workflows, increased use of hyphenated LC-NMR systems for complex mixtures, and the application of machine learning to extract maximal biological meaning from food NMR data, ultimately accelerating the translation of food composition insights into clinical and health outcomes.