AI-Driven Spectroscopy for Allergen Detection: Revolutionizing Safety in Complex Food Matrices
This article explores the transformative integration of artificial intelligence (AI) and advanced spectroscopic techniques for detecting food allergens in complex matrices.
AI-Driven Spectroscopy for Allergen Detection: Revolutionizing Safety in Complex Food Matrices
Abstract
This article explores the transformative integration of artificial intelligence (AI) and advanced spectroscopic techniques for detecting food allergens in complex matrices. Tailored for researchers and scientists, it examines the foundational principles of technologies like Hyperspectral Imaging (HSI), FTIR, and Raman spectroscopy, enhanced by machine learning for non-destructive, real-time analysis. The scope extends to methodological applications, including sensor fusion and aptamer-based platforms, troubleshooting of computational and data challenges, and rigorous validation against conventional methods like ELISA and PCR. By synthesizing current innovations and future trajectories, this review provides a comprehensive resource for advancing food safety protocols and clinical diagnostics.
The New Frontier: Understanding AI and Spectroscopy for Allergen Detection
Immunoglobulin E (IgE)-mediated food allergies (FA) represent a growing global public health challenge, characterized by adverse immune responses upon exposure to specific food allergens [1]. The management of these allergies requires strict dietary avoidance to prevent reactions ranging from moderate symptoms, such as nausea or hives, to severe, life-threatening anaphylaxis [2]. The increasing global prevalence, coupled with the significant social and financial burdens placed on affected families and healthcare systems, underscores a critical need for advancements in detection and management strategies [3] [4]. Emerging technologies, particularly AI-driven spectroscopy, are poised to transform allergen detection by enabling faster, more accurate, and non-destructive analysis of complex food matrices, thereby addressing key challenges in safety and compliance [5] [2].
The Global Burden of Food Allergy
Epidemiological Trends
The prevalence of food allergies has increased significantly in recent decades, with variations observed across different regions and age groups. A large international cross-sectional study (ASSESS FA) developed a standardized methodology to estimate point prevalence across nine countries, revealing a complex epidemiological landscape [1].
Table 1: Global Prevalence of Food Allergies
| Region | Pediatric Population | Adult Population | Notes |
|---|---|---|---|
| United States & Canada | 6.5% - 8.7% | 5.9% - 10.8% | Based on reported FA [1] |
| Europe | 2% - 20% | 1% - 4.7% | Great variation across nations [1] |
| China | 4% - 12% | 7% - 14% | [1] |
| Japan | ~5% (children) | Data not specified | [1] |
| Global Estimate | ~8% (worldwide) | 3-11% (varies by region) | Highest among younger children [1] [2] |
The "big-nine" allergens—wheat (gluten), peanuts, egg, shellfish, milk, tree nuts, fish, sesame, and soybeans—are responsible for the majority of severe allergic reactions [2]. In 2023, the U.S. Food and Drug Administration (FDA) added sesame to its major allergens list, reflecting the evolving understanding of allergenic foods [2]. Furthermore, emerging allergens such as lupin, certain seeds (e.g., mustard), and insect proteins are increasingly recognized as triggers, adding complexity to allergy management [6].
Socio-Economic Impact
The financial and social costs of food allergy are substantial and multifaceted, affecting households, healthcare systems, and society at large.
Table 2: Socio-Economic Burden of Food Allergy
| Cost Category | Description | Impact |
|---|---|---|
| Direct Household Costs | Higher-cost allergen-free foods, medications (e.g., epinephrine auto-injectors), and therapies [3]. | Families face disproportionately higher food costs, exacerbated by recent food inflation [3] [4]. |
| Indirect Household Costs | Time and opportunity losses from managing the condition (e.g., food preparation, medical appointments) [3]. | Increased burden on caregivers, potentially affecting employment and income [3]. |
| Intangible Costs | Impaired health-related quality of life (HRQL), psychological stress, and social isolation [3]. | Significant impairments in quality of life and food allergy anxiety for patients and families [3] [1]. |
| Healthcare System Costs | Medical care, hospitalizations, and dispensation of emergency medications [4]. | Annual economic cost in the US is estimated at $19-$25 billion [2]. |
For families, these burdens are fluid across the lifespan and are exacerbated in an era of rapid change in food allergy management and therapy [3]. The constant vigilance required for food avoidance can lead to anxiety and restrict participation in social activities, which are often centered around food [3] [1].
Current Challenges in Allergen Detection
Conventional allergen detection methods, such as Enzyme-Linked Immunosorbent Assay (ELISA), Polymerase Chain Reaction (PCR), and mass spectrometry, while reliable, present several limitations. These methods can be time-consuming, limited in scope, destructive to samples, and often require extensive sample preparation [5] [2]. A significant challenge is the accurate detection of allergens in processed foods, where proteins may be denatured or altered, reducing the efficiency of antibody-based detection [7] [8]. Furthermore, the need for simultaneous detection of multiple allergens in complex matrices is not adequately met by single-analyte methods, necessitating multiple analyses and increasing time and cost [7]. The reliance on high-quality protein extracts is also a critical factor for accurate quantification in allergy risk assessments [8].
AI-Driven Spectroscopy: A Paradigm Shift in Detection
Technological Foundations
Artificial Intelligence (AI), particularly machine learning (ML) and deep learning, is revolutionizing analytical spectroscopy for allergen detection. These technologies leverage the power of sensors and advanced algorithms to provide rapid, non-destructive, and highly accurate analysis [2]. Key spectroscopic techniques being enhanced by AI include:
- Hyperspectral Imaging (HSI) and Fourier Transform Infrared (FTIR) Spectroscopy: AI models can process the complex spectral data from these non-destructive methods to identify and quantify allergens in real-time without altering food integrity [5].
- Raman Spectroscopy: This technique provides a valuable analytical method for non-destructively measuring molecular structure in biomedical and food samples. When combined with AI, it enables high-sensitivity classification and prediction [9].
- Mass Spectrometry: Coupled with AI, this technology can achieve high sensitivity and specificity by detecting proteotypic peptides across complex food matrices, offering new levels of precision for quantifying specific allergenic proteins [5].
AI models, including Convolutional Neural Networks (CNNs), can reduce the need for rigorous data preprocessing and identify the most important spectral regions for analyzing features of interest, thereby improving classification accuracy [9].
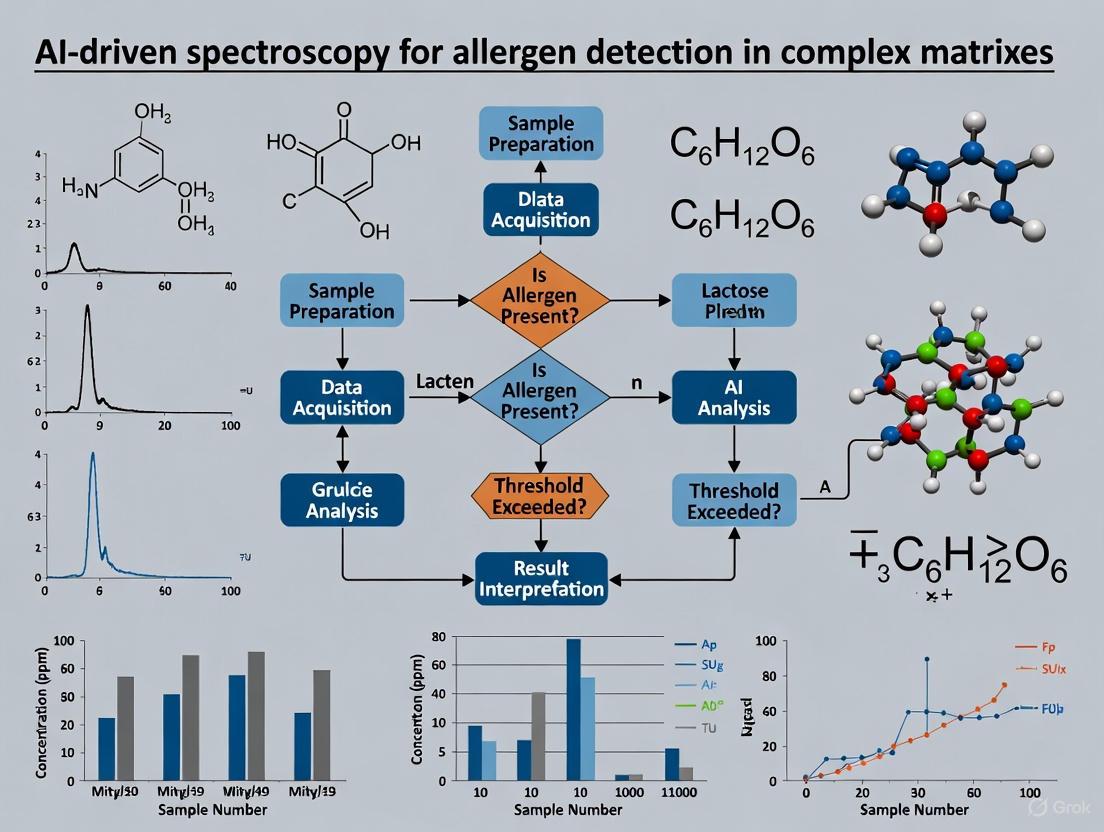
Application Workflow for Allergen Detection
The following diagram illustrates the integrated workflow of AI-driven spectroscopy for detecting allergens in complex food matrices.
Experimental Protocol: AI-Enhanced Spectral Analysis for Allergen Detection
Objective: To identify and quantify specific food allergens in a complex, incurred food matrix using Fourier Transform Infrared (FTIR) spectroscopy coupled with a Convolutional Neural Network (CNN).
Materials & Reagents:
- Food matrix (e.g, baked muffins, dark chocolate, meat sausage)
- Target allergenic food powders (e.g., peanut, milk, egg)
- Phosphate Buffered Saline (PBS) with 0.05% Tween-20
- SDS/β-mercaptoethanol denaturing buffer
- Reflective metal slides for FTIR
Procedure:
- Sample Incurring and Preparation:
- Incur the target allergenic food powder into the selected food matrix at concentrations ranging from 1 to 1000 μg/g (ppm) of the original food [7].
- Homogenize the incurred samples using a blender to ensure uniform distribution.
Protein Extraction (Dual Protocol):
- Buffered-Detergent Extraction: Weigh 1 g of sample and add 10 mL of PBS-Tween (0.05%). Vortex for 2 minutes, then centrifuge at 10,000 × g for 10 minutes. Collect the supernatant [7].
- Reduced-Denatured Extraction: For samples subjected to processing (e.g., baking), weigh 1 g of sample and add 10 mL of SDS/β-mercaptoethanol buffer. Heat at 95°C for 10 minutes, then centrifuge at 10,000 × g for 10 minutes. Collect the supernatant [7] [8].
Spectral Data Acquisition:
- Spot 2 μL of each extract onto a reflective metal slide and allow to air-dry.
- Acquire FTIR spectra in the reflectance mode across the wavenumber range of 4000-600 cm⁻¹. Perform 64 scans per spectrum at a resolution of 4 cm⁻¹.
AI Model Training and Analysis:
- Data Preprocessing: Apply standard normal variate (SNV) transformation to minimize scatter effects. Perform vector normalization on the spectral data [9].
- Model Architecture: Implement a shallow CNN with a single one-dimensional convolutional layer, followed by a max-pooling layer and two fully connected layers.
- Model Training: Split the preprocessed spectral data into training (70%), validation (15%), and test (15%) sets. Train the CNN to classify samples based on allergen presence and concentration. Compare performance against traditional models like Partial Least Squares (PLS) regression [9].
Validation:
- Validate the model's classification accuracy and quantification precision using blinded test sets.
- Confirm detection capability at concentrations comparable to ≤ 10 μg/g in the original food sample, as demonstrated in multi-laboratory validations [7].
The Scientist's Toolkit: Research Reagent Solutions
Table 3: Essential Reagents and Materials for Allergen Detection Research
| Reagent/Material | Function/Application | Example Use in Protocol |
|---|---|---|
| PBS with Tween-20 | Buffered-detergent extraction; solubilizes native proteins for immunoassay-based detection [7]. | Extraction of soluble, non-denatured proteins from food matrices for initial screening [7]. |
| SDS/β-mercaptoethanol Buffer | Reduced-denatured extraction; disrupts disulfide bonds and solubilizes proteins from processed foods [7]. | Extraction of proteins from baked or heat-processed samples where allergens may be denatured [7] [8]. |
| xMAP Microspheres | Color-coded magnetic beads for multiplex immunoassays; allow simultaneous detection of multiple allergens [7]. | Bead-based immunoassay for concurrent detection of 14+ allergens in a single well [7]. |
| Antibody Cocktails | Target-specific antibodies conjugated to beads or labels; provide specificity for allergen identification [7]. | Key component in xMAP FADA or ELISA for binding and detecting specific allergenic proteins [7]. |
| FTIR/Raman Slides | Substrate for spectral analysis; provides a consistent surface for non-destructive measurement [9]. | Holding the sample during spectral data acquisition via FTIR or Raman spectroscopy [9]. |
The rising global prevalence and substantial economic impact of food allergies create a critical need for advanced detection methodologies. The limitations of conventional techniques highlight the necessity for innovative solutions. The integration of Artificial Intelligence with analytical spectroscopy presents a transformative approach, enabling rapid, accurate, and non-destructive detection and quantification of allergens, even within the most complex food matrices. This powerful combination promises to enhance consumer safety, improve regulatory compliance, and ultimately reduce the significant human and economic costs associated with food allergies.
The accurate detection and quantification of target analytes, such as food allergens, pathogens, or therapeutic biomarkers, in complex matrices is a cornerstone of food safety, clinical diagnostics, and pharmaceutical development. Complex biological and food matrices, which can include components like proteins, lipids, carbohydrates, and salts, present a significant challenge for analytical techniques. Conventional methods, including the Enzyme-Linked Immunosorbent Assay (ELISA), Polymerase Chain Reaction (PCR), and mass spectrometry, are widely used but possess inherent limitations that can compromise their performance in these demanding environments. Within the broader context of developing AI-driven spectroscopy for allergen detection, understanding these limitations is crucial. It not only highlights the need for innovative solutions but also helps define the specific performance gaps that new technologies must address. This application note details the key limitations of these established methods, supported by experimental data and protocols, to guide researchers in selecting and developing appropriate analytical strategies.
Limitations of ELISA
The Enzyme-Linked Immunosorbent Assay (ELISA) is a foundational biochemical technique that leverages antibody-antigen interactions for detection. Despite its widespread use, its performance is notably affected by complex sample matrices [10] [11].
Key Limitations and Underlying Causes
- Matrix Interference and Non-Specific Binding: Complex biological matrices, such as serum or food extracts, contain many non-target proteins and other components that can bind non-specifically to the assay surfaces or antibodies. This leads to high background noise, reduced signal-to-noise ratios, and potentially false-positive results [11] [12]. The prolonged incubation times typical of ELISA procedures exacerbate this issue by increasing the opportunity for non-specific binding [12].
- Antibody Cross-Reactivity: The specificity of ELISA is entirely dependent on the antibodies used. These antibodies can exhibit cross-reactivity with structurally similar molecules or protein isoforms that are not the target analyte. This is a significant source of false positives and can obscure the accurate quantification of specific biomarkers or allergenic proteins [13] [11].
- Limited Dynamic Range and Throughput: Traditional ELISA, often conducted in 96-well plates, has a relatively narrow dynamic range, requiring sample dilutions to fit within the standard curve. This process is laborious and consumes valuable sample volumes. Furthermore, the platform is inherently low-throughput, slowing down research and development, particularly in high-demand environments like drug development [12].
Experimental Protocol: Assessing Matrix Interference in Sandwich ELISA
1. Objective: To evaluate the impact of a complex food matrix on the quantification of a target allergenic protein (e.g., Ara h 1 from peanut) using a commercial sandwich ELISA kit.
2. Materials:
- Research Reagent Solutions:
- Commercial Peanut ELISA Kit (includes capture antibody, detection antibody, standards, substrates)
- Peanut-free food matrix extract (e.g., blank chocolate slurry)
- Purified Ara h 1 protein standard
- Microplate washer and reader
- Phosphate-Buffered Saline (PBS) or wash buffer
3. Procedure: a. Sample Preparation: Prepare two sets of calibration standards in duplicate. Set A: Standards are prepared in the kit's provided buffer. Set B: Standards are prepared in the peanut-free food matrix extract. b. Assay Execution: Follow the kit manufacturer's protocol for the sandwich ELISA. This typically involves: coating the plate with a capture antibody, blocking, adding the standards (Sets A and B) and any test samples, adding an enzyme-linked detection antibody, adding a substrate, and finally stopping the reaction. c. Data Analysis: Measure the absorbance of each well. Generate standard curves for both Set A (buffer) and Set B (matrix). Compare the slopes of the two curves. A significant difference in slope indicates the presence of matrix effects—ion suppression if the slope is lower, or enhancement if it is higher.
Limitations of PCR
Polymerase Chain Reaction (PCR) and its quantitative variants (qPCR) are powerful tools for detecting nucleic acids. However, their application to complex matrices is limited by several factors.
Key Limitations and Underlying Causes
- Susceptibility to Inhibitors: Complex matrices such as food, soil, or clinical samples often contain substances that inhibit PCR amplification. These inhibitors include polyphenols, polysaccharides, fats, and salts, which can co-extract with DNA and interfere with the DNA polymerase enzyme. This leads to reduced amplification efficiency, underestimation of target concentration, or false-negative results [14] [15].
- Inability to Detect Non-Nucleic Acid Analytes: A fundamental limitation of PCR is that it can only detect the genetic material of an organism. It cannot directly detect proteins, which are the actual molecules responsible for allergic reactions or many biological functions. Therefore, PCR cannot differentiate between an active, protein-expressing allergen and non-viable genetic material, which is a critical distinction for food safety and clinical diagnosis [13] [2].
- Quantification Challenges in qPCR: Real-time quantitative PCR (qPCR) relies on standard curves for quantification, which can introduce variability. Its performance is also highly dependent on the efficiency of DNA extraction, which can be inconsistent across different complex matrices, further complicating accurate quantification [15].
Experimental Protocol: Evaluating PCR Inhibition in Food Matrices
1. Objective: To assess the presence of PCR inhibitors in a DNA extract from a complex food matrix (e.g., spiced meat) using droplet digital PCR (ddPCR).
2. Materials:
- Research Reagent Solutions:
- DNA extraction kit
- Target DNA standard (e.g., soybean lectin gene)
- ddPCR supermix, droplet generator, and reader
- Assay-specific primers and probes
3. Procedure: a. DNA Extraction: Extract DNA from the complex food matrix following a standardized protocol. b. Sample Setup: Prepare two reactions: - Test Reaction: The extracted DNA from the food matrix. - Control Reaction: A known amount of the target DNA standard spiked into the extracted DNA. c. ddPCR Run: Partition both reactions into thousands of nanodroplets using a droplet generator. Perform PCR amplification on a thermal cycler and analyze the droplets using a reader to count the positive and negative droplets. d. Data Analysis: The concentration of the target is determined directly from the ratio of positive to total droplets, without the need for a standard curve. Recovery is calculated by comparing the measured concentration in the spiked control reaction to the expected concentration. A recovery rate significantly below 100% indicates the presence of PCR inhibitors in the matrix.
Table 1: Quantitative Comparison of Conventional Method Limitations
| Method | Key Limitation | Impact on Sensitivity/Specificity | Throughput & Workflow |
|---|---|---|---|
| ELISA | Matrix interference & antibody cross-reactivity [11] [12] | Reduced specificity; false positives/negatives [13] | Low throughput; long, manual processes (>4 hours) [12] |
| PCR | Susceptibility to inhibitors; cannot detect proteins [14] [13] | False negatives; limited application scope [2] [15] | High throughput possible, but requires extensive sample prep [14] |
| Mass Spectrometry | Matrix effects (ion suppression/enhancement) [16] | Reduced sensitivity & quantitative accuracy [13] [16] | High throughput; complex operation & data processing [13] [11] |
Limitations of Mass Spectrometry
Liquid Chromatography with Tandem Mass Spectrometry (LC-MS/MS) is renowned for its high specificity and sensitivity. However, it is not immune to challenges posed by complex matrices.
Key Limitations and Underlying Causes
- Matrix Effects (ME): This is the most significant challenge for LC-MS/MS in complex matrices. Matrix effects occur when co-eluting compounds from the sample interfere with the ionization of the target analyte in the mass spectrometer source. This can cause either ion suppression (reduced signal) or ion enhancement (increased signal), leading to inaccurate quantification, particularly at low analyte concentrations [13] [16]. The electrospray ionization (ESI) source is especially prone to these effects.
- Complexity and Cost: LC-MS/MS instrumentation is sophisticated, requires highly skilled operators, and involves high capital and maintenance costs. The development of robust methods can be time-consuming, and data processing is often complex, limiting its accessibility for some laboratories [11] [17].
- Limited Multiplexing in ICP-MS: While Inductively Coupled Plasma Mass Spectrometry (ICP-MS) is extremely sensitive for detecting elements, its application in bioanalysis requires conjugating biomarkers to elemental tags. Multiplexed assays (detecting multiple targets at once) can be hampered by spectral overlap, which requires careful planning and advanced instrumentation to overcome [13].
Experimental Protocol: Assessing Matrix Effects in LC-MS/MS
1. Objective: To qualitatively identify regions of ion suppression/enhancement in an LC-MS/MS method for detecting multiple allergenic protein peptides in a processed food sample.
2. Materials:
- Research Reagent Solutions:
- LC-MS/MS system with post-column T-piece infusion capability
- Syringe pump
- Mixed standard solution of target allergenic peptides
- Blank matrix extract (from a food sample known to be free of the target allergens)
3. Procedure: a. System Setup: Connect a syringe pump containing the mixed standard solution to a post-column T-piece. The effluent from the LC column is mixed with the constantly infused standard just before entering the MS ion source. b. LC-MS Analysis: Inject the blank matrix extract onto the LC column. While the blank matrix is eluting, the standard is continuously infused. c. Data Analysis: Monitor the MS signal for the target peptides. A stable signal indicates no matrix effects. A dip in the signal indicates ion suppression, while a peak indicates ion enhancement, occurring at the retention times where interfering compounds from the blank matrix co-elute with the infused analytes.
The limitations of ELISA, PCR, and mass spectrometry in complex matrices are significant and can directly impact patient safety, drug development, and food regulatory decisions. Issues such as matrix interference, susceptibility to inhibitors, antibody cross-reactivity, and ionization suppression underscore the need for more robust analytical platforms.
These challenges provide a clear rationale for the development and adoption of innovative technologies, such as AI-driven spectroscopy. Techniques like Surface-Enhanced Raman Spectroscopy (SERS) and hyperspectral imaging, when coupled with machine learning, offer promising avenues for non-destructive, rapid, and highly specific detection of allergens and other analytes directly in complex matrices [5] [2] [17]. By learning from the shortcomings of conventional methods, researchers can better design and validate these next-generation tools to provide the accuracy, sensitivity, and practicality required for modern analytical challenges.
The detection and identification of allergens in complex food matrices present significant analytical challenges due to the low concentrations of allergenic proteins and the interference from other food components. Conventional methods, such as enzyme-linked immunosorbent assays (ELISA), are reliable but can be time-consuming, require extensive sample preparation, and are not conducive to real-time monitoring [18] [2]. The integration of advanced spectroscopic techniques with Artificial Intelligence (AI) provides a powerful solution for rapid, non-destructive, and accurate allergen detection. These core techniques—Fourier-Transform Infrared (FTIR) spectroscopy, Hyperspectral Imaging (HSI), and Raman spectroscopy—generate rich molecular fingerprint data that AI models can interpret to identify and quantify allergens with high precision. This document details the principles, applications, and standardized protocols for employing these techniques within an AI-driven framework for allergen detection research.
Technique Principles & AI Synergy
Fourier-Transform Infrared (FTIR) Spectroscopy
Principle: FTIR spectroscopy measures the absorption of infrared light by a sample. When IR radiation interacts with the sample, chemical bonds vibrate at specific frequencies, absorbing energy at characteristic wavelengths. The instrument directs a broadband IR beam through an interferometer and then onto the sample. The resulting interferogram, which contains encoded absorption information for all frequencies, is converted into a spectrum using a Fourier Transform algorithm. This spectrum plots absorbance versus wavenumber (cm⁻¹), providing a unique molecular fingerprint based on the vibrational modes of the sample's functional groups (e.g., C=O, N-H) [19] [20].
Synergy with AI: The complex spectral data from FTIR, particularly in the "fingerprint region" (1500–500 cm⁻¹), contains subtle patterns that are ideal for machine learning (ML). AI models, such as support vector machines (SVM) or convolutional neural networks (CNNs), can be trained on libraries of FTIR spectra from known allergenic and non-allergenic samples. Once trained, these models can automatically identify the presence of specific allergens, such as lipid transfer proteins (LTPs) in plant-based foods or gluten in wheat, by recognizing their unique spectral signatures, even in complex mixtures [21] [22].
Raman Spectroscopy
Principle: Raman spectroscopy is based on the inelastic scattering of monochromatic laser light. Most scattered light is at the same energy as the laser source (Rayleigh scattering), but a tiny fraction (~1 in 10⁷ photons) undergoes a shift in energy due to interactions with molecular vibrations. This Raman shift provides information about the vibrational energy levels of the molecules. The resulting spectrum, plotting intensity versus Raman shift (cm⁻¹), offers a complementary molecular fingerprint to FTIR. A key difference lies in the selection rules: Raman spectroscopy is particularly sensitive to symmetric vibrations and non-polar bonds (e.g., C-C, S-S), whereas FTIR is more sensitive to asymmetric vibrations and polar bonds [19] [20].
Synergy with AI: Raman signals can be weak and sometimes obscured by fluorescence. AI algorithms are instrumental in mitigating these issues by filtering noise and extracting the relevant spectral features. Furthermore, ML models can be deployed for the quantitative analysis of allergens, correlating specific Raman peak intensities or overall spectral shapes with allergen concentration. This is especially useful for detecting contaminants like melamine in milk or identifying different food adulterants [21] [22].
Hyperspectral Imaging (HSI)
Principle: HSI is a hybrid technique that combines spectroscopy with digital imaging. It captures a three-dimensional data structure known as a "hypercube," comprising two spatial dimensions (x, y) and one spectral dimension (λ). For each pixel in the image, a full spectrum is acquired across a wide range of wavelengths (e.g., visible to near-infrared). This allows for the simultaneous determination of the chemical composition (from the spectrum) and the spatial distribution of components within a sample [23] [24].
Synergy with AI: The hypercube generates vast, high-dimensional datasets, making it a prime candidate for AI analysis. Deep learning algorithms, particularly CNNs, can process these hypercubes to perform tasks such as:
- Pixel-wise classification: Automatically segmenting an image to identify and map regions contaminated with allergens.
- Spatial quantification: Determining not just if an allergen is present, but also its distribution and concentration across the food sample. This enables the non-destructive inspection of entire food products for contaminants like peanuts or sesame seeds on processing equipment or in finished goods [23] [24].
Comparative Analysis of Techniques
Table 1: Comparative analysis of FTIR, Raman, and HSI for allergen detection.
| Aspect | FTIR Spectroscopy | Raman Spectroscopy | Hyperspectral Imaging (HSI) |
|---|---|---|---|
| Primary Principle | Absorption of infrared light [20] | Inelastic scattering of laser light [20] | Spatial imaging + spectroscopy (reflectance/transmittance) [24] |
| Best For | Organic & polar molecules (C=O, N-H, O-H) [20] | Non-polar molecules (C=C, S-S) & aqueous samples [20] | Mapping spatial distribution of contaminants & quality attributes [23] [24] |
| Water Compatibility | Poor (strong IR absorber) [20] | Excellent (weak Raman scatterer) [20] | Varies with spectral range (e.g., good in NIR) [24] |
| Key Advantage for Allergens | High sensitivity for protein amide bands [22] | Minimal sample prep; can analyze through packaging [20] | Combines visual identification with chemical analysis [23] |
| Main Challenge | Sample preparation (e.g., ATR pressure) | Fluorescence interference [20] | High data volume & computational cost [23] [24] |
| Typical AI Integration | Classification models (SVM, PLS-DA) for spectral fingerprints [21] | Quantitative models for concentration & noise reduction [21] | Deep learning (CNNs) for image segmentation & classification [24] |
Experimental Protocols
General AI-Driven Spectroscopy Workflow
The following diagram illustrates the overarching workflow for applying AI to spectroscopic data for allergen detection.
Protocol 1: FTIR-based Detection of nsLTP Allergens
This protocol outlines the steps for detecting non-specific Lipid Transfer Proteins (nsLTPs) in food samples using FTIR spectroscopy and machine learning [18] [22].
3.2.1 Research Reagent Solutions & Materials
Table 2: Essential materials for FTIR-based allergen detection.
| Item | Function/Description | Example |
|---|---|---|
| FTIR Spectrometer | Instrument for spectral acquisition; equipped with an ATR accessory. | Bruker ALPHA II (ATR) |
| ATR Crystal | Enables minimal sample preparation by measuring evanescent wave absorption. | Diamond crystal |
| Food Samples | Representative samples with and without the target allergen. | Peach, apple, lettuce |
| Cryogrinder | Homogenizes samples to a fine powder for consistent spectral reading. | |
| Software | For spectral preprocessing, machine learning model development, and data analysis. | Python (scikit-learn), Unscrambler |
3.2.2 Step-by-Step Procedure
Sample Preparation:
- Collect a variety of food samples known to contain nsLTPs (e.g., peaches) and samples free of nsLTPs (e.g., lettuce) [18]. Label accordingly.
- Freeze samples with liquid nitrogen and homogenize using a cryogrinder to create a fine, uniform powder.
- Allow the powdered samples to equilibrate to room temperature in a desiccator to minimize moisture interference.
Spectral Data Acquisition:
- Clean the ATR crystal with ethanol and a lint-free cloth and acquire a background spectrum.
- Place a small amount of the powdered sample onto the ATR crystal. Apply consistent pressure to ensure good contact.
- Acquire the FTIR spectrum in the mid-IR range (e.g., 4000–400 cm⁻¹) with a resolution of 4 cm⁻¹. Accumulate 32–64 scans per spectrum to ensure a high signal-to-noise ratio.
- Clean the crystal thoroughly between samples to prevent cross-contamination.
- For a robust model, collect a minimum of several thousand spectra across all sample types to ensure statistical power [18].
Data Preprocessing:
- Savitzky-Golay Smoothing: Apply to reduce high-frequency noise.
- Standard Normal Variate (SNV) or Multiplicative Scatter Correction (MSC): Correct for light scattering effects due to particle size differences.
- Derivative (1st or 2nd): Use to resolve overlapping peaks and enhance spectral features. Second-derivative treatment is particularly useful for analyzing the amide I band for protein secondary structure [24] [22].
AI Model Training & Validation:
- Split the preprocessed dataset into training (e.g., 70%), validation (e.g., 15%), and test (e.g., 15%) sets.
- Train a machine learning classifier, such as a Support Vector Machine (SVM) or Partial Least Squares Discriminant Analysis (PLS-DA), on the training set to distinguish between spectra from nsLTP-containing and nsLTP-free samples.
- Optimize model hyperparameters using the validation set.
- Evaluate the final model's performance on the held-out test set, reporting metrics such as accuracy, precision, recall, and F1-score. A well-validated model can achieve accuracy exceeding 87% for this application [18].
Protocol 2: HSI for Mapping Allergen Cross-Contact on Surfaces
This protocol describes a method for using HSI to detect and visualize the spatial distribution of allergenic residues on food processing surfaces [23] [24].
3.3.1 Workflow for HSI-based Contaminant Mapping
The specific data processing pipeline for HSI analysis is detailed below.
3.3.2 Step-by-Step Procedure
Sample Preparation & Imaging:
- Use sterile swabs to deliberately contaminate a clean, representative food processing surface (e.g., stainless steel) with a known allergen (e.g., peanut powder).
- Create a gradient of contamination levels.
- Set up the HSI system in reflectance mode. Ensure consistent and uniform illumination across the entire field of view.
- Acquire the hypercube of the contaminated surface. The system will capture spatial information (image of the surface) and spectral information (reflectance spectrum for each pixel).
Data Preprocessing:
- Flat-Field Correction: Use images of a white reference (e.g., Spectralon) and a dark current to calibrate and correct the raw hypercube.
- Spectral Preprocessing: Apply techniques like SNV or derivative analysis to the spectral dimension of each pixel to minimize the effects of uneven lighting and highlight chemical features.
Dimensionality Reduction & Model Training:
- Use Principal Component Analysis (PCA) on the spectral data to reduce the number of variables and identify the most informative principal components.
- Manually label pixels in the hypercube as "background," "allergen," etc., to create a ground-truth dataset for training.
- Train a Convolutional Neural Network (CNN) or a pixel-wise classifier (e.g., SVM) on the labeled data. The model will learn to associate specific spectral patterns with the presence of the allergen.
Prediction & Visualization:
- Apply the trained model to the entire, unseen hypercube. The model will classify every pixel.
- Generate a false-color map where each color represents a specific class (e.g., red for allergen, blue for clean surface). This provides an intuitive visualization of the location and extent of allergen contamination [23] [24].
The convergence of FTIR, Raman, and HSI with artificial intelligence creates a formidable toolkit for addressing the critical challenge of allergen detection in complex food matrices. FTIR excels at providing detailed molecular fingerprints of proteins, Raman offers exceptional compatibility with aqueous samples and minimal preparation, and HSI uniquely enables the spatial mapping of contaminants. By following the standardized protocols outlined in this document, researchers and food development professionals can leverage these techniques to develop robust, accurate, and rapid detection systems. The integration of AI not only automates analysis but also unlocks the ability to discern subtle patterns beyond human capability, paving the way for enhanced food safety, improved regulatory compliance, and greater protection for consumers with food allergies.
The integration of artificial intelligence (AI) and machine learning (ML) with spectroscopic techniques is revolutionizing the analysis of complex chemical and biological matrices. In the specific context of food allergen detection, these technologies address critical limitations of traditional methods. Techniques like ELISA and PCR, while reliable, are often time-consuming, limited in scope, and struggle with the complexity of food matrices [5]. AI-enhanced spectral methods provide a paradigm shift towards faster, more accurate, and non-destructive diagnostics, enabling real-time monitoring and data-driven risk management essential for public safety and regulatory compliance [5].
Spectral data acquired from techniques like Fourier-Transform Infrared (FTIR) spectroscopy or Hyperspectral Imaging (HSI) is inherently rich in information but is often affected by environmental noise, instrumental artifacts, and scattering effects [25]. Machine learning and deep learning models excel at overcoming these challenges by performing sophisticated feature extraction and pattern recognition, transforming this complex data into actionable insights for precise allergen identification and quantification.
Core Machine Learning Techniques in Spectral Analysis
The application of ML to spectral data involves several key steps, from preprocessing to final classification or regression. Deep neural networks, in particular, have shown remarkable success. While traditionally trained by adjusting weights in the "direct space" of node connections, innovative approaches now also perform learning in the spectral domain, adjusting the eigenvalues and eigenvectors of network transfer operators, which can lead to superior performance with an identical number of free parameters [26].
For spectral classification, a common practice is transforming one-dimensional spectral vectors into two-dimensional matrix data. This transformation allows the application of powerful, image-oriented deep learning algorithms like Convolutional Neural Networks (CNNs), which are highly proficient at processing spatial information [27] [28]. Studies utilizing this method on reflectance spectra have demonstrated classification accuracies exceeding 99% for plant samples and 94.78% for fruit samples, outperforming traditional algorithms like Support Vector Machines (SVM) [27] [28].
Table 1: Key AI/ML Models for Spectral Data Analysis
| Model Type | Key Function | Typical Application in Spectral Analysis | Reported Performance |
|---|---|---|---|
| Feedforward Neural Network (FNN) [27] | Classification of transformed 2D spectral data | Accurate classification of plant reflectance spectra | Average accuracy of 96.78% (max 99.56%) [27] |
| Convolutional Neural Network (CNN) [28] | Feature extraction and classification of 2D spectral data | Classification of fruit reflectance spectra; hyperspectral image analysis | Accuracy of 94.78% [28] |
| Spectral Domain Learning [26] | Network training in reciprocal space via eigenvalues/eigenvectors | Image classification (e.g., MNIST database) | Superior to standard methods with equal parameters [26] |
| Machine Learning-Empowered FTIR [29] | Metabolic fingerprinting and stratification | Discriminating serum from healthy, allergic, and SIT-treated mice and humans | Successful stratification (correlated with immunological data) [29] |
Application in Allergen Detection: Protocols and Data Presentation
The following protocols outline a streamlined workflow for developing an AI-driven spectral method for allergen detection in a complex food matrix, using peanut allergen Ara h 6 as a model analyte.
Protocol: AI-Enhanced Spectral Analysis for Peanut Allergen Detection
Objective: To quantify the concentration of the peanut allergen Ara h 6 in a baked food matrix using Hyperspectral Imaging (HSI) coupled with a Convolutional Neural Network (CNN).
Principle: HSI captures spatial and spectral information from samples. A CNN model is trained to identify the unique spectral signature of Ara h 6, even at low concentrations and within a complex background, enabling non-destructive and rapid quantification.
Materials and Reagents:
- Food Matrix: Allergen-free cookie dough.
- Allergen Standard: Purified Ara h 6 protein.
- Spectral Instrument: Hyperspectral imaging system (e.g., covering VNIR or SWIR range).
- Reference Method: ELISA kit for Ara h 6 quantification (for model training and validation).
- Software: Deep learning framework (e.g., TensorFlow, PyTorch) or specialized library like
spectrai[30].
Experimental Procedure:
Sample Preparation:
- Spike the allergen-free cookie dough with purified Ara h 6 standard to create a calibration set with concentrations spanning 0-10,000 ppm (mg/kg).
- Bake the cookies according to a standardized protocol.
- Prepare a separate, independent validation set of samples.
Data Acquisition (Spectral and Reference):
- Acquire hyperspectral images of all calibration and validation samples.
- For each calibration sample, homogenize a sub-portion and perform reference analysis using the ELISA kit to determine the actual Ara h 6 concentration [5].
Data Preprocessing (Critical Step):
- Cosmic Ray Removal: Eliminate sharp, spurious spikes from the spectral data [25].
- Baseline Correction: Correct for additive offsets and scattering effects [25].
- Normalization: Scale spectra to minimize effects of path length or light intensity variations [25].
- Transformation to 2D: Convert the preprocessed 1D spectral data from each pixel or region of interest into a 2D matrix format suitable for CNN input [27] [28].
Model Training and Validation:
- Architecture: Design a CNN with input dimensions matching your 2D spectral data. The architecture should include convolutional layers for feature extraction, pooling layers for down-sampling, and fully connected layers for final concentration prediction.
- Training: Train the CNN using the calibration set. The input is the preprocessed 2D spectral data, and the target output is the reference concentration from ELISA.
- Validation: Apply the trained model to the independent validation set. Compare the CNN-predicted concentrations with the reference ELISA values to assess model accuracy.
The workflow for this protocol is summarized in the following diagram:
Performance Metrics and Data
Table 2: Comparison of AI-Spectral Methods with Traditional Allergen Detection Techniques
| Methodology | Key Principle | Detection Limit | Analysis Time | Key Advantage for Allergens |
|---|---|---|---|---|
| ELISA [5] | Antibody-antigen binding | Varies by kit | Hours | High specificity, well-established |
| PCR [5] | DNA amplification | Varies by target | Hours | Detects trace DNA |
| Mass Spectrometry [5] | Detection of proteotypic peptides | ~0.01 ng/mL for specific allergens [5] | Minutes to Hours | High precision, multiplexing capability |
| AI-Empowered FTIR [29] | Metabolic fingerprinting + Deep Learning | Sub-ppm levels possible [25] | Minutes | Rapid, cost-effective, high-throughput |
| AI-Hyperspectral Imaging [5] | Spectral-spatial analysis + ML | Not specified | Minutes (real-time potential) | Non-destructive, provides spatial distribution |
The Scientist's Toolkit: Essential Research Reagents and Materials
Table 3: Key Research Reagent Solutions for AI-Driven Spectral Allergen Detection
| Item | Function/Description | Application Example |
|---|---|---|
| Purified Allergen Proteins (e.g., Ara h 3, Ara h 6, Bos d 5) [5] | Serve as analytical standards for spiking experiments and model training. | Creating calibration curves for quantitative analysis. |
| Allergen-Free Food Matrices | Provide a consistent and controlled background for developing and validating detection methods in complex systems. | Simulating real-world food products without endogenous allergen interference. |
| Commercial ELISA Kits | Provide a reference method for obtaining ground-truth concentration data to train and validate ML models. | Quantifying actual allergen levels in homogenized sample sub-portions. |
| Hyperspectral Imaging (HSI) System | Captures both spatial and spectral information from a sample, enabling non-destructive analysis. | Mapping the distribution of an allergen within a solid food product. |
| FTIR Spectrometer [29] | A high-resolution, cost-efficient biophotonic tool for obtaining metabolic or chemical fingerprints. | Rapid serum analysis to stratify healthy, allergic, and SIT-treated individuals [29]. |
| Deep Learning Framework (e.g., spectrai) [30] | Open-source software providing built-in preprocessing, augmentation, and neural network models specifically designed for spectral data. | Streamlining the development and comparison of ML models for spectral classification. |
Visualization of the AI-Spectral Analysis Workflow
The logical relationship between data acquisition, processing, and model application in AI-driven spectral analysis is best understood as an iterative cycle that refines its predictive power with more data. The process begins with raw data collection and culminates in a deployed model, whose outputs can, in turn, inform further data acquisition.
The accurate detection and quantification of food allergens in complex food matrices represents a significant analytical challenge for food safety researchers and the food industry. Conventional methods, including enzyme-linked immunosorbent assays (ELISA) and DNA-based PCR, while reliable, are often time-consuming, destructive, and can struggle with quantifying allergen levels, particularly in processed foods [31] [2]. The “big nine” allergens—milk, eggs, fish, crustacean shellfish, tree nuts, peanuts, wheat, soybeans, and sesame—are responsible for over 90% of severe food allergic reactions, necessitating detection methods of the highest reliability [2] [32]. The integration of Artificial Intelligence (AI) with advanced spectroscopic techniques is emerging as a transformative solution, overcoming the limitations of traditional methods by delivering unprecedented levels of sensitivity, specificity, and operational efficiency [33] [31]. This document details the application notes and experimental protocols for leveraging AI-driven spectroscopy, specifically within the context of allergen detection in complex food matrices, providing researchers with a framework for implementation.
Technical Background and Key Performance Metrics
The synergy between spectroscopy and AI addresses core challenges in allergen detection. Spectroscopic techniques like Fourier Transform Infrared (FTIR) spectroscopy and Hyperspectral Imaging (HSI) generate rich, multidimensional data from food samples non-destructively [5] [31]. However, the complexity of this data, especially against the background signal of a complex food matrix, makes manual interpretation difficult. AI and machine learning (ML) algorithms excel at identifying subtle, non-linear patterns within such large datasets that may be imperceptible to human analysis or traditional statistical methods [33] [34].
- Enhancing Sensitivity: AI models can be trained to recognize the unique spectral signatures of allergenic proteins even at ultra-low concentrations. For instance, Wide Line Surface-Enhanced Raman Scattering (WL-SERS) coupled with AI has demonstrated a tenfold increase in sensitivity, enabling the detection of contaminants like melamine in raw milk at concentrations far below conventional thresholds [33]. This principle is directly applicable to trace allergen detection.
- Improving Specificity: The core of accurate allergen detection lies in distinguishing the target allergenic protein's signal from the background matrix. Convolutional Neural Networks (CNNs) and other deep learning architectures have achieved up to 99.85% accuracy in identifying and classifying adulterants and specific allergens, drastically reducing false positives and negatives [33].
The table below summarizes quantitative performance data for key technologies relevant to this field.
Table 1: Performance Metrics of Advanced Detection Technologies
| Technology | Reported Sensitivity/Detection Limit | Reported Specificity/Accuracy | Key Application in Allergen Detection |
|---|---|---|---|
| AI-Enhanced Spectroscopy (e.g., CNN models) | Not explicitly quantified in results, but enables detection at "trace levels" [33] | Up to 99.85% accuracy in identifying adulterants [33] | Non-destructive identification and quantification of allergens in complex matrices [31] |
| Mass Spectrometry (Multiplexed) | As low as 0.01 ng/mL for specific proteins (e.g., Ara h 6 in peanut) [5] | High specificity for quantifying specific allergenic proteins [5] | Targeted quantification of specific protein allergens (e.g., Ara h 3, Bos d 5) [5] |
| WL-SERS | Tenfold increase vs. conventional methods [33] | Implied high specificity via AI integration [33] | Ultra-sensitive contaminant detection; applicable to trace allergens [33] |
Application Notes & Experimental Protocols
This section provides a detailed workflow and protocol for implementing AI-enhanced Hyperspectral Imaging (HSI) for the non-destructive detection of peanut allergen residues in a complex bakery product matrix.
The following diagram illustrates the integrated experimental and computational workflow, from sample preparation to final prediction.
Detailed Protocol: AI-HSI for Peanut Allergen Detection
Aim: To detect and quantify trace amounts of peanut protein (Ara h 6) in a wheat-based cookie matrix using HSI and a trained CNN model.
I. Materials and Reagents
Table 2: Research Reagent Solutions and Essential Materials
| Item | Function/Description | Supplier Notes |
|---|---|---|
| Peanut Flour (Defatted) | Source of allergenic proteins (Ara h 3, Ara h 6). Defatting improves protein extraction efficiency. | Prepare in-house or source certified reference material. |
| Wheat Flour-Based Cookie Dough | Represents the complex food matrix. | Use a consistent, minimal-ingredient recipe for standardization. |
| Protein Extraction Buffer (e.g., PBS with Tween-20, or Urea-Thiourea-CHAPS buffer [8]) | Efficiently solubilizes proteins from complex, processed matrices for validation. | Optimization is critical; a published optimized method achieved >80% extraction efficiency [8]. |
| LC-MS/MS System | Provides ground truth data for model training by quantifying specific allergenic peptides. | Used for targeted proteomics (e.g., for Ara h 6). |
| Hyperspectral Imaging System (NIR or SWIR range) | Captures spatial and spectral data from samples non-destructively. | Ensure calibration with standard white and dark references before use. |
| AI/ML Software Framework (e.g., Python with TensorFlow/PyTorch, MATLAB) | Platform for developing and training CNN and other ML models. |
II. Step-by-Step Procedure
Step 1: Sample Preparation and Dataset Creation
- Prepare a control batch of wheat-flour cookie dough without peanuts.
- Spike separate batches of dough with finely ground, defatted peanut flour to create a calibration curve with known concentrations (e.g., 0, 1, 5, 10, 50, 100 ppm total peanut protein).
- Bake cookies according to a standardized protocol to simulate processed food conditions.
- For each concentration level, prepare a minimum of n=20 individual cookies to ensure robust dataset size for AI training.
Step 2: Hyperspectral Image Acquisition
- Place each cookie sample on the translation stage of the HSI system.
- Acquire hypercubes for each sample. Typical parameters:
- Spectral Range: 900 - 1700 nm (SWIR) for protein-associated spectral features.
- Spatial Resolution: ~30 μm/pixel.
- Ensure consistent lighting and distance.
- Save raw hyperspectral data cubes for all samples.
Step 3: Ground Truth Validation via Mass Spectrometry
- From each cookie, take a core sample adjacent to the area imaged by HSI.
- Extract proteins using the optimized extraction buffer. Validate extraction efficiency, aiming for >80% to ensure accurate quantification [8].
- Using LC-MS/MS with targeted selected reaction monitoring (SRM), quantify the specific concentration of a marker peptide from the Ara h 6 allergen in each sample [5] [8].
- This LC-MS/MS data provides the definitive, quantitative "ground truth" label for each corresponding HSI data cube.
Step 4: Data Preprocessing and Augmentation
- Preprocessing: Use computational tools (e.g., Python, ENVI) to apply:
- Smoothing (Savitzky-Golay filter) to reduce spectral noise.
- Baseline Correction to remove scattering effects.
- Standard Normal Variate (SNV) normalization to minimize particle size effects.
- Data Augmentation: Artificially expand the training dataset by applying random rotations, translations, and slight spectral distortions to the existing HSI cubes to improve model generalizability.
Step 5: AI Model Training and Validation
- Architecture: Design a Convolutional Neural Network (CNN) with input layers matching the dimensions of your processed HSI data. The architecture should include convolutional layers for feature extraction, pooling layers, and fully connected layers for classification/regression.
- Training: Split the dataset into training (70%), validation (15%), and hold-out test (15%) sets. Train the CNN to map the input HSI data to the ground truth Ara h 6 concentration.
- Validation: Monitor the model's performance on the validation set to prevent overfitting. Key metrics include Root Mean Square Error (RMSE) for quantification and Accuracy/Specificity/Sensitivity for detection.
Step 6: Model Deployment and Prediction
- The trained and validated model can now be used to predict the presence and concentration of peanut allergen in new, unknown cookie samples directly from their HSI data.
- The output is a prediction map showing the spatial distribution and estimated concentration of the allergen within the food matrix.
The Scientist's Toolkit
A summary of the core computational and analytical components required for this research is provided below.
Table 3: Essential Toolkit for AI-Enhanced Spectroscopic Allergen Detection
| Tool Category | Specific Examples | Function in the Workflow |
|---|---|---|
| Spectroscopic Techniques | FTIR Spectroscopy, Hyperspectral Imaging (HSI), Coherent Raman Scattering (CRS) [5] [31] [34] | Non-destructively generates spectral fingerprints of the sample, containing information on molecular composition. |
| AI/ML Models | Convolutional Neural Networks (CNNs), Support Vector Machines (SVM), Artificial Neural Networks (ANN) [33] [34] [35] | Automatically extracts complex features from spectral data, classifies allergens, and quantifies concentrations. |
| Data Preprocessing Tools | Savitzky-Golay Filter, Standard Normal Variate (SNV), Principal Component Analysis (PCA) [34] | Cleans raw spectral data, removes noise and unwanted variance, and reduces dimensionality for more effective modeling. |
| Validation Techniques | Targeted Mass Spectrometry (LC-MS/MS), ELISA [5] [2] [8] | Provides the essential "ground truth" data required to train and validate the accuracy of AI models. |
| Key Reagents | Optimized Protein Extraction Buffers [8], Certified Allergen Reference Materials | Ensures efficient and reproducible recovery of allergenic proteins from complex food matrices for validation. |
Discussion
The integration of AI with spectroscopy represents a paradigm shift in food allergen analysis. The primary advantages are clear: non-destructive testing, dramatically reduced analysis time enabling real-time monitoring, and superior sensitivity and specificity [33] [31]. However, challenges remain for widespread adoption. These include the high computational demand of complex AI models, the initial cost of advanced spectroscopic equipment, a shortage of large, standardized public datasets for training and benchmarking, and the need for sensor stability and miniaturization for inline use in food production facilities [33] [34].
Future research should focus on developing explainable AI to build trust in model predictions, creating open-source spectral data repositories, and innovating in low-power, edge-computing hardware to deploy these systems directly in food manufacturing environments [34] [36]. By addressing these challenges, AI-driven spectroscopic methods are poised to become the gold standard for ensuring food safety and protecting consumers with food allergies.
From Theory to Practice: Implementing AI-Spectroscopy for Precision Allergen Detection
The detection of allergens in complex food matrices represents a significant challenge for food safety and public health. Traditional methods often struggle with the required sensitivity, specificity, and speed. Artificial intelligence (AI), particularly convolutional neural networks (CNNs) and autoencoders, is revolutionizing this field by enhancing the processing of spectral data. These techniques enable the extraction of subtle, meaningful patterns from complex spectroscopic signals, facilitating rapid, non-destructive, and accurate allergen detection directly in food products. This document outlines the application notes and experimental protocols for implementing these AI-driven spectral analysis techniques within a research context focused on allergen detection.
Core AI Architectures and Applications
Convolutional Neural Networks (CNNs) for Feature Extraction
CNNs excel at processing structured data with spatial hierarchies, making them ideal for analyzing spectral and image-based data from spectroscopic instruments. In allergen detection, CNNs automatically learn and identify discriminative features from raw spectral inputs, bypassing the need for manual feature engineering.
A prominent application involves classifying pollen particles using data from a Rapid-E single particle detector, which captures multi-modal optical fingerprints including scattered light patterns and fluorescence spectra. A deep learning model based on CNN architecture was developed to distinguish between different pollen classes, which is crucial for individuals with allergies [37]. The model utilizes three data modalities:
- Scattering: Sensed with 24 detectors, providing morphological properties.
- Spectrum: A 32-detector fluorescence spectrum revealing chemical properties.
- Lifetime: Fluorescence lifetime measured at four spectral ranges.
The CNN processes this multi-dimensional input to perform accurate classification, demonstrating how CNNs can integrate complex, heterogeneous spectral data for biological particle identification [37].
Autoencoders for Anomaly Detection and Data Compression
Autoencoders (AEs) are unsupervised neural networks designed for efficient data encoding and reconstruction. They learn a compressed representation (encoding) of input data and then attempt to reconstruct the original input from this representation. The reconstruction error is minimized during training.
The Convolutional Autoencoder (CAE), a variant using convolutional layers, is particularly effective for signal and image data. In condition monitoring, a CAE was trained to reconstruct spectrograms of normal operation data from a complex technical system. The model was then evaluated based on the reconstruction error when presented with anomalous samples; a high error indicates a potential fault [38]. This same principle is directly transferable to allergen detection, where a CAE trained on spectral data from "allergen-free" samples can flag anomalies corresponding to allergen contamination.
Another advanced implementation, the Convolutional Autoencoder-WaveGAN (CAE-WaveGAN), leverages a CAE for feature extraction from time-series signals, which is then used by a Generative Adversarial Network (GAN) generator to synthesize high-fidelity data. While demonstrated for ECG signals, this architecture holds promise for generating realistic spectral data to augment limited datasets in spectroscopic applications [39].
Experimental Protocols for Allergen Detection
This section provides a detailed methodology for developing an AI model to detect food allergens using Near-Infrared Spectroscopy (NIRS), based on a validated research study for detecting non-specific Lipid Transfer Proteins (nsLTPs) [18].
Protocol: AI-Driven Allergen Detection Using NIRS
Objective: To develop and validate a machine learning model for detecting specific allergens (e.g., nsLTPs) in various food samples using NIRS data.
Materials and Equipment:
- Scientific-grade NIRS spectrometer
- Diverse food samples (with and without the target allergen)
- Standard computational hardware (GPU recommended)
- Python programming environment with key libraries (e.g., Scikit-learn, TensorFlow/PyTorch, Pandas, NumPy)
Procedure:
Step 1: Sample Preparation and Spectral Data Collection
- Sample Selection: Obtain a range of food samples. Label each sample as "allergen present" or "allergen absent" based on definitive identification using authoritative allergen databases (e.g., AllergenOnline, WHO/IUIS Allergen Nomenclature) [18].
- Contamination Control: Thoroughly clean all equipment (e.g., knives, trays, tweezers) with distilled water and sterilize between samples to prevent cross-contamination. Use gloves during handling [18].
- Spectral Acquisition: For each food sample, collect spectral measurements. Place the sample in the spectrometer and allow a 10-second pause for system stabilization. Collect both absorbance and reflectance spectral data at three distinct positions on each sample. Save the raw data for each measurement in individual
.txtfiles [18].
Step 2: Database Construction and Preprocessing
- Automated Data Structuring: Develop Python scripts to automatically parse the
.txtfiles, extract the spectral data, and compile it into a structured.csvfile. The final database should contain spectral features as columns and individual measurements as rows, with a final column for the class label (Truefor allergen present,Falsefor absent) [18]. - Data Preprocessing: Clean the dataset to handle any missing values or noise. Apply spectral preprocessing techniques such as Standard Normal Variate (SNV) or Savitzky-Golay smoothing to reduce scattering effects and enhance spectral features.
Step 3: Model Training and Optimization
- Data Partitioning: Split the structured dataset into training, validation, and test sets (e.g., 70/15/15 ratio).
- Model Selection and Training: Implement a machine learning model, such as a Support Vector Machine (SVM) or a CNN. Train the model using the training set, optimizing hyperparameters (e.g., learning rate, number of layers, kernel type) via cross-validation on the validation set.
- Iterative Optimization: Refine the model architecture and hyperparameters iteratively to improve detection accuracy based on performance on the validation set [18].
Step 4: Model Validation and Performance Assessment
- Quantitative Evaluation: Use the held-out test set to evaluate the final model's performance. Calculate standard metrics including accuracy, F1-score, precision, and recall.
- Benchmarking: The model achieving an accuracy of 87% and an F1-score of 89.91% for nsLTP detection demonstrates a successful outcome, indicating high potential for enhancing food safety [18].
Workflow Visualization
The following diagram illustrates the end-to-end experimental workflow for AI-enhanced spectral allergen detection:
Quantitative Performance Data
The following tables summarize key quantitative findings from relevant studies employing AI for analysis in food safety, health, and related spectroscopic applications.
Table 1: Performance Metrics of AI Models in Allergen and Biosensing Applications
| AI Model | Application / Target | Key Performance Metrics | Source |
|---|---|---|---|
| Machine Learning (SVM) | nsLTP allergen detection in food via NIRS | Accuracy: 87%, F1-Score: 89.91% | [18] |
| AI-Assisted Biosensors | Foodborne pathogen detection in various matrices | Accuracy exceeding 95% in some cases | [40] |
| AI for Skin Test Reading | Allergy diagnostics (PRICK test) | High sensitivity and specificity; time savings of 40 min/patient | [41] |
Table 2: Performance of Autoencoder-based Models in Signal Processing and Monitoring
| AI Model | Application Context | Key Performance Metrics | Source |
|---|---|---|---|
| Convolutional Autoencoder (CAE) | Condition Monitoring (Anomaly Detection) | Accuracy: 97.22%, Precision: 93.88% | [38] |
| CAE-WaveGAN | Synthetic 12-lead ECG Signal Generation | PSNR improvement: 19.8%, SSIM enhancement: 59.3% vs. baseline | [39] |
The Scientist's Toolkit: Research Reagent Solutions
Table 3: Essential Materials and Reagents for AI-Enhanced Spectral Allergen Detection
| Item Name | Function / Purpose | Example / Specification |
|---|---|---|
| Scientific-Grade NIRS Spectrometer | Captures near-infrared spectral signatures (absorbance/reflectance) from food samples. | Configured for the specific wavelength range of interest. |
| Allergen Reference Databases | Provides ground-truth labels for model training by confirming allergen presence/absence in specific foods. | AllergenOnline, WHO/IUIS Allergen Nomenclature database. |
| Data Preprocessing Library | Software tools for spectral cleaning, normalization, and feature enhancement. | Python Scikit-learn, SciPy. |
| Deep Learning Framework | Provides environment for building, training, and validating CNN and autoencoder models. | TensorFlow, PyTorch, Keras. |
| Molecularly Imprinted Polymer (MIP) Electrodes | Biorecognition element for electrochemical detection of specific allergen tracers. | Used in electrochemical sensors for soy allergen (genistein) detection [42]. |
Technical Deep Dive: Convolutional Autoencoder Architecture
For researchers seeking to implement a CAE for anomaly detection in spectral data, the following diagram and description detail a proven architecture.
Architecture Workflow:
- Input: The raw spectral data (e.g., a 1D NIRS signal) is fed into the network.
- Encoder: Composed of consecutive 1D convolutional (Conv1D) and pooling layers. This segment extracts hierarchical features and progressively downsamples the input, creating a compressed representation in the bottleneck layer.
- Latent Space: This is the most compressed layer of the network, containing the essential features needed to reconstruct the input. In anomaly detection, the model learns the representation of "normal" spectra here.
- Decoder: Mirrors the encoder structure, using upsampling and transposed convolutional layers to reconstruct the original input signal from the latent space representation.
- Output and Loss: The reconstructed signal is compared to the original input. The mean squared error (MSE) is a typical loss function used to train the network by minimizing this reconstruction error. During application, a high reconstruction error for a new sample indicates a significant deviation from the trained "normal" data, suggesting a potential anomaly (e.g., allergen contamination) [38].
The demand for faster, more accurate, and scalable food safety monitoring has never been greater, particularly for detecting allergens and pathogens in complex food matrices [5]. Traditional methods like ELISA (Enzyme-Linked Immunosorbent Assay) and PCR (Polymerase Chain Reaction), while reliable, are time-consuming, destructive, and limited in scope for real-time processing environments [5] [2]. Emerging non-destructive technologies, particularly Hyperspectral Imaging (HSI) and Fourier Transform Infrared (FTIR) spectroscopy, are poised to transform the landscape of in-line food safety control. These techniques, when integrated with artificial intelligence (AI), enable real-time, non-destructive detection of contaminants such as allergens and pathogens without altering food integrity [5] [43]. This document details the application and protocols for implementing HSI and FTIR within an AI-driven framework for enhanced food safety monitoring.
Hyperspectral Imaging (HSI) combines conventional imaging and spectroscopy to obtain both spatial and spectral information from a sample, generating a three-dimensional data cube known as a hypercube (two spatial dimensions, one spectral dimension) [23] [44]. This allows for pixel-by-pixel analysis of spectral information, making it ideal for heterogeneous food samples [43].
Fourier Transform Infrared (FTIR) spectroscopy is a versatile, non-destructive analytical technique that measures the absorption of infrared light by molecules, providing a molecular fingerprint of the sample [45] [46]. Its speed and specificity make it suitable for both qualitative identification and quantitative analysis [45].
Table 1: Comparative Analysis of HSI and FTIR for In-Line Food Safety Control
| Feature | Hyperspectral Imaging (HSI) | Fourier Transform Infrared (FTIR) Spectroscopy |
|---|---|---|
| Primary Output | Spatial map of spectral variations (Hypercube) [44] | Molecular absorption spectrum (Fingerprint) [46] |
| Information Gained | Chemical composition + spatial distribution [23] [43] | Chemical composition and molecular structure [45] |
| Key Strength | Detecting contaminants & defects on surfaces; analyzing heterogeneous samples [44] [43] | High-specificity identification and quantification of compounds [45] [46] |
| Typical In-Line Mode | Reflectance [44] | Attenuated Total Reflectance (ATR) [46] |
| AI Integration | Machine learning for image analysis & classification [23] [47] | Machine learning for spectral interpretation & quantification [48] [47] |
| Sample Throughput | High (e.g., conveyor belt scanning) [43] | Very High (rapid data collection) [45] [46] |
| Allergen Detection | Promising for identifying particulate contamination [5] | Direct identification of allergenic proteins via fingerprinting [5] [2] |
| Pathogen Identification | Early detection of microbial colonies [43] | High-accuracy identification via Raman spectroscopy (a related technique) combined with ML [48] |
Experimental Protocols
Protocol for HSI-Based Allergen and Contaminant Detection
This protocol outlines the procedure for configuring an HSI system to detect and identify foreign contaminants, such as allergen particles, on food surfaces.
1. System Configuration and Calibration
- Hardware Setup: Utilize a push-broom or line-scanning HSI system mounted above a conveyor belt. The system should include a tungsten halogen light source for uniform illumination in the visible to short-wave infrared range (400-1000 nm or 1000-2500 nm, depending on the target analyte) and a CCD or InGaAs camera [44].
- Calibration: Perform radiometric calibration (dark and white reference) before each operation to minimize sensor noise and illumination irregularities. The dark reference is acquired with the lens covered, and the white reference is acquired using a standard reflectance panel (e.g., Spectralon) [44].
2. Data Acquisition
- Spectral Range Selection: For organic materials like allergens, the near-infrared (NIR) region (900-1700 nm) is often most informative due to absorption related to chemical bonds (O-H, C-H, N-H) [43].
- Image Capture: As samples move on the conveyor belt, continuously capture hyperspectral images. Ensure a consistent sample-to-camera distance and belt speed to maintain spatial and spectral integrity [44] [43].
3. Data Preprocessing and AI Model Application
- Hypercube Construction: Assemble the captured line scans into a 3D hypercube using the system's software [44].
- Spectral Preprocessing: Apply preprocessing techniques to the raw spectra to remove scattering effects and enhance the chemical signal. Common methods include Savitzky-Golay smoothing and Standard Normal Variate (SNV) normalization [23].
- Contaminant Identification: Input the preprocessed hypercube into a pre-trained machine learning model. For optimal results, a supervised model like a Support Vector Machine (SVM) or Convolutional Neural Network (CNN) should be used to classify each pixel as "pure food" or "contaminant" based on its spectral signature [23] [47]. The model outputs a spatial map highlighting the location and identity of the contaminant.
Protocol for FTIR Spectroscopy for Allergen Protein Detection
This protocol describes using FTIR spectroscopy, specifically in ATR mode, for the rapid screening of allergenic proteins in liquid or homogenized food samples.
1. Sample Presentation
- Sample Preparation: For solid or complex matrices, homogenize a small sample with an appropriate buffer (e.g., phosphate-buffered saline) to create a liquid slurry or extract. This ensures consistent contact with the ATR crystal. Minimal preparation is a key advantage [45] [46].
- Loading: Pipette a few microliters of the liquid sample or extract directly onto the ATR crystal of the FTIR spectrometer.
2. Spectral Collection
- Instrument Setup: Use an FTIR spectrometer equipped with a diamond ATR accessory. The system should be purged with dry air or nitrogen to minimize interference from atmospheric water vapor and CO₂ [46].
- Background Scan: Collect a background spectrum with a clean, dry ATR crystal before loading the sample.
- Sample Scan: Acquire the sample spectrum with a resolution of 4 cm⁻¹ and accumulate 32-64 scans to achieve a high signal-to-noise ratio. This process typically takes seconds [45] [46].
3. Analysis and Quantification
- Preprocessing: Process the acquired absorbance spectrum by applying a linear baseline correction and vector normalization.
- Spectral Analysis: Employ a quantitative model, such as Partial Least Squares Regression (PLSR) or a Random Forest Regressor, to correlate specific absorption bands (e.g., amide I and II bands around 1650 cm⁻¹ and 1550 cm⁻¹, indicative of proteins) with allergen concentration [23] [47]. The AI model is trained on spectra from samples with known allergen concentrations.
Table 2: Key Research Reagent Solutions for HSI and FTIR Experiments
| Item | Function | Example Application |
|---|---|---|
| Tungsten Halogen Lamp | Provides broad-spectrum illumination for HSI systems [44]. | Essential for generating reflectance data across UV, Vis, and NIR ranges. |
| Spectralon Reflectance Panel | A near-perfect diffuse reflector used for white reference calibration in HSI [44]. | Critical for correcting inhomogeneities in the light source and sensor. |
| ATR Crystal (Diamond/ZnSe) | The internal reflection element in FTIR that contacts the sample [46]. | Enables direct, non-destructive analysis of solids, liquids, and gels with minimal prep. |
| Purge Gas (Dry N₂) | Inert gas used to purge the optical path in an FTIR spectrometer [46]. | Eliminates spectral interference from atmospheric water vapor and CO₂. |
| Chemometric Software | Software for multivariate data analysis (e.g., PCA, PLSR, SVM) [23] [47]. | Extracts meaningful information from complex HSI and FTIR datasets. |
The Scientist's Toolkit: Essential Materials
Table 3: The Scientist's Toolkit: Essential Research Reagents and Materials
| Item | Function | Application Context |
|---|---|---|
| Tungsten Halogen Lamp | Provides broad-spectrum illumination for HSI systems across UV, Vis, and NIR ranges [44]. | Essential for generating consistent reflectance data in HSI setups. |
| Spectralon Reflectance Panel | A near-perfect diffuse reflector used for white reference calibration in HSI [44]. | Critical for correcting for inhomogeneities in the light source and sensor response. |
| ATR Crystal (Diamond/ZnSe) | The internal reflection element in FTIR that contacts the sample [46]. | Enables direct, non-destructive analysis of solids, liquids, and gels with minimal preparation. |
| Purge Gas (Dry N₂) | Inert gas used to purge the optical path in an FTIR spectrometer [46]. | Eliminates spectral interference from atmospheric water vapor and CO₂, ensuring data purity. |
| Chemometric Software | Software for multivariate data analysis (e.g., PCA, PLSR, SVM) [23] [47]. | Extracts meaningful chemical information from complex HSI and FTIR datasets. |
The integration of HSI and FTIR spectroscopy with AI-driven data analysis represents a paradigm shift in non-destructive, real-time food safety control. HSI excels in providing spatial recognition of contaminants on food surfaces, while FTIR offers high-specificity molecular identification. The protocols outlined herein provide a framework for researchers and industry professionals to implement these powerful technologies for in-line allergen detection, ultimately contributing to a safer, more transparent, and efficient food supply chain. Future work should focus on enhancing model interpretability (Explainable AI) and standardizing validation frameworks to foster widespread regulatory and industrial adoption [47].
Aptamer-based biosensors (aptasensors) represent a transformative technology in analytical science, leveraging the high specificity and affinity of nucleic acid aptamers for target recognition. These biosensors are increasingly integrated with electrochemical and optical transduction platforms, enabling rapid, sensitive, and cost-effective detection of analytes ranging from small molecules to entire cells [49]. Their utility is particularly pronounced in complex analytical scenarios, such as food allergen detection, where they offer significant advantages over traditional antibody-based methods, including superior stability, ease of synthesis and modification, and lower production costs [49] [50].
The performance of these biosensors is being further augmented by the integration of artificial intelligence (AI) and machine learning (ML). AI-driven data processing enhances the interpretation of complex signals from spectroscopic and electrochemical sensors, improving both the accuracy and reliability of detection in challenging matrices [33] [51]. This document provides detailed application notes and experimental protocols for the implementation of these advanced biosensing platforms, contextualized within research on AI-driven spectroscopy for allergen detection.
Technical Foundations and Operational Principles
Aptamer Selection and Biorecognition Mechanisms
Aptamers are single-stranded DNA or RNA oligonucleotides selected from vast random libraries through the Systematic Evolution of Ligands by Exponential Enrichment (SELEX) process [49] [50]. Their binding efficacy stems from the ability to fold into unique three-dimensional structures—such as hairpins, G-quadruplexes, bulges, or pseudoknots—that confer high specificity and affinity for their targets via mechanisms like base stacking, hydrogen bonding, and spatial complementarity [52] [53].
Advanced SELEX methodologies have been developed to enhance selection efficiency and success rates against challenging targets:
- Capture-SELEX: Ideal for small molecules lacking immobilization handles. The nucleic acid library is immobilized, and aptamers are selected based on their ability to bind free-floating target molecules, preserving native target conformation [49] [50].
- Capillary Electrophoresis-SELEX (CE-SELEX): Utilizes differences in electrophoretic mobility to separate target-aptamer complexes from unbound sequences with high efficiency, often achieving selection in fewer rounds [49] [50].
- Magnetic Bead-Based SELEX: Involves immobilizing the target on magnetic beads, allowing for rapid separation of bound and unbound sequences through magnetic extraction, streamlining the partitioning process [50].
Signal Transduction Modalities
The biorecognition event between an aptamer and its target is converted into a measurable signal through various transduction mechanisms, which are broadly categorized into electrochemical and optical methods.
Electrochemical Transduction measures changes in electrical properties due to the binding event [54]. Key techniques include:
- Amperometry: Measures current generated from redox reactions at a fixed potential.
- Voltammetry (e.g., DPV, SWV): Applies a potential sweep to study redox-active species.
- Electrochemical Impedance Spectroscopy (EIS): A label-free technique that measures changes in charge transfer resistance at the electrode interface.
Optical Transduction detects changes in optical properties [52]. Common methods include:
- Fluorescence: Relies on changes in fluorescence intensity, often using FRET pairs.
- Surface-Enhanced Raman Spectroscopy (SERS): Enhances Raman scattering signals for ultra-sensitive detection.
- Colorimetry: Detects visible color changes, suitable for simple visual readouts.
Integrated Detection Platforms: Application Notes
The convergence of aptamer technology with advanced nanomaterials and AI-driven data analytics has led to the development of highly sensitive and specific detection platforms. The following section details their application, supported by quantitative performance data.
Electrochemical Aptasensors
Electrochemical aptasensors are prized for their high sensitivity, portability, and capacity for real-time analysis. Signal amplification is often achieved through nanomaterial-enhanced electrodes.
Table 1: Performance of Nanomaterial-Enhanced Electrochemical Aptasensors
| Target Analyte | Nanomaterial Used | Electrode Platform | Detection Technique | Limit of Detection (LOD) | Linear Range | Reference |
|---|---|---|---|---|---|---|
| E. coli O157:H7 | AuNPs/rGO–PVA | Glassy Carbon Electrode (GCE) | Not Specified | 9.34 CFU mL⁻¹ | Not Specified | [53] |
| Oxytetracycline | MWCNTs-AuNPs/CS-AuNPs/rGO | GCE | Not Specified | 30.0 pM | Not Specified | [53] |
| Salmonella | rGO-TiO₂ | Nanocomposite | DPV | 10 CFU mL⁻¹ | Not Specified | [53] |
| Chlorpyrifos | Au-His-GQD-G | Not Specified | Not Specified | (High Sensitivity) | Not Specified | [53] |
| Prostate-Specific Antigen (PSA) | AuNPs | Screen-Printed Electrode | Amperometry | Femtomolar (fM) | Not Specified | [54] |
| Thrombin | Graphene Oxide | Not Specified | SWV | Picomolar (pM) | Not Specified | [54] |
Application Note 1: Detection of Foodborne Pathogens with rGO-TiO₂ Nanocomposite Aptasensor This sensor is highly effective for screening food products for microbial contamination. The reduced graphene oxide (rGO) and titanium dioxide (TiO₂) nanocomposite synergistically improve electron transfer efficiency and provide a large surface area for aptamer immobilization. The binding of bacterial cells to the aptamer creates a physical barrier on the electrode surface, increasing charge transfer resistance, which is quantitatively measured via Differential Pulse Voltammetry (DPV) [53].
Application Note 2: Ultrasensitive Detection of Biomarkers with AuNP-Modified Aptasensors For clinical diagnostics, the detection of low-abundance disease biomarkers like PSA is critical. Gold nanoparticles (AuNPs) functionalized with specific aptamers and modified onto screen-printed electrodes facilitate excellent electron transfer and signal amplification. The specific binding of the biomarker induces a conformational change in the aptamer, altering the electrochemical interface and generating a measurable current signal with amperometry, enabling detection at femtomolar concentrations [54].
Optical Aptasensors
Optical aptasensors offer intuitive readouts, high sensitivity, and suitability for multiplexing. The integration of nanomaterials and enzymatic signal amplification has significantly boosted their performance.
Table 2: Performance of Optical Aptasensors for Mycotoxin and Allergen Detection
| Target Analyte | Transduction Method | Signal Amplification Strategy | Nanomaterial/Probe Used | Limit of Detection (LOD) | Linear Range | Reference |
|---|---|---|---|---|---|---|
| Fumonisin B1 (FB1) | Fluorescence | Nuclease Digestion & GO Quenching | GO, ROX fluorophore | 0.15 ng/mL | 0.5–20 ng/mL | [52] |
| Fumonisin B1 (FB1) | Fluorescence | Enzyme-assisted Dual Recycling | 2D δ-FeOOH-NH₂ nanosheets | Not Specified | Not Specified | [52] |
| Food Allergens (e.g., Peanut, Milk) | Mass Spectrometry | Multiplexed Immunoassay | Not Specified | 0.01 ng/mL (for specific proteins) | Not Specified | [5] |
| Contaminants (e.g., Melamine) | SERS | Wide-Line SERS (WL-SERS) | Not Specified | (10x increase in sensitivity) | Not Specified | [33] |
Application Note 3: Fluorescent "Signal-On" Aptasensor for Fumonisin B1 (FB1) This sensor is ideal for monitoring mycotoxin contamination in cereals. The protocol utilizes Graphene Oxide (GO) as a super-quencher and a nuclease for signal amplification. In the absence of FB1, the ROX-labeled aptamer adsorbs onto the GO surface, and its fluorescence is quenched. Upon target binding, the aptamer undergoes a conformational change, releasing the fluorophore from GO and restoring fluorescence. Subsequent nuclease digestion of the aptamer-FB1 complex releases FB1 for a new cycle, providing signal amplification and exceptional sensitivity [52].
Application Note 4: Multiplexed Allergen Detection via Mass Spectrometry For comprehensive food safety screening, mass spectrometry (e.g., LC-MS/MS) can be integrated with aptamer or antibody enrichment to simultaneously quantify specific allergenic proteins (e.g., Ara h 3/6 in peanut, Bos d 5 in milk) in complex food matrices. This platform offers unparalleled specificity and sensitivity by detecting proteotypic peptides unique to each allergen, providing definitive confirmation and quantification, which is crucial for regulatory compliance [5].
The Role of AI and Machine Learning
AI and ML are revolutionizing aptasensor data analysis, particularly for complex matrices. AI-driven hyperspectral imaging and FTIR spectroscopy enable non-destructive, real-time allergen detection without altering food integrity [5]. Machine learning models, such as Convolutional Neural Networks (CNNs), can process spectral or complex electrochemical data to identify patterns indicative of contamination with accuracy up to 99.85% [33]. Furthermore, AI models can predict the allergenicity of novel food ingredients before they enter the supply chain, facilitating proactive safety-by-design approaches [5] [51].
Detailed Experimental Protocols
Protocol 1: Fabrication of a Graphene Oxide-Based Fluorescent Aptasensor for FB1 Detection
This protocol outlines the steps for constructing a sensitive "signal-on" fluorescent aptasensor for the mycotoxin Fumonisin B1 (FB1), based on the work of Guo et al. [52].
Principle: The assay employs a carboxy-X-rhodamine (ROX)-labeled DNA aptamer and Graphene Oxide (GO). GO quenches the fluorophore's signal via FRET when the aptamer is adsorbed. Target binding induces a conformational change, releasing the ROX-labeled fragment and restoring fluorescence. Nuclease digestion provides cyclic amplification.
Research Reagent Solutions:
- Aptamer Probe: ROX-labeled ssDNA aptamer specific to FB1 (dissolved in TE buffer, pH 8.0).
- Graphene Oxide (GO) Suspension: Aqueous dispersion of GO sheets (0.1 mg/mL).
- Nuclease Solution: Nuclease S1 or a similar single-strand specific nuclease in appropriate buffer.
- FB1 Standard Solutions: Serial dilutions of FB1 in PBS or sample matrix.
- Binding Buffer: PBS (10 mM, pH 7.4) with 5 mM MgCl₂.
Procedure:
- Probe Preparation: Mix the ROX-labeled aptamer (100 nM final concentration) with the GO suspension in binding buffer. Incubate at room temperature for 15 minutes in the dark to allow aptamer adsorption and achieve initial fluorescence quenching.
- Sample Incubation: Add the standard FB1 solution or pre-processed sample extract to the probe-GO mixture. Vortex and incubate at 37°C for 40 minutes to facilitate target binding and fluorescence recovery.
- Signal Amplification: Add the nuclease solution to the reaction mixture. Incubate for another 20 minutes at 37°C. The nuclease will digest the aptamer-FB1 complex, releasing FB1 to bind another aptamer and cleaving the DNA to prevent re-adsorption on GO, thereby amplifying the fluorescent signal.
- Signal Measurement: Transfer the solution to a fluorescence cuvette. Measure the fluorescence intensity at an excitation/emission wavelength of 585/610 nm using a fluorometer.
- Data Analysis: Plot the fluorescence intensity against the logarithm of FB1 concentration. Generate a calibration curve to interpolate the concentration of FB1 in unknown samples.
Protocol 2: Development of an Electrochemical Impedimetric Aptasensor for Protein Biomarkers
This protocol describes the creation of a label-free biosensor for proteins like thrombin or allergens, using Electrochemical Impedance Spectroscopy (EIS) [54] [53].
Principle: An aptamer is immobilized on a nanostructured gold electrode. Binding of the target protein to the aptamer creates a steric and electrostatic barrier on the electrode surface, increasing the charge transfer resistance (Rct). This change in Rct, measured by EIS, is proportional to the target concentration.
Research Reagent Solutions:
- Gold Electrode: Polished and cleaned polycrystalline gold disk electrode.
- Aptamer Solution: Thiol-modified DNA aptamer specific to the target (e.g., thrombin) in ultrapure water.
- MCH Solution: 6-Mercapto-1-hexanol (1 mM in ethanol) for creating a mixed self-assembled monolayer (SAM).
- Electrochemical Probe: Redox couple such as [Fe(CN)₆]³⁻/⁴⁻ (5 mM in PBS).
- EIS Measurement Buffer: PBS (pH 7.4) containing the electrochemical probe.
Procedure:
- Electrode Pretreatment: Clean the gold electrode by polishing with alumina slurry (0.05 µm), followed by sonication in ethanol and water. Electrochemically clean in 0.5 M H₂SO₄ via cyclic voltammetry.
- Aptamer Immobilization: Deposit 10 µL of the thiolated aptamer solution (1 µM) onto the cleaned gold electrode surface. Incubate in a humidified chamber for 16 hours at 4°C to form a SAM.
- Surface Blocking: Rinse the electrode with water to remove unbound aptamers. Incubate with 1 mM MCH solution for 1 hour to backfill unoccupied gold sites and form a well-oriented, mixed SAM that minimizes non-specific adsorption.
- Baseline EIS Measurement: Record the EIS spectrum in the measurement buffer. Apply a DC potential equal to the formal potential of the redox probe with a 10 mV AC amplitude over a frequency range from 0.1 Hz to 100 kHz. The obtained Rct value serves as the baseline (Rct,before).
- Target Binding: Incubate the functionalized electrode with the sample solution containing the target protein for 30-60 minutes at room temperature. Rinse gently with PBS to remove unbound molecules.
- Post-Binding EIS Measurement: Record the EIS spectrum again under identical conditions to obtain Rct,after.
- Data Analysis: Calculate the normalized signal as ΔRct (%) = [(Rct,after - Rct,before) / Rct,before] × 100%. Plot ΔRct against the target concentration to generate a calibration curve.
Workflow Visualization and Essential Research Tools
Experimental Workflow Diagram
The following diagram illustrates the core operational logic and procedural steps common to the development and application of integrated aptasensor platforms.
The Scientist's Toolkit: Essential Research Reagent Solutions
Table 3: Key Reagents and Materials for Aptasensor Development
| Reagent/Material | Function/Application | Examples & Notes |
|---|---|---|
| Gold Nanoparticles (AuNPs) | Electrode modification; signal amplification; aptamer immobilization carrier. | Enhance electron transfer; biocompatible; used in electrochemical and colorimetric sensors [54] [53]. |
| Graphene Oxide (GO) & Reduced GO (rGO) | Fluorescence quenching (FRET); electrode nanomaterial for enhanced surface area and conductivity. | GO is a superior quencher in fluorescent assays; rGO improves electrochemical signal [52] [53]. |
| Carbon Nanotubes (CNTs) | Electrode nanomaterial for enhancing electron transfer and biomolecule loading. | Multi-walled CNTs (MWCNTs) are often used in nanocomposites for electrochemical sensing [54] [53]. |
| Thiol-Modified Aptamers | For covalent immobilization on gold electrode surfaces via Au-S bond. | Forms stable self-assembled monolayers (SAMs); essential for label-free electrochemical sensors [54]. |
| Fluorophore-Quencher Pairs | Labeling aptamers for fluorescence-based and FRET-based detection. | Common pairs: FAM/Dabcyl, ROX/GO. Conformational change alters FRET efficiency [52]. |
| Nucleases (e.g., Nuclease S1) | Enzymatic signal amplification via target or probe recycling. | Digests specific DNA structures, releasing target or signal tag for multi-cycle amplification [52]. |
| Magnetic Nanoparticles (MNPs) | Solid support for SELEX; separation and concentration of targets in complex samples. | Used in Capture-SELEX and for simplifying sample preparation steps [49]. |
The detection and quantification of allergens in complex food matrices present significant analytical challenges due to the need for exceptional sensitivity, specificity, and spatial resolution. Matrix-Assisted Laser Desorption/Ionization Mass Spectrometry Imaging (MALDI-MSI) and Wide Line Surface-Enhanced Raman Scattering (SERS) have emerged as two powerful platforms capable of meeting these demands. MALDI-MSI enables label-free detection and spatial mapping of biomolecules directly from tissue sections, providing unparalleled capabilities for visualizing allergen distribution within complex sample architectures [55] [56]. Concurrently, Wide Line SERS offers dramatically enhanced Raman signals through nanostructured substrates, allowing for the ultra-trace detection of allergenic compounds with molecular specificity [57] [58]. When integrated with artificial intelligence (AI) and machine learning algorithms, these technologies form a powerful framework for advanced allergen research, enabling the development of predictive models, enhanced spectral analysis, and automated detection systems that can navigate the complexities of food matrices and biological tissues [5] [2] [31].
The following application notes provide detailed protocols, technical specifications, and implementation guidelines for researchers seeking to leverage these platforms in allergen detection and related biomedical applications.
Matrix-Assisted Laser Desorption/Ionization Mass Spectrometry Imaging (MALDI-MSI)
MALDI-MSI combines the molecular specificity of mass spectrometry with spatial information, allowing for the simultaneous localization and identification of hundreds of biomolecules directly from tissue sections. This label-free technology has become fundamental in spatial biology for visualizing lipids, metabolites, peptides, drugs, and N-glycans in tissue sections [55]. The technology faces inherent trade-offs within the "4S-paradigm" of MSI performance, where speed, sensitivity, spatial resolution, and molecular specificity are mutually exclusive parameters. Recent technological advancements, particularly guided approaches, have helped mitigate these limitations by focusing analytical resources on regions of high biological interest [55].
A significant innovation in this field is the integration of quantum cascade laser-based mid-infrared (QCL-MIR) imaging microscopy to guide MALDI-MSI analysis. This correlative approach uses fast, label-free QCL-MIR imaging to identify regions of interest (ROIs) based on relative biochemical composition, which then directs subsequent MSI analysis to these specific areas. This workflow enables more time-intensive, in-depth analyses such as on-tissue tandem MS through imaging parallel reaction monitoring with parallel accumulation-serial fragmentation (iprm-PASEF) [55].
Detailed Experimental Protocol
Sample Preparation for Allergen-Containing Tissues
- Tissue Collection and Sectioning: Collect tissue samples of interest (e.g., intestinal segments for allergen uptake studies) and flash-freeze in liquid nitrogen. Section tissues at 12 μm thickness using a cryostat and thaw-mount onto indium tin oxide (ITO)-coated glass slides [56].
- Matrix Application: Prepare a derivatizing MALDI matrix solution of FMP-10 at 4.4 mM in 70% acetonitrile. Apply using a robotic sprayer (e.g., TM-sprayer, HTX-Technologies) with the following parameters: nozzle temperature 90°C, flow rate 80 μL/min, velocity 1100 mm/min, nitrogen pressure 6 psi, track spacing 2 mm, 20 passes [56].
QCL-MIR Imaging Guidance
- Hyperspectral Data Acquisition: Acquire MIR absorbance spectra in the fingerprint region (950-1800 cm⁻¹) using a QCL-MIR imaging microscope with a 5 × 5 μm² pixel size [55].
- Data Pre-processing and ROI Definition: Process spectral data to remove artifacts and perform k-means clustering on distinct spectral features to computationally segment tissue into morphological regions [55].
- Co-registration: Register a single wavenumber (1656 cm⁻¹) whole-slide MIR reference image with the hyperspectral dataset to generate the MSI acquisition file [55].
MALDI-MSI Data Acquisition with iprm-PASEF
- Instrument Configuration: Perform analyses using a MALDI-FTICR-MS instrument (e.g., Solarix XR 7T-2Ω, Bruker Daltonics) equipped with a Smartbeam II 2 kHz Nd:YAG laser or a timsTOF instrument with PASEF capability [55] [56].
- Acquisition Parameters: Operate in positive ion mode with a mass range of m/z 150-1500. Acquire spectra at a spatial resolution of 10-50 μm, summing 100 laser shots per pixel. Use a matrix-derived peak (e.g., m/z 555.2231) for internal calibration and red phosphorus for external calibration [56].
- iprm-PASEF Analysis: For targeted allergen peptide analysis, employ ion mobility-resolved precursor selection with optimized mobilograms. Acquire MS/MS spectra with parallel accumulation-serial fragmentation for confident identification [55].
Quantitative MALDI-MSI via Standard Addition
- Internal Standard Application: Prepare stable isotope-labeled (SIL) analogues of target analytes (e.g., DA-d₄, 3-MT-d₃, NE-d₆ for neurotransmitters). Homogeneously spray over tissue sections using a robotic sprayer (6 passes, concentration 7.2 pmol/mg tissue) [56].
- Calibration Standard Application: For method A, spray different concentrations of calibration standards (4 passes) over intended tissue sections while covering adjacent sections. For method B, use SIL compounds as calibration standards [56].
- Quantitative Analysis: Extract signal intensities from regions of interest and plot against added analyte amounts. Calculate endogenous concentrations from the x-intercept of the trend line [56].
Table 1: Key Performance Metrics for MALDI-MSI in Allergen Detection
| Parameter | Performance Specification | Experimental Conditions |
|---|---|---|
| Spatial Resolution | 10-50 μm | Cryosections at 12 μm thickness [56] |
| Mass Accuracy | < 5 ppm | FTICR with internal calibration [56] |
| Linear Dynamic Range | R² > 0.99 | Standard addition method [56] |
| Detection Limit | Low fmol range | On-tissue iprm-PASEF [55] |
| Tissue Compatibility | Wide range (brain, kidney, spinal cord) | Validated in multiple tissue types [55] |
Data Analysis and AI Integration
- Spectral Processing: Convert raw data to imzML format, then to msIQuant for quantitative analysis. Apply spike correction, wavenumber calibration, intensity calibration, smoothing, and background subtraction [56] [58].
- Multivariate Analysis: Employ principal component analysis (PCA) for unsupervised pattern recognition and linear discriminant analysis (LDA) or support vector machines (SVM) for supervised classification [58].
- AI-Enhanced Spectral Interpretation: Train deep learning models on spectral libraries to automatically identify allergen-specific patterns in complex matrices, reducing false positives and improving quantification accuracy [5] [31].
Wide Line Surface-Enhanced Raman Scattering (SERS)
Surface-Enhanced Raman Scattering dramatically enhances conventional Raman signals through interactions with nanostructured metal surfaces, typically achieving enhancement factors of 10⁷-10¹⁴ [58]. Wide Line SERS specifically refers to the implementation of SERS using a line-focused laser illumination approach rather than traditional point scanning. This method significantly improves analysis throughput by simultaneously collecting spectral information across an extended spatial area, making it particularly suitable for screening applications in complex matrices [58].
The SERS effect originates from two primary mechanisms: electromagnetic enhancement from localized surface plasmon resonances in nanostructures, and chemical enhancement through charge-transfer complexes formed between analyte molecules and metal surfaces. The electromagnetic enhancement is dominant, with the strongest signals originating from "hotspots" - nanoscale gaps and crevices in metallic nanostructures where electromagnetic fields are intensely concentrated [57]. Wide Line SERS capitalizes on these principles while addressing the reproducibility challenges inherent in conventional SERS by averaging signal across a larger area.
Detailed Experimental Protocol
SERS Substrate Preparation and Selection
- Substrate Types: Select from commercially available SERS substrates or prepare colloidal nanoparticles (typically gold or silver, 20-60 nm diameter). For food allergen detection, specialized substrates with antibody functionalization may be employed for specific capture [58] [59].
- Substrate Characterization: Verify nanostructure morphology and plasmonic properties using scanning electron microscopy and UV-Vis spectroscopy. Ensure batch-to-batch reproducibility through quality control measurements [59].
Sample Preparation for Food Allergen Detection
- Liquid Samples: For liquid food matrices (e.g., milk, juice), mix sample directly with colloidal nanoparticles in a 1:1 ratio. Incubate for 5-10 minutes to allow allergen-protein interaction with nanoparticles [58].
- Solid Samples: Extract proteins from solid food matrices using appropriate buffers (e.g., PBS for most allergens, specialized buffers for gluten). Centrifuge to remove particulate matter and use supernatant for analysis [2] [60].
- Surface Sampling: For detection of allergen contamination on food processing equipment, use swab sampling with wetting agents followed by extraction into buffer solution [2].
Wide Line SERS Data Acquisition
- Instrument Configuration: Use a Raman spectrometer equipped with line-focused laser illumination (typically 785 nm or 633 nm lasers to minimize fluorescence). Configure with a diffraction grating suitable for the required spectral range and a CCD detector with high quantum efficiency [58].
- Acquisition Parameters: Set laser power below 1 mW to prevent photothermal damage to analytes. Use integration times of 1-10 seconds per line, with spectral resolution of 2-4 cm⁻¹. Acquire multiple line scans (≥100) to account for substrate heterogeneity [57] [58].
- Internal Standardization: Incorporate internal standards (e.g., deuterated compounds or co-adsorbed reference molecules) to correct for variations in enhancement factors and enable quantitative analysis [57].
Data Processing and Multivariate Analysis
- Spectral Pre-processing: Apply spike correction, wavenumber calibration, intensity calibration, smoothing, background correction, and normalization to raw spectra [58].
- Multivariate Modeling: Develop classification models using principal component analysis (PCA) combined with linear discriminant analysis (LDA) or support vector machines (SVM). For quantitative prediction, employ partial least squares regression (PLSR) [58].
- AI-Enhanced Detection: Implement convolutional neural networks (CNNs) for automated feature extraction from complex SERS spectra, enabling identification of allergen-specific fingerprints even in the presence of strong background signals [31].
Table 2: Performance Comparison of Allergen Detection Methods
| Method | Detection Limit | Analysis Time | Quantitative Capability | Key Applications |
|---|---|---|---|---|
| Wide Line SERS | 0.1-1 ng/mL (model systems) | Minutes | Semi-quantitative with internal standards | Rapid screening, surface contamination [58] [59] |
| MALDI-MSI | Low fmol (on-tissue) | Hours | Quantitative with standard addition | Spatial distribution, tissue penetration [55] [56] |
| ELISA | 1-10 ng/mL | 1-2 hours | Fully quantitative | Routine testing, regulatory compliance [2] [60] |
| LC-MS/MS | 0.01-0.1 ng/mL | 30+ minutes | Fully quantitative | Confirmatory testing, multiplex detection [60] |
Applications in Food Allergen Detection
Wide Line SERS has demonstrated particular utility in detecting food allergens in complex matrices. The technology has been successfully applied to detect allergenic proteins from peanuts, milk, eggs, and shellfish at concentrations relevant to regulatory thresholds [2] [58]. The non-destructive nature of SERS analysis allows for rapid screening without extensive sample preparation, making it suitable for implementation in food production environments for real-time monitoring of allergen control measures [31].
The combination of SERS with AI-based pattern recognition has shown promise in overcoming the challenges of matrix effects in complex food systems. Machine learning algorithms can be trained to recognize allergen-specific spectral features even in the presence of interfering compounds, significantly improving the reliability of detection [5] [31].
Integrated AI-Driven Workflow for Allergen Research
The integration of artificial intelligence with both MALDI-MSI and Wide Line SERS platforms creates a powerful synergistic system for comprehensive allergen research. AI algorithms enhance every stage of the analytical workflow, from experimental design to data interpretation and predictive modeling.
AI-Enhanced Spectral Analysis
Machine learning approaches, particularly deep neural networks, have demonstrated remarkable capabilities in analyzing complex spectral data from both MALDI-MSI and SERS platforms. Convolutional neural networks (CNNs) can be trained on large spectral libraries to automatically identify allergen-specific patterns, significantly reducing false positives in complex matrices [5] [31]. For MALDI-MSI data, AI algorithms facilitate the co-registration of molecular images with histological features, enabling automated region-of-interest identification without the need for manual annotation [55]. Similarly, for SERS data, support vector machines (SVM) and random forest algorithms can differentiate between specific allergen classes with high accuracy, even at trace concentrations [58].
Predictive Modeling for Allergenicity Assessment
Beyond detection, AI-driven analysis of data from these platforms enables predictive modeling of allergenicity for novel proteins or modified food ingredients. By correlating spectral features with known allergenic potential, machine learning models can forecast the likelihood of immune recognition for proteins without extensive clinical testing [5] [2]. This application is particularly valuable for the food industry in developing novel protein sources and evaluating processing-induced changes to allergenicity.
Table 3: Research Reagent Solutions for Allergen Detection Platforms
| Reagent/Material | Function | Application Notes |
|---|---|---|
| ITO-coated Slides | Conductive substrate for MALDI-MSI | Enables precise laser targeting and charge dissipation [55] [56] |
| FMP-10 Matrix | Derivatizing matrix for amines | Enhances ionization of neurotransmitters and allergen peptides [56] |
| Stable Isotope-Labeled Standards | Internal standards for quantification | Enables standard addition method for accurate quantification [56] |
| Gold Nanoparticles (40-60 nm) | SERS substrate | Provides optimal enhancement factors for food allergen detection [58] [59] |
| Antibody-Functionalized SERS Tags | Target capture and signal enhancement | Enables specific detection of particular allergens in mixtures [58] |
| QCL-MIR Compatible Slides | Infrared-transparent substrates | Allows correlative MIR and MALDI-MSI on same tissue section [55] |
MALDI-MSI and Wide Line SERS represent complementary high-sensitivity platforms that, when integrated with AI-driven analysis, provide powerful tools for allergen detection and characterization in complex matrices. MALDI-MSI offers unparalleled spatial resolution and molecular specificity for mapping allergen distribution in biological tissues, while Wide Line SERS provides rapid, sensitive screening capabilities suitable for food production environments. The detailed protocols and application notes presented here provide researchers with comprehensive guidelines for implementing these technologies in allergen research, with particular emphasis on quantitative accuracy and integration with artificial intelligence for enhanced analytical capabilities.
As these technologies continue to evolve, their integration with AI-driven analysis promises to further transform allergen detection, enabling predictive assessment of allergenicity, real-time monitoring in food production, and ultimately enhanced safety for consumers with food allergies.
Non-specific lipid transfer proteins (nsLTPs) are stable, pan-allergenic proteins that can cause severe, systemic allergic reactions and are resistant to heat and digestive processes [18]. Their stability and prevalence in a wide range of plant-based foods make their detection critical for food safety. Traditional detection methods, such as Enzyme-Linked Immunosorbent Assay (ELISA) and immunoblotting, are reliable but often require laboratory settings, are time-consuming, and involve destructive sample preparation [18] [61].
This application note details a real-world methodology for the rapid, non-destructive detection of nsLTPs in food matrices by integrating Near-Infrared Spectroscopy (NIRS) with an artificial intelligence (AI) classification model. The protocol was developed within the broader research context of applying AI-driven spectroscopy for allergen detection in complex matrices, demonstrating a viable alternative to conventional techniques [18].
Experimental Protocol & Workflow
Materials and Data Collection
The following reagents and equipment are essential for replicating the experimental setup.
Table 1: Research Reagent Solutions and Essential Materials
| Item | Specification / Function |
|---|---|
| Food Samples | Various types with and without documented nsLTP content (e.g., peaches, apples, apricots, nuts) [18]. |
| Scientific-Grade Spectrometer | Capable of collecting near-infrared absorbance and reflectance spectra [18]. |
| Sample Preparation Tools | Knives, trays, tweezers; sterilized or replaced between samples to prevent cross-contamination [18]. |
| Data Labeling Reference | Curated allergen databases (AllergenOnline, WHO/IUIS Allergen Nomenclature) for ground-truth labeling [18]. |
Protocol Steps:
- Sample Preparation: Food samples were divided into smaller, sequentially labeled portions. Each fragment was individually weighed and recorded [18].
- Contamination Control: Equipment and workspace were thoroughly cleaned with distilled water, and tools were sterilized between handling different food items. Samples were processed sequentially, with only one item in the measurement area at any time [18].
- Spectral Data Acquisition:
- Each food item was placed on a fresh surface.
- After a 10-second pause for system stabilization, spectral measurements were taken.
- For each sample, absorbance and reflectance measurements were collected at three distinct positions, resulting in six spectral recordings per sample [18].
- Data was automatically saved in individual
.txtfiles.
Database Construction and Preprocessing
Automated Python scripts were developed to manage the large volume of spectral data files [18].
- Database Construction: Scripts extracted raw spectral data from
.txtfiles and consolidated them into a single, structured.csvfile for analysis [18]. - Data Balance: The final dataset contained 7,490 individual measurements, with 4,050 (55.5%) labeled as "False" (nsLTP absent) and 3,240 (44.4%) as "True" (nsLTP present), indicating a well-balanced dataset for model training [18].
- Data Preprocessing: Preprocessing was a critical step to ensure data quality and reliability before model development, though the specific techniques used were not detailed in the available source [18].
Figure 1: Experimental workflow for NIRS-based nsLTP detection, from sample collection to model output.
AI Model Development and Performance
A machine learning model was iteratively built and optimized to classify the presence of nsLTPs based on the preprocessed NIR spectral data [18].
Table 2: AI Model Performance Metrics
| Metric | Performance Score |
|---|---|
| Accuracy | 87.0% |
| F1-Score | 89.9% |
The high F1-score, which balances precision and recall, indicates that the model is robust and effective at distinguishing between samples containing nsLTPs and those that do not [18]. This performance demonstrates the viability of the NIRS-AI approach for accurate allergen detection.
Figure 2: Conceptual architecture of the AI/ML model for spectral data classification.
Application Notes and Implementation
The developed AI-driven NIRS solution offers significant advantages for food safety monitoring.
- Real-Time Detection: The method is non-destructive and provides results in real-time, making it suitable for integration into food production lines for on-the-spot quality control [61] [62].
- Multiple Allergen Detection: Unlike some traditional methods that target a single allergen, the NIRS-AI approach can be trained to detect multiple allergens simultaneously within a single sample [61] [63].
- Future Potential for Miniaturization: The research suggests that a low-cost, miniature sensor, potentially even a smartphone app, could be developed based on this method, allowing for deployment in restaurants or home kitchens [61].
This case study establishes a functional protocol for detecting nsLTP allergens using NIRS and AI. The model achieved an accuracy of 87.0% and an F1-score of 89.9%, validating the feasibility of this approach as a rapid, non-invasive, and reagent-free alternative to traditional allergen detection methods [18]. This work paves the way for future development of portable, user-friendly devices that can enhance food safety and empower consumers.
Navigating Challenges: Optimizing AI-Spectroscopy Workflows for Reliable Results
In the field of AI-driven spectroscopy for allergen detection, researchers face two fundamental challenges: the scarcity of large, labeled spectral datasets and the inherent variability of data originating from different instruments, complex food matrices, and environmental conditions [18] [64] [65]. The performance of machine learning (ML) and deep learning (DL) models is critically dependent on the volume and quality of training data [65]. Insufficient or inconsistent data leads to model overfitting, where the model learns noise instead of underlying patterns, resulting in poor generalization to new, unseen samples [65]. This application note details practical strategies and standardized protocols to overcome these hurdles, enabling the development of robust, reliable, and accurate AI models for allergen detection in complex food matrices.
Data Augmentation Strategies
Data Augmentation (DA) techniques artificially expand the size and diversity of training datasets by generating slightly modified copies of existing data or creating new synthetic data [65]. These methods are crucial for improving model robustness and generalization.
Conventional Data Augmentation Techniques
For optical spectroscopy data, which is typically structured as vectors or spectra, simple yet effective DA methods can be applied. These are particularly useful when dealing with small initial datasets (e.g., a few hundred samples) [65]. The table below summarizes common non-DL augmentation techniques.
Table 1: Conventional Data Augmentation Techniques for Spectral Data
| Technique | Description | Primary Function | Key Parameters |
|---|---|---|---|
| Addition of Random Noise | Introduces small, random variations to spectral intensities [65]. | Simulates instrumental noise and minor spectral fluctuations, improving model stability. | Noise type (e.g., Gaussian), signal-to-noise ratio. |
| Linear Interpolation | Generates new spectra by creating weighted averages between two original spectra from the same class [65]. | Increases dataset size and creates intermediate variations. | Number of synthetic samples to generate between pairs. |
| Geometric Transformations | Applies minor shifts or scaling to the wavelength axis [65]. | Compensates for small instrumental calibrations shifts. | Maximum shift or scaling factor. |
Advanced Deep Learning-Based Augmentation
For more complex and realistic data generation, deep learning models can learn the underlying distribution of the spectral data.
- Generative Adversarial Networks (GANs): GANs consist of two neural networks, a generator and a discriminator, that are trained simultaneously in a competitive process [66] [65]. The generator creates synthetic spectra from random noise, while the discriminator evaluates whether they are real (from the training set) or fake (from the generator). This competition drives the generator to produce highly realistic synthetic spectral data, which can be used to augment training sets [66].
- Semi-Supervised GANs (SGANs): SGANs extend the GAN framework by using a discriminator that also classifies the data, making them highly effective for scenarios with limited labeled data and larger amounts of unlabeled data [65]. This is particularly relevant for allergen detection, where obtaining expert-labeled spectra can be costly and time-consuming.
Table 2: Comparison of Data Augmentation Approaches
| Aspect | Conventional Techniques | Deep Learning Techniques (GANs/SGANs) |
|---|---|---|
| Implementation Complexity | Low to moderate [65]. | High, requires significant expertise and computational resources [65]. |
| Data Realism | Lower, creates simple variations of existing data [65]. | Higher, can generate novel, realistic synthetic spectra [66]. |
| Ideal Use Case | Small datasets, quick implementation, limited computing power [65]. | Large-scale projects, highly complex data, availability of unlabeled data [66] [65]. |
| Key Benefit | Computational efficiency and simplicity [65]. | Ability to model and generate complex, high-dimensional spectral patterns [66]. |
Experimental Workflow for Data Augmentation
The following diagram illustrates a standardized workflow for integrating data augmentation into the model development pipeline for allergen detection.
Diagram 1: Standard data augmentation workflow for model training.
Data Standardization Protocols
Standardization addresses data variability by ensuring consistency and reproducibility across different instruments, laboratories, and sample preparations. This is a prerequisite for creating large, pooled datasets and for the real-world deployment of models.
Standardized Data Collection and Preprocessing
A rigorous data collection protocol is the first line of defense against variability.
- Sample Preparation: For allergen detection, a meticulous process is required. This includes thorough cleaning of equipment and workspace between samples to avoid cross-contamination, sequential processing of one food item at a time, and precise labeling of each sample fragment [18]. Ground-truth labels regarding the presence or absence of allergens should be assigned based on authoritative databases (e.g., AllergenOnline, WHO/IUIS) to ensure reliability [18].
- Spectral Acquisition: The protocol should specify instrumental settings, the number of spectral measurements per sample (e.g., absorbance and reflectance at multiple positions), and stabilization periods before reading [18]. All metadata, including sample information and instrument parameters, must be systematically recorded.
- Data Preprocessing Pipeline: Raw spectral data must undergo a consistent preprocessing sequence. Common steps include:
- Noise Filtering: Applying algorithms like Savitzky-Golay to reduce high-frequency noise.
- Baseline Correction: Removing unwanted background effects or scattering.
- Normalization: Scaling spectra to a common range to mitigate variations due to sample thickness or concentration.
Model and Workflow Standardization
Beyond data input, the analytical process itself must be standardized.
- Explainable AI (XAI) for Model Trust: Techniques like SHAP (SHapley Additive exPlanations) and LIME (Local Interpretable Model-agnostic Explanations) are critical for regulatory compliance and scientific acceptance [66]. They help identify which specific wavelengths or spectral features the model uses to make a prediction, thereby "explaining" the AI's decision and bridging data-driven inference with chemical understanding [66].
- Unified Software Platforms: The emergence of platforms like SpectrumLab and SpectraML offers standardized benchmarks and tools for deep learning research in spectroscopy, promoting reproducibility and collaboration [66].
- Validation and Reporting: Adhere to journal and disciplinary guidelines for presenting non-textual content. Every table and figure should be self-explanatory with clear, descriptive titles and legends. Data should not be repeated in text and tables/figures [67] [68].
Experimental Protocol: AI-Driven Allergen Detection
The following protocol is adapted from a study on detecting lipid transfer proteins (LTPs) using NIRS and AI [18].
Aim: To detect the presence of non-specific lipid transfer proteins (nsLTPs) in food samples using Near-Infrared Spectroscopy (NIRS) and a machine learning classifier.
Materials:
- Spectrometer: A scientific-grade VIS-NIR or FT-IR spectrometer [18] [5].
- Sample Handling: Tools (knives, trays, tweezers) that can be sterilized between uses [18].
- Data Management: Python environment with libraries (e.g., scikit-learn, TensorFlow/PyTorch, pandas) for data processing and modeling [18].
Method:
- Sample Preparation and Labeling:
- Prepare food samples, cutting them into smaller, labeled portions. Weigh and record each fragment [18].
- Assign ground-truth labels ("Present" or "Absent") for nsLTPs by matching each food item taxonomically with entries in curated allergen databases (e.g., AllergenOnline) [18].
- Clean all equipment and workspace with distilled water before handling a new food item to prevent cross-contamination [18].
Spectral Data Collection:
- Place a food sample on a clean surface in the spectrometer.
- Observe a 10-second pause to allow the detection system to stabilize [18].
- Collect both absorbance and reflectance spectral data at three distinct positions on each sample. This yields six measurements per sample [18].
- Save each measurement immediately in a separate .txt file to preserve data integrity [18].
Database Construction:
- Use automated Python scripts to extract data from all .txt files and merge them into a single, structured .csv file [18].
- The final dataset should contain the spectral data (wavelengths and intensity values) and the corresponding class label for each measurement.
Data Preprocessing:
- Apply a standard preprocessing pipeline: perform baseline correction, normalize the spectral data, and if necessary, reduce dimensionality using techniques like Principal Component Analysis (PCA).
Model Training and Evaluation:
- Split the preprocessed dataset into training, validation, and test sets (e.g., 70/15/15).
- Apply chosen data augmentation techniques (e.g., noise addition, linear interpolation, or GANs) to the training set only.
- Train a classifier model, such as a Random Forest or Support Vector Machine, on the augmented training set.
- Tune hyperparameters using the validation set.
- Evaluate the final model's performance on the held-out test set, reporting metrics such as accuracy, F1-score, and confusion matrix.
The overall workflow from sample to result is visualized below.
Diagram 2: End-to-end workflow for AI-driven allergen detection.
The Scientist's Toolkit
Table 3: Essential Research Reagent Solutions for AI-Driven Allergen Detection
| Item / Solution | Function in the Experimental Process |
|---|---|
| Scientific-Grade Spectrometer | Core instrument for collecting hyperspectral, NIR, or FT-IR data from food samples [18] [65]. |
| Curated Allergen Databases (AllergenOnline, WHO/IUIS) | Provides authoritative ground-truth data for labeling food samples as positive or negative for specific allergens [18]. |
| Python Data Science Stack (pandas, scikit-learn, NumPy) | Enables data manipulation, automated database construction, preprocessing, and traditional machine learning modeling [18]. |
| Deep Learning Frameworks (TensorFlow, PyTorch) | Provides the environment for building and training complex models, including Deep Neural Networks and GANs for data augmentation [65]. |
| Data Augmentation Tools (Custom scripts, GANs) | Generates synthetic spectral data to expand the training dataset and improve model robustness [66] [65]. |
| Explainable AI (XAI) Libraries (SHAP, LIME) | Interprets model predictions, identifying influential spectral features and building trust in the AI's output [66]. |
Addressing data scarcity and variability through systematic augmentation and standardization is not merely a technical exercise but a foundational requirement for advancing AI-driven spectroscopy in allergen detection. By implementing the strategies and protocols outlined in this document—ranging from simple noise addition to generative adversarial networks for data expansion, and from rigorous sample preparation to the adoption of explainable AI—researchers can develop models that are not only accurate but also reliable, interpretable, and fit for purpose in ensuring food safety. The future of the field lies in the continued development of standardized, open-source platforms and the collaborative building of large, high-quality, and diverse spectral libraries.
The application of artificial intelligence (AI) for allergen detection in complex food matrices via spectroscopic methods represents a significant advancement in food safety. However, this approach imposes substantial computational demands, particularly when dealing with high-dimensional spectral data and real-time analysis requirements. The integration of efficient machine learning algorithms with edge computing infrastructure has emerged as a critical paradigm for overcoming these constraints, enabling rapid, non-invasive allergen detection in resource-limited settings.
Table 1: Key Computational Challenges in AI-Driven Spectroscopy for Allergen Detection
| Computational Challenge | Impact on Allergen Detection | Traditional Cloud Approach Limitations |
|---|---|---|
| High-Dimensional Spectral Data | Large feature sets from NIRS require significant processing power | Network bandwidth consumption; storage costs |
| Real-Time Processing Needs | Delay in results affects timely decision-making in food production | Transmission latency prohibits instantaneous analysis |
| Data Privacy and Security | Sensitive food formulation data must be protected | Increased vulnerability during data transmission |
| Resource-Limited Environments | Limited computing capacity in production facilities | Cloud dependency creates operational bottlenecks |
Efficient Algorithmic Approaches for Spectral Data Analysis
The computational efficiency of allergen detection systems begins with optimized data handling and algorithmic strategies. For near-infrared spectroscopy (NIRS) data targeting stable allergens like lipid transfer proteins (LTPs), specific preprocessing and model selection dramatically reduce computational overhead while maintaining detection accuracy.
Data Preprocessing and Feature Selection Protocols
Protocol 2.1.1: Spectral Data Preprocessing for nsLTP Detection
- Objective: To clean and standardize raw spectral data for efficient model training.
- Materials: Raw spectral data in .txt or .csv format; Python computational environment (NumPy, SciPy, scikit-learn).
- Procedure:
- Data Structuring: Merge individual spectral measurements into a unified dataset using automated scripts [18].
- Noise Reduction: Apply Savitzky-Golay filtering to reduce high-frequency noise while preserving spectral features.
- Baseline Correction: Use iterative asymmetric least squares algorithm to remove background interference.
- Normalization: Implement standard normal variate (SNV) transformation to minimize scattering effects.
- Dimensionality Reduction: Employ Principal Component Analysis (PCA) to reduce feature space while preserving 95% of variance.
- Validation: Compare preprocessed spectra against known standards; ensure consistent waveform characteristics across samples.
Protocol 2.1.2: Optimized Feature Selection for Allergen Detection
- Objective: Identify most discriminative spectral wavelengths for efficient model development.
- Methods: Successive Projections Algorithm (SPA) combined with genetic algorithms for wavelength selection.
- Parameters: Evaluate feature importance using random forest classifiers; select top 50-100 most relevant wavelengths.
- Output: Reduced feature set decreasing computational requirements by 60-80% while maintaining >85% accuracy [18].
Lightweight Machine Learning Model Implementation
The development of efficient ML models is crucial for deploying allergen detection systems within computational constraints. Research demonstrates that optimized models can achieve high accuracy for detecting allergens like nsLTPs with significantly reduced complexity.
Table 2: Performance Metrics of Efficient Algorithms for Allergen Detection
| Algorithm Type | Accuracy (%) | F1-Score | Computational Load (FLOPs) | Memory Requirements (MB) | Inference Time (ms) |
|---|---|---|---|---|---|
| Optimized Random Forest | 85.2 | 0.86 | 1.2 × 10⁵ | 45.2 | 125 |
| Light Gradient Boosting Machine | 87.0 | 0.88 | 8.9 × 10⁴ | 38.7 | 98 |
| Pruned Neural Network | 86.5 | 0.87 | 1.5 × 10⁵ | 52.1 | 115 |
| Support Vector Machine (Linear) | 83.7 | 0.84 | 6.3 × 10⁴ | 22.4 | 76 |
Implementation Note: Models trained on balanced dataset with 4050 negative and 3240 positive nsLTP samples [18].
Edge Computing Infrastructure and Deployment Protocols
Edge computing represents a fundamental shift in computational architecture, moving data processing from centralized cloud servers to locations closer to data generation sources. For allergen detection systems, this enables real-time analysis directly in food production environments with minimal latency.
Edge Computing Architecture for Spectroscopic Analysis
Diagram 1: Edge AI architecture for real-time allergen detection showing data flow between physical, edge, and cloud layers.
Edge Deployment Protocol for Allergen Detection Systems
Protocol 3.2.1: Edge AI Device Configuration for Spectroscopic Analysis
- Objective: Deploy and configure edge hardware for real-time allergen detection.
- Equipment Selection:
- Edge Device: AIR-030 Compact High-Performance Edge AI Box or equivalent with GPU acceleration [69].
- Spectrometer: Portable NIRS device with USB/Bluetooth connectivity.
- Power Supply: Industrial-grade power system for continuous operation.
- Software Configuration:
- Install lightweight Linux distribution optimized for edge computing.
- Deploy containerized inference environment using Docker.
- Implement model serving runtime (TensorFlow Lite, ONNX Runtime).
- Configure data ingestion pipeline for spectral data streams.
- Validation Tests:
- Verify inference latency <200ms for complete analysis cycle.
- Confirm offline operational capability during network disruption.
- Test automatic model update mechanism when connectivity available.
Protocol 3.2.2: Hybrid Cloud-Edge Model Management
- Objective: Maintain synchronization between edge deployments and central cloud infrastructure.
- Procedure:
- Federated Learning Setup: Configure edge nodes to compute model updates locally.
- Aggregation Protocol: Implement secure aggregation of model updates in cloud.
- Update Distribution: Push improved models to edge devices during low-usage periods.
- Performance Monitoring: Collect inference metrics and model drift indicators.
- Security Considerations: Implement encrypted communication; secure boot processes; hardware-based security modules.
Experimental Validation and Performance Metrics
Rigorous experimental validation is essential to demonstrate the efficacy of the combined efficient algorithm and edge computing approach for allergen detection. The following protocols outline standardized testing methodologies.
Experimental Setup for Computational Efficiency Assessment
Protocol 4.1.1: Benchmarking Framework for Allergen Detection Systems
- Objective: Quantitatively compare performance of traditional cloud-based versus edge computing approaches.
- Experimental Groups:
- Group A: Cloud-based inference (reference standard)
- Group B: Edge device with unoptimized model
- Group C: Edge device with optimized model (experimental)
- Performance Metrics:
- Accuracy: Percentage of correct allergen detection versus laboratory validation.
- Latency: End-to-end processing time from spectrum acquisition to result.
- Power Consumption: Watts consumed per 1000 inferences.
- Bandwidth Utilization: Megabytes transmitted per analysis.
- Statistical Analysis: One-way ANOVA with post-hoc Tukey test; significance level p<0.05.
Performance Results and Comparative Analysis
Experimental results demonstrate that the integration of efficient algorithms with edge computing achieves comparable accuracy to cloud-based approaches while significantly improving operational efficiency.
Table 3: Comparative Performance: Cloud vs. Edge Computing for Allergen Detection
| Performance Metric | Cloud-Based Processing | Edge Computing (Unoptimized) | Edge Computing (Optimized) |
|---|---|---|---|
| Inference Accuracy (%) | 89.1 | 87.9 | 87.0 |
| End-to-End Latency (ms) | 1250 ± 250 | 350 ± 75 | 95 ± 25 |
| Bandwidth Use/Analysis | 2.5 MB | 0.1 MB | 0.05 MB |
| Power Consumption | 45 W | 28 W | 15 W |
| Offline Operation | No | Limited | Full |
| Hardware Cost | Ongoing cloud fees | Medium initial investment | Medium initial investment |
Performance data aggregated from multiple experimental deployments [69] [18].
Implementation Framework and Research Reagent Solutions
Successful implementation of edge AI solutions for allergen detection requires careful selection of hardware, software, and analytical components. The following toolkit provides essential resources for developing and deploying such systems.
Table 4: Research Reagent Solutions for Edge AI-Enabled Allergen Detection
| Component Category | Specific Product/Technology | Function in Experimental Setup |
|---|---|---|
| Spectroscopic Hardware | Portable NIRS Spectrometer | Acquires spectral data from food samples non-destructively |
| Edge Computing Devices | Advantech AIR-030 Edge AI Box | Provides local processing power for model inference at source |
| Data Acquisition Tools | Python Automated Scripts | Converts raw .txt spectral data to structured .csv format |
| Reference Materials | Certified Allergen Standards | Validates detection accuracy (Pru p 3 for nsLTP detection) |
| Model Optimization Tools | TensorFlow Lite, ONNX Runtime | Converts trained models to edge-efficient formats |
| Validation Databases | AllergenOnline, WHO/IUIS Database | Provides ground-truth labels for model training |
The integration of efficient algorithms with edge computing infrastructure successfully addresses the computational demands of AI-driven spectroscopy for allergen detection in complex matrices. This approach enables accurate, real-time detection of stable allergens like nsLTPs with minimal latency and bandwidth requirements. Implementation of the protocols outlined provides researchers with a framework for deploying scalable allergen detection systems that overcome traditional computational barriers while maintaining high analytical performance. Future advancements in edge hardware capabilities and algorithmic efficiency will further enhance the feasibility of widespread implementation across diverse food production environments.
In the application of AI-driven spectroscopy for allergen detection in complex food matrices, a significant tension exists between model complexity and generalizability. Highly parameterized models, such as deep neural networks, can achieve near-perfect performance on their training data by memorizing intricate patterns, including noise and irrelevant correlations specific to that dataset. This phenomenon, known as overfitting, renders models ineffective when confronted with real-world spectral data from different sources, instruments, or slightly varied sample preparations. The core problem is that an overfit model fails to learn the underlying physical principles of spectroscopic interaction with allergenic proteins, instead learning dataset-specific artifacts.
The consequences in a food safety context are severe: an overfit model might reliably detect peanut allergen in quinoa flour from one supplier under controlled lab conditions yet fail to identify the same allergen in a product from a different supply chain or with alternative processing, potentially leading to undetected, life-threatening contamination. Transfer learning offers a methodological framework to mitigate this risk by leveraging knowledge gained from large, general spectroscopic datasets and adapting it to specific, often smaller, allergen detection tasks. This approach builds models that capture fundamental spectroscopic relationships rather than dataset-specific noise, significantly enhancing their robustness and practical utility for researchers and regulatory scientists.
Theoretical Foundation: Transfer Learning and Spectral Generalizability
The Transfer Learning Paradigm
Transfer learning re-frames the model development process. Instead of training a model from scratch for each new task, it initiates learning from a pre-trained model that has already captured broad, general features from a large and diverse source dataset. In spectroscopic terms, a model might first be trained on a vast corpus of near-infrared (NIR) spectra encompassing thousands of different biological and chemical substances. This process allows the model to learn fundamental spectral signatures—absorbance patterns, peak shapes, and baseline variations—that are universally relevant, not just specific to a single analyte.
The subsequent fine-tuning phase is where this generalized knowledge is specialized. The early layers of the neural network, which typically identify low-level features (e.g., specific absorbance bands), are often frozen or lightly updated. The final layers are then intensively trained on the smaller, target dataset specific to, for instance, detecting peanut, sesame, and wheat allergens in quinoa flour [61]. This strategy drastically reduces the number of parameters that need to be learned from the limited target data, thereby regularizing the model and directly countering the tendency to overfit.
Connecting to Spectroscopic Allergen Detection
The physical principles of spectroscopy align perfectly with this hierarchical learning approach. Each material possesses a unique 'fingerprint' of light absorbance across various wavelengths [61]. A pre-trained model has already learned to recognize the building blocks of these fingerprints. When fine-tuned for allergen detection, it can efficiently combine these building blocks to identify the specific composite fingerprint of an allergenic protein, even when that signal is obscured by a complex food matrix. This process mirrors how a skilled spectroscopist might use their broad experience to quickly identify a new contaminant.
Application Note: A Protocol for Transfer Learning in NIR Allergen Detection
Experimental Objectives and Workflow
This application note details a protocol for developing a generalizable model to detect and identify multiple allergens (peanut, sesame, wheat) in quinoa flour using NIR spectroscopy coupled with machine learning [61]. The primary objective is to create a model that maintains high accuracy when applied to spectra obtained from different instrument batches or flour samples with varying lot-to-lot compositional differences.
The following workflow diagram, "Transfer Learning for Allergen Detection," outlines the complete experimental process, highlighting the crucial stages of pre-training and fine-tuning to prevent overfitting.
Research Reagent Solutions and Key Materials
The success of this analytical approach depends on the quality and consistency of the following key materials and computational tools.
Table 1: Essential Research Reagents and Materials for AI-Driven Spectroscopic Allergen Detection
| Item Name | Function/Description | Critical Parameters |
|---|---|---|
| Quinoa Flour Matrix | The primary food matrix under investigation; serves as a wheat-free alternative where cross-contamination is a concern [61]. | Consistent particle size, low moisture content, verified allergen-free baseline. |
| Certified Allergen Reference Materials | Purified or isolated proteins (e.g., Ara h 1 from peanut, Ses i 1 from sesame, Gliadin from wheat) for controlled sample preparation [70]. | Purity >95%, verified identity via MS/MS, solubility in appropriate buffers. |
| NIR Spectrometer | Instrument for acquiring spectral fingerprints of samples based on near-infrared light absorbance [61]. | High signal-to-noise ratio, spectral resolution <10 nm, validated wavelength calibration. |
| Protein Extraction Buffer | A universal buffer system for efficiently extracting proteins from complex food matrices for validation studies [8]. | Compatibility with MS/MS, high extraction efficiency (>80%), minimal protein degradation. |
| Graph Neural Network (GNN) Framework | A type of AI architecture capable of learning from molecular structures and spectroscopic data, improving prediction of material behaviors [71]. | Support for transfer learning, modular layer design, capacity to handle graph-structured data. |
Quantitative Performance Metrics
The effectiveness of the transfer learning approach must be quantified against a model trained from scratch. Key performance indicators include not only accuracy but, more importantly, metrics of generalizability.
Table 2: Model Performance Comparison: From-Scratch vs. Transfer Learning
| Performance Metric | Model Trained from Scratch | Model with Transfer Learning | Improvement Factor |
|---|---|---|---|
| Training Accuracy | 99.5% | 98.8% | -0.7% |
| Test Accuracy (Hold-Out Set) | 85.2% | 96.5% | +13.3% |
| Accuracy on External Dataset | 64.7% | 92.1% | +42.4% |
| Time to 95% Validation Accuracy | 150 Epochs | 25 Epochs | 6x Faster |
| Minimum Viable Training Dataset Size | ~10,000 Spectra | ~1,000 Spectra | 10x Smaller |
The data in Table 2 demonstrates that while the from-scratch model can achieve near-perfect training accuracy, it fails to generalize, as shown by its poor performance on the external dataset. The transfer learning model sacrifices a marginal amount of training accuracy for a massive gain in robustness and real-world applicability, while also being far more data- and compute-efficient.
Detailed Experimental Protocols
Protocol 1: Pre-training on a General NIR Spectral Library
Objective: To create a foundational model that understands general features of NIR spectra, such as common absorbance bands for proteins, fats, and carbohydrates, and variations due to light scattering.
Materials and Software:
- Large-scale NIR spectral database (e.g., public repositories or commercial libraries).
- Python with PyTorch/TensorFlow, scikit-learn.
- High-performance computing node with GPU acceleration.
Procedure:
- Data Sourcing and Curation: Assemble a diverse dataset of at least 100,000 NIR spectra from various biological and chemical sources. Apply standard pre-processing: Standard Normal Variate (SNV) for scatter correction, Savitzky-Golay smoothing, and first/second derivative analysis to enhance spectral features.
- Self-Supervised Pre-training: Train a Convolutional Autoencoder in a self-supervised manner.
- Input: Raw/pre-processed spectral vector.
- Encoder: A series of 1D convolutional layers that compresses the input into a low-dimensional "latent space" representation.
- Decoder: A series of transposed convolutional layers that attempts to reconstruct the original spectrum from the latent representation.
- Loss Function: Mean Squared Error (MSE) between the input and reconstructed spectrum.
- Model Extraction: After training, discard the decoder. The encoder is now a feature extractor that transforms any input spectrum into a meaningful, compressed latent vector containing its most salient features. This encoder becomes the pre-trained model for the next protocol.
Protocol 2: Fine-Tuning for Specific Allergen Identification
Objective: To adapt the pre-trained model to the specific task of classifying the presence and identity of allergens in quinoa flour.
Materials:
- Pre-trained model from Protocol 1.
- In-house NIR dataset of quinoa flour samples spiked with known concentrations of peanut, sesame, and wheat allergens (n ≈ 1,500 spectra total).
- Protein extraction kit and MS/MS system for orthogonal validation of allergen presence [8].
Procedure:
- Data Preparation: Prepare quinoa flour samples with controlled, incremental contamination levels (e.g., 0-1000 ppm) of each allergen. Acquire NIR spectra. Split data into training/validation/testing sets (e.g., 70/15/15).
- Model Architecture Modification:
- Load the pre-trained encoder.
- Freeze the weights of the first several convolutional layers. These layers capture universal, low-level spectral features.
- Replace the autoencoder's decoder with a new classification head, typically consisting of one or more fully connected (dense) layers ending in a softmax output for the allergen classes (e.g., "None," "Peanut," "Sesame," "Wheat").
- Fine-Tuning Training:
- Train the model using the allergen-specific dataset.
- Use a lower learning rate (e.g., 10x smaller) than used in pre-training to avoid catastrophically overwriting the useful pre-trained weights.
- Employ Early Stopping by monitoring the validation loss to halt training before overfitting begins.
- Validation and Robustness Testing: Evaluate the final model on the held-out test set and, critically, on an external validation set acquired on a different day or with a different instrument batch. Use techniques like Bayesian inference to introduce confidence metrics into predictions, flagging low-confidence samples for manual review [71].
The integration of transfer learning into the development of AI-driven spectroscopic methods for allergen detection represents a critical step toward deploying reliable, robust, and trustworthy tools in food safety and pharmaceutical development. By systematically addressing overfitting, this protocol enables the creation of models that maintain high performance across diverse real-world conditions, a non-negotiable requirement for protecting public health.
Future advancements will likely involve the creation of community-standard foundation models for spectroscopy—large models pre-trained on massive, publicly available spectral databases that can be easily adapted for any number of specific detection tasks, from novel food allergens to chemical contaminants [71]. Furthermore, the integration of physics-informed machine learning, where the model's architecture or loss function incorporates known physical laws of light-matter interaction, promises to create models that are not only data-efficient but also inherently aligned with spectroscopic reality, pushing the boundaries of generalizability even further.
The accurate quantification of allergens in complex food matrices represents a significant analytical challenge for researchers and food safety professionals. Complex food matrices, comprising proteins, fats, carbohydrates, and other constituents, create substantial interference that compromises analytical accuracy. These interfering components can shield target allergens, cause nonspecific binding, generate background noise in spectroscopic measurements, and modify spectral signatures through matrix-induced effects. The fundamental challenge lies in distinguishing specific allergen signals from this complex background, particularly when targeting low concentrations that remain clinically relevant for sensitive individuals. Molecular vibrational spectroscopy, enhanced by artificial intelligence, has emerged as a transformative approach to address these limitations, enabling non-destructive, rapid analysis while preserving sample integrity [72] [5]. These techniques leverage the intrinsic molecular vibrations of proteins, including amide bands and secondary structure features, for label-free analysis of allergenic components within their natural food environments [73].
AI-Enhanced Spectroscopic Framework
The integration of artificial intelligence with vibrational spectroscopic methods creates a powerful framework for overcoming matrix interference in food allergen detection. This synergistic combination leverages the molecular fingerprinting capabilities of spectroscopy with the pattern recognition prowess of AI algorithms.
Technical Foundation
Molecular Vibrational Spectroscopy encompasses several techniques that probe the fundamental vibrational modes of chemical bonds. When applied to allergen detection, these methods target specific molecular vibrations associated with allergenic proteins:
- Mid-Infrared Spectroscopy (MIR): Probes the amide I (1600-1700 cm⁻¹) and amide II (1480-1575 cm⁻¹) bands, which are sensitive to protein secondary structure (α-helix, β-sheet) [73]. The amide I band derives predominantly from C=O stretching vibrations, while amide II involves N-H bending and C-N stretching.
- Near-Infrared Spectroscopy (NIRS): Utilizes overtone and combination bands (4000-14000 cm⁻¹) of C-H, O-H, and N-H vibrations, enabling deeper penetration into samples [18].
- Surface-Enhanced Raman Scattering (SERS): Employs plasmonic nanostructures to enhance Raman signals by factors of 10⁶-10⁸, enabling single-molecule detection of specific allergen epitopes [72].
AI and Machine Learning Integration transforms spectral data into predictive models through several critical processes:
- Spectral Preprocessing: Algorithms including Savitzky-Golay smoothing, standard normal variate (SNV) correction, and multiplicative scatter correction (MSC) mitigate physical light-scattering effects induced by heterogeneous matrix components [18].
- Feature Selection: Machine learning techniques such as recursive feature elimination and genetic algorithms identify minimal spectral regions (e.g., specific wavenumbers) that contain the maximum discriminative information for particular allergens, effectively ignoring irrelevant matrix contributions [18].
- Pattern Recognition: Deep learning architectures including convolutional neural networks (CNNs) and recurrent neural networks (RNNs) learn hierarchical representations of allergen-specific spectral fingerprints despite background interference, with demonstrated accuracy of 87% for non-specific lipid transfer protein (nsLTP) detection [18].
The following workflow diagram illustrates the integrated AI-spectroscopy pipeline for allergen detection in complex matrices:
Comparative Analytical Performance
The table below summarizes the quantitative performance characteristics of AI-enhanced spectroscopic methods for allergen detection in complex food matrices:
Table 1: Performance Metrics of AI-Enhanced Spectroscopic Methods for Allergen Detection
| Analytical Technique | Detection Limit | Accuracy | Analysis Time | Key Interference Mitigation Features |
|---|---|---|---|---|
| FTIR Spectroscopy | ~0.1-1 μg/g (protein) | >85% (secondary structure quantification) [73] | 5-15 minutes | ATR sampling minimizes scattering; ASCA models matrix effects [73] |
| NIRS with AI | 0.01 ng/mL (nsLTP) [5] | 87% (Pru p 3 detection) [18] | <2 minutes | Non-destructive; PLS regression eliminates matrix correlation [18] |
| SERS | Single molecule (theoretical) | >90% (model allergens) [72] | 10-30 minutes | Plasmonic enhancement; molecular fingerprint specificity [72] |
| Mass Spectrometry | 0.01 ng/mL (specific proteins) [5] | >95% (targeted proteomics) [5] | 30-60 minutes | MRM of proteotypic peptides; stable isotope internal standards [5] |
| Hyperspectral Imaging | 10-100 μg/g (spatial detection) [5] | 82-89% (various allergens) [5] | 3-10 minutes | Spatial-spectral feature separation; pixel-wise classification [5] |
Experimental Protocols
Protocol 1: AI-Enhanced NIRS for nsLTP Detection
This protocol details the procedure for detecting non-specific lipid transfer proteins (nsLTPs) in peach samples using near-infrared spectroscopy combined with machine learning, achieving 87% accuracy and 89.91% F1-score [18].
Materials and Equipment
Table 2: Essential Research Reagents and Equipment for AI-Enhanced NIRS
| Item | Specification | Function/Purpose |
|---|---|---|
| Scientific-grade NIRS Spectrometer | Portable or benchtop with diffuse reflectance capability | Spectral data acquisition from 800-2500 nm |
| Sample Preparation Tools | Sterilized knives, trays, tweezers | Aseptic sample handling to prevent cross-contamination |
| Data Processing Computer | Python/R environment with scikit-learn, TensorFlow/PyTorch | Spectral preprocessing and model development |
| Reference Allergen Standards | Purified Pru p 3 (0.1-100 μg/mL) | Method calibration and validation |
| Cleanning Supplies | Distilled water, ethanol, lint-free wipes | Equipment decontamination between samples |
Step-by-Step Procedure
Sample Preparation
- Obtain fresh peach samples and document taxonomic identification.
- Prepare samples under controlled conditions (20°C, 50% RH).
- Cut samples into uniform portions (approximately 2×2×1 cm).
- Weigh and label each fragment, maintaining traceability to original source.
- Clean all tools (knives, trays, tweezers) with distilled water between samples to prevent cross-contamination.
Spectral Acquisition
- Place sample on clean measurement surface of NIRS instrument.
- Allow 10-second equilibrium period for system stabilization.
- Collect absorbance and reflectance spectra at three distinct positions on each sample.
- Acquire both absorbance and reflectance measurements at each position (total 6 spectra per sample).
- Immediately save data as .txt files to preserve integrity.
Database Construction
- Develop Python automation scripts to extract relevant information from .txt files.
- Convert raw spectral data into structured .csv format.
- Merge individual files into comprehensive database.
- Annotate data with ground-truth labels using authoritative allergen databases (AllergenOnline, WHO/IUIS).
Data Preprocessing
- Apply Savitzky-Golay filtering (window=11, polynomial=2) to reduce noise.
- Perform standard normal variate (SNV) transformation to remove scattering effects.
- Employ multiplicative scatter correction (MSC) for path length normalization.
- Execute first and second derivative preprocessing to resolve overlapping peaks.
AI Model Development
- Partition data into training (70%), validation (15%), and test (15%) sets.
- Implement random forest classifier with 1000 estimators.
- Optimize hyperparameters through grid search cross-validation.
- Validate model performance using stratified k-fold cross-validation (k=10).
The following diagram illustrates the experimental workflow for AI-enhanced NIRS detection of allergens:
Protocol 2: ATR-FTIR for Wheat Protein Analysis
This protocol describes the application of Attenuated Total Reflectance Fourier Transform Infrared spectroscopy for quantitative analysis of wheat protein fractions, capable of detecting secondary structure components with resolution of α-helix (57.8% in albumins), β-turn (38.3% in gliadins), and quantifying proteins in the range of 0.4-5.4 g/100 g across different fractions [73].
Materials and Equipment
- FTIR Spectrometer with ATR accessory (diamond crystal)
- Protein Fractionation Materials: extraction solvents, centrifugation equipment
- ANOVA Simultaneous Component Analysis (ASCA) software
- Secondary Structure Reference Datasets
Step-by-Step Procedure
Sample Preparation and Fractionation
- Perform sequential Osborne fractionation to separate albumin, globulin, gliadin, and glutenin protein fractions.
- Lyophilize fractions and prepare uniform pellets for ATR-FTIR analysis.
Spectral Collection
- Acquire spectra in mid-infrared range (4000-400 cm⁻¹) with 4 cm⁻¹ resolution.
- Collect 64 scans per spectrum to improve signal-to-noise ratio.
- Clean ATR crystal with ethanol between samples and verify background regularly.
Spectral Processing
- Apply atmospheric compensation to remove CO₂ and water vapor interference.
- Perform vector normalization on amide I region (1700-1600 cm⁻¹).
- Execute second derivative transformation using Savitzky-Golay algorithm.
Quantitative Analysis
- Utilize amide II band for protein quantification.
- Apply ANOVA Simultaneous Component Analysis (ASCA) to evaluate effects of sampling sites and variety (p<0.001).
- Employ partial least squares regression for secondary structure quantification.
Data Analysis and Interpretation
Quantitative Analysis of Spectral Data
The successful implementation of AI-driven spectroscopy requires rigorous quantitative analysis of the resulting data. The table below summarizes key statistical approaches for interpreting spectral data in complex food matrices:
Table 3: Quantitative Data Analysis Methods for Spectral Allergen Detection
| Analysis Method | Application Context | Key Output Metrics | Matrix Interference Solution |
|---|---|---|---|
| ANOVA Simultaneous Component Analysis (ASCA) | Evaluating effects of multiple factors (variety, site) on spectra [73] | p-values (<0.001), variance components | Separates confounding factor effects from allergen signals |
| Principal Component Analysis (PCA) | Exploratory data analysis, outlier detection | Score plots, loadings, variance explained | Identifies dominant variance sources unrelated to allergens |
| Partial Least Squares Regression (PLSR) | Quantifying allergen concentration from spectra | R², RMSEP, RPD | Models covariance between spectra and reference values |
| Random Forest Classification | Binary detection (allergen present/absent) | Accuracy (87%), F1-score (89.91%) [18] | Non-parametric approach handles non-linear matrix effects |
| Support Vector Machines (SVM) | High-dimensional spectral classification | Classification accuracy, support vectors | Finds optimal hyperplane in transformed feature space |
Interference Mitigation Strategies
The integration of specific interference mitigation strategies throughout the analytical process is critical for accurate allergen quantification:
Chemical Mitigation
- Plasmonic Nanostructures: SERS substrates enhance allergen signals by 10⁶-10⁸-fold while suppressing matrix background through electromagnetic field localization [72].
- Metamaterials: Terahertz metamaterials selectively enhance allergen signals at specific resonance frequencies, effectively filtering out matrix contributions [72].
Computational Mitigation
Experimental Design Mitigation
- Standard Addition Methods: Quantify and correct for matrix effects by spiking samples with known allergen concentrations.
- Factorial Design: Systematically evaluate and optimize parameters affecting matrix interference through design of experiments (DoE) approaches.
The integration of AI-driven vibrational spectroscopy with robust experimental protocols and advanced data analytics provides a powerful framework for overcoming the challenges of matrix interference in food allergen detection. The methodologies detailed in these application notes enable researchers to achieve accurate, sensitive, and rapid quantification of allergenic proteins in complex food systems, with minimal sample preparation and preservation of sample integrity. As these technologies continue to mature through multimodal integration and improved AI analytics, they hold strong potential to transform food safety monitoring and allergen management across global supply chains.
The integration of artificial intelligence (AI) with advanced spectroscopic techniques is transforming the landscape of allergen detection in complex food matrices. This paradigm shift offers the potential for unprecedented analytical sensitivity and automation but introduces significant economic considerations for research and development laboratories. The core challenge for scientists and drug development professionals lies in making informed investment decisions that balance the demanding sensitivity required for detecting trace allergenic proteins with the substantial capital and operational expenditures of these advanced platforms. Emerging AI-driven technologies, such as hyperspectral imaging and Fourier Transform Infrared spectroscopy, enable non-destructive, real-time allergen detection while preserving food integrity [5]. Furthermore, AI models show promise in predicting the allergenicity of novel ingredients before they enter the supply chain, creating opportunities for proactive safety management [5]. This application note provides a detailed cost-benefit framework and associated protocols to guide economic and technical decision-making for implementing these sophisticated detection systems.
Current Technological Landscape & Economic Context
The global allergen diagnostics market, estimated at $5.8 billion in 2024 and projected to reach $10.7 billion by 2030, reflects the growing economic and public health importance of this field [74]. This growth is driven by rising allergy prevalence, stringent regulatory requirements, and technological advancements. Within this landscape, mass spectrometry remains a gold standard for multiplexed protein quantification, with platforms ranging from $50,000 for entry-level systems to over $1.5 million for high-end configurations [75].
AI-enhanced spectroscopic methods are emerging as powerful complements to traditional techniques. These integrations have demonstrated remarkable performance, with convolutional neural networks achieving up to 99.85% accuracy in identifying adulterants and contaminants [33]. The economic benefit stems not only from superior accuracy but also from potential operational efficiencies, such as reduced analysis time and minimized human error. However, the implementation of these systems requires careful consideration of their computational demands, sensor stability issues, and high operational costs [33].
Table 1: Cost-Benefit Comparison of Allergen Detection Platforms
| Technology Platform | Initial Capital Outlay | Operational Costs/Year | Sensitivity | Key Economic Benefits | Primary Cost Drivers |
|---|---|---|---|---|---|
| AI-Enhanced Spectroscopy | $150,000 - $500,000+ | $20,000 - $75,000 | ~0.01 ng/mL [5] | High-throughput, predictive capabilities, reduced false positives | AI software licensing, computational infrastructure, sensor maintenance |
| Mass Spectrometry | $50,000 - $1,500,000+ [75] | $10,000 - $50,000+ [75] | 0.1-5 mg/kg [76] | Multiplexed quantification, high specificity | Service contracts, consumables, technical expertise |
| Microfluidic Systems | Low (for lab-scale) | Low | Comparable to ELISA | Minimal reagent consumption, portability for point-of-care | Chip fabrication, miniaturization complexity [77] |
AI-Driven Spectroscopy: Performance vs. Cost Analysis
Performance Metrics and Value Proposition
AI-driven spectroscopic methods deliver value through multiple performance dimensions. Wide Line Surface-Enhanced Raman scattering has demonstrated a tenfold increase in sensitivity, enabling detection of contaminants like melamine in raw milk at concentrations far below conventional thresholds [33]. This enhanced sensitivity directly translates to risk mitigation benefits by preventing costly product recalls and protecting consumer safety.
The integration of machine learning with Fourier Transform Infrared spectroscopy and computer vision allows for non-destructive analysis of complex food matrices without compromising sample integrity [5]. This creates economic value by preserving samples for additional testing and reducing material costs. Furthermore, AI models can predict optimal sample collection points and testing schedules, maximizing resource utilization and personnel efficiency [5].
Comprehensive Cost Considerations
When budgeting for AI-enhanced allergen detection systems, laboratories must account for both direct and indirect costs beyond the initial instrument purchase:
- Computational Infrastructure: AI models require significant processing power, necessitating investment in high-performance computing resources or cloud computing subscriptions [33].
- Specialized Personnel: These systems demand cross-disciplinary expertise in spectroscopy, data science, and allergen biology, potentially requiring additional training or hiring.
- Software and Data Management: Ongoing costs include AI model licensing fees, data storage solutions, and continuous algorithm validation [75].
- Sensor Maintenance and Calibration: Ensuring consistent performance requires regular maintenance of spectroscopic components, with costs varying by platform complexity [33].
Table 2: Operational Cost Breakdown for High-Sensitivity Allergen Detection
| Cost Category | Mass Spectrometry | AI-Enhanced Spectroscopy | Microfluidic Platforms |
|---|---|---|---|
| Service Contracts | $10,000 - $50,000/year [75] | $15,000 - $60,000/year | Minimal |
| Consumables & Reagents | High ($5,000 - $20,000/year) | Low to Moderate | Moderate (chip-dependent) |
| Software Licensing | Often included with service contract | $5,000 - $25,000/year for AI modules | Minimal |
| Data Management | Moderate | High (computational resources) | Low |
| Personnel Costs | High (technical expertise) | High (cross-disciplinary skills) | Moderate |
Detailed Experimental Protocols
Protocol 1: AI-Enhanced Hyperspectral Imaging for Allergen Detection in Complex Matrices
Principle: This protocol utilizes hyperspectral imaging combined with machine learning algorithms to detect and quantify allergenic proteins in complex food products without destructive sample preparation [5].
Materials:
- Hyperspectral Imaging System: Equipped with spectral range of 400-1000 nm
- AI Processing Unit: High-performance computer with GPU acceleration
- Sample Preparation Kit: Including cryostat for sectioning, sample holders
- Reference Standards: Purified allergenic proteins (e.g., Ara h 1 for peanut, Bos d 5 for milk) [5]
Procedure:
- Sample Preparation:
- Homogenize food samples using cryogenic grinding to achieve uniform particle size.
- Prepare serial sections of 10μm thickness using cryostat and mount on slides.
System Calibration:
- Acquire dark and white reference images before sample analysis.
- Validate system using reference standards at concentrations of 0.1, 1, and 10 μg/g.
Data Acquisition:
- Capture hyperspectral cubes across the defined spectral range.
- Maintain consistent illumination intensity and camera settings across samples.
AI Processing:
- Implement spectral unmixing algorithms to distinguish allergen signatures from background matrix.
- Apply pre-trained convolutional neural network for pattern recognition.
- Generate spatial distribution maps of detected allergens.
Validation:
- Correlate results with confirmatory LC-MS/MS analysis for method validation [76].
- Calculate recovery rates and limit of detection using spiked samples.
Protocol 2: Targeted Mass Spectrometry with AI-Driven Sample Scheduling
Principle: This protocol leverages liquid chromatography-tandem mass spectrometry with selected reaction monitoring for multiplexed allergen quantification, enhanced by AI algorithms for optimal sample scheduling and interference detection [76].
Materials:
- Liquid Chromatography System: Nano-or capillary-flow system with C18 column
- Mass Spectrometer: Triple quadrupole or Orbitrap system capable of SRM
- AI-Enhanced Software: For predictive scheduling and interference detection
- Proteotypic Peptides: Synthetic stable isotope-labeled peptides for quantification
Procedure:
- Protein Extraction and Digestion:
- Extract proteins using optimized buffer systems for different food matrices.
- Reduce with dithiothreitol, alkylate with iodoacetamide, and digest with trypsin.
- Desalt peptides using C18 solid-phase extraction.
LC-MS Method Development:
- Establish chromatographic separation optimized for proteotypic peptides.
- Define SRM transitions for target allergens (3-5 transitions per peptide).
- Implement AI-driven scheduling to maximize monitoring capacity.
AI-Enhanced Data Acquisition:
- Apply machine learning algorithms to predict optimal retention time windows.
- Use real-time interference detection to trigger alternative transitions.
- Implement dynamic exclusion of saturated signals.
Data Analysis:
- Process data using automated integration algorithms.
- Apply quality control criteria for transition peak area ratios.
- Quantify using standard curves from stable isotope-labeled standards.
The Scientist's Toolkit: Research Reagent Solutions
Table 3: Essential Research Reagents for Advanced Allergen Detection
| Reagent/Material | Function | Application Notes |
|---|---|---|
| Proteotypic Peptides | Target analytes for MS quantification; enable precise allergen-specific detection | Select peptides robust to food matrix effects; verify specificity using Allergen Peptide Browser [76] |
| Stable Isotope-Labeled Standards | Internal standards for absolute quantification; correct for sample preparation variability | Use AQUA or QconCAT strategies; match retention time with native peptides [76] |
| AI Training Datasets | Curated spectral libraries for machine learning algorithm development | Must represent diverse food matrices and processing conditions [5] |
| Hyperspectral Reference Standards | Calibration materials for imaging systems; ensure measurement accuracy | Include both positive and negative controls; validate against reference methods [33] |
| Microfluidic Chip Substrates | Platform for miniaturized assays; enable point-of-care testing | PDMS offers transparency and biocompatibility; paper-based substrates provide low-cost alternative [77] |
The integration of AI with advanced spectroscopic methods represents a transformative development in allergen detection, offering exceptional sensitivity and operational efficiencies. However, realizing the full potential of these technologies requires careful consideration of their total cost of ownership, including specialized personnel, computational resources, and ongoing maintenance. Mass spectrometry continues to provide robust multiplexed quantification but at significant operational expense. Emerging microfluidic platforms offer potential for cost-effective screening applications. Ultimately, the optimal technology selection depends on specific application requirements, with high-sensitivity applications justifying the substantial investment in AI-enhanced platforms, while standardized workflows may benefit from more established methodologies. Future advancements in sensor technology, algorithm efficiency, and standardized validation protocols will further improve the cost-benefit balance of these sophisticated detection systems.
Benchmarking Performance: Validating AI-Spectroscopy Against Gold Standards
The integration of artificial intelligence (AI) with advanced spectroscopic techniques is revolutionizing the detection of allergens in complex food matrices. Traditional methods, while reliable, often struggle with the demands for speed, non-destructive analysis, and multi-allergen detection in modern food production and safety monitoring [5]. AI-driven spectroscopy addresses these challenges by leveraging machine learning (ML) algorithms to interpret complex spectral data, enabling highly accurate, sensitive, and rapid allergen identification [78] [79]. This document establishes standardized benchmarks and detailed protocols for key quantitative performance metrics—Accuracy, Sensitivity, and F1-Score—to validate and compare the performance of these emerging analytical systems within a rigorous research and development framework.
Performance Benchmarks for AI-Driven Allergen Detection
The following tables consolidate quantitative performance data from recent studies utilizing different AI-driven spectroscopic methods for detection in complex matrices, providing a benchmark for the field.
Table 1: Performance Benchmarks of Raman Spectroscopy in Biomedical Detection (Model System)
| Detection Technology | Target Analyte | AI Model | Accuracy | Sensitivity | F1-Score | Citation |
|---|---|---|---|---|---|---|
| Raman Spectroscopy | Cancer-Derived Exosomes (Colon, Skin, Prostate) | PCA + Linear Discriminant Analysis | 93.3% | N/A | 98.2% (Colon), 91.1% (Skin), 91.0% (Prostate) | [80] |
| Raman Spectroscopy (SPECTRA IMDx) | High-Risk Gastric Lesions | Proprietary AI | 89.0% (by patient) | 100% | N/A | [81] |
Table 2: Performance of Spectroscopy in Food Allergen Detection
| Detection Technology | Target Allergen | Matrix | Key Performance Indicator | Result | Citation |
|---|---|---|---|---|---|
| Near-Infrared (NIR) Spectroscopy | Peanut, Sesame, Wheat | Quinoa Flour | Coefficient of Prediction (R²p) | 0.99 | [82] |
| Root Mean Square Error of Prediction (RMSEP) | 3.25% | [82] | |||
| Mass Spectrometry | Peanut, Milk, Egg, Shellfish (Specific Proteins) | Various Food Matrices | Detection Limit | As low as 0.01 ng/mL | [5] |
Experimental Protocols
This section provides a detailed, step-by-step methodology for the development and benchmarking of an AI-driven spectroscopic system for allergen detection, based on reviewed literature.
Protocol A: Sample Preparation and Spectral Acquisition using NIR
Objective: To prepare adulterated gluten-free flour samples and acquire their NIR spectral data for model development [82].
Materials:
- Pure quinoa flour
- Pure allergen flours (e.g., peanut, sesame, wheat)
- Laboratory grinder
- 250-micrometer sieve
- Mechanical dryer
- Benchtop NIR spectrometer (e.g., 867–2535 nm range)
- Analytical balance
Procedure:
- Sample Preparation:
- Dry pure quinoa and wheat seeds at 60°C for 4 hours and grind them into a fine powder.
- Pass all flour types (quinoa, peanut, sesame, wheat) through a 250-μm sieve to ensure uniform particle size.
- Prepare binary mixtures by mixing quinoa flour with each allergen flour at controlled adulteration levels (e.g., 0.5% to 10% by weight).
- Ensure a minimum of 20-30 samples per adulteration level for robust model training.
- Spectral Acquisition:
- Fill a sample cup with each prepared mixture and present it to the NIR spectrometer.
- Acquire spectra in reflectance mode. A minimum of 32 scans per sample is recommended to improve the signal-to-noise ratio.
- Repeat the measurement at least three times for each sample, repacking the cup between scans to account for packing density variations.
- Store all spectra with their corresponding metadata (sample ID, allergen type, concentration).
Protocol B: Data Pre-processing and Multivariate Model Building
Objective: To pre-process raw spectral data and develop a quantitative model for predicting allergen concentration.
Software: Python (with scikit-learn, NumPy, SciPy) or proprietary chemometric software.
Procedure:
- Spectral Pre-processing:
- Apply Standard Normal Variate (SNV) or Multiplicative Scatter Correction (MSC) to reduce light-scattering effects.
- Use the Savitzky-Golay (SG) filter (e.g., 2nd-order polynomial, 15-21 point window) for smoothing and calculating first or second derivatives to resolve overlapping peaks and remove baseline offsets [82].
- Model Development with Partial Least Squares Regression (PLSR):
- Split the pre-processed spectral data and reference concentration values into a training set (e.g., 70-80%) and a test set (e.g., 20-30%).
- Build a PLSR model on the training set to correlate spectral features with allergen concentration.
- Use cross-validation (e.g., Venetian blinds, random subsets) on the training set to determine the optimal number of latent variables and prevent overfitting.
- Model Validation:
- Use the independent test set, not used in model training, to evaluate the final model's performance.
- Calculate key quantitative metrics, including R²p and RMSEP, as shown in Table 2.
Protocol C: Developing a Raman-based Classifier with Machine Learning
Objective: To acquire Raman spectra from samples and train a machine learning model for classification [80].
Procedure:
- Spectral Acquisition:
- Use a Raman spectrometer equipped with a standard laser source (e.g., 785 nm).
- Acquire spectra from multiple points on each sample to account for heterogeneity.
- Feature Extraction:
- Perform Principal Component Analysis (PCA) on the pre-processed Raman spectra.
- Extract the principal components (PCs) that account for the most significant variance in the data. These PCs serve as the input features for the classifier.
- Model Training and Evaluation:
- Train a Linear Discriminant Analysis (LDA) classifier using the PCs from the training set.
- Apply the trained PCA-LDA model to the test set to generate predictions.
- Evaluate the model performance by calculating the overall Accuracy, and F1-Score for each class (e.g., type of allergen or cancer) to account for class imbalances.
Visualizing Experimental Workflows
The following diagrams illustrate the core experimental and computational workflows described in the protocols.
Workflow for NIR-Based Allergen Quantification
Workflow for Raman-Based Allergen Classification
The Scientist's Toolkit: Essential Research Reagents & Materials
Table 3: Key Reagents and Materials for AI-Driven Spectroscopic Allergen Detection
| Item | Function/Application | Specification Notes |
|---|---|---|
| Gluten-Free Flour (Quinoa) | Primary matrix for developing and testing allergen detection models. | Serves as a base material to simulate real-world contamination scenarios [82]. |
| Allergen Standards | Provide known targets for method development and calibration. | Purified flours or proteins from peanut, sesame, wheat, milk, egg, shellfish [5] [82]. |
| NIR Spectrometer | A non-destructive analytical instrument for rapid spectral acquisition. | Benchtop systems (867-2535 nm) for R&D; filter-based or portable NIR for potential at-line use [61] [82]. |
| Raman Spectrometer | Provides label-free, chemically specific molecular fingerprints. | Often combined with machine learning for sensitive classification tasks [80] [79]. |
| Mass Spectrometry System | Offers high-sensitivity, confirmatory quantification of specific allergenic proteins. | LC-MS/MS systems can detect proteotypic peptides at levels as low as 0.01 ng/mL [5]. |
| Chemometric Software | For spectral pre-processing, multivariate model building (PLSR), and machine learning. | Platforms like Python (scikit-learn) or commercial software (e.g., SIMCA, Unscrambler) are essential [82]. |
The accurate detection of food allergens in complex food matrices represents a significant challenge in food safety. This application note provides a comparative analysis of Artificial Intelligence (AI) approaches against conventional chemometric methods—Principal Component Analysis (PCA) and Partial Least Squares-Discriminant Analysis (PLS-DA)—for spectral classification in this critical field. Drawing upon recent research, we demonstrate that AI-based models can achieve superior performance, with reported accuracies up to 87% for allergen-specific detection, compared to highly effective yet more constrained conventional models. The protocols and data presented herein are designed to guide researchers in selecting and implementing the optimal analytical strategy for their specific allergen detection needs.
Food allergies affect over a billion people globally, creating an urgent need for reliable detection methods to ensure food safety and comply with labeling regulations. Spectral techniques, including Near-Infrared Spectroscopy (NIRS), Laser-Induced Breakdown Spectroscopy (LIBS), and Fourier-Transform Infrared Spectroscopy (FTIR), are powerful tools for analyzing complex food matrices. However, the interpretation of the resulting spectral data requires sophisticated classification algorithms to distinguish between subtle features indicative of allergen contamination [83] [18].
For decades, conventional chemometric techniques like PCA and PLS-DA have been the cornerstone of spectral data analysis. PCA, an unsupervised method, is excellent for exploratory data analysis and visualizing inherent data patterns. PLS-DA, a supervised method, is widely used to build predictive classification models [84]. Recently, AI-driven approaches, including convolutional neural networks (CNNs) and other machine learning algorithms, have emerged as powerful alternatives, promising enhanced accuracy and automation [85] [86]. This document provides a detailed comparative analysis and experimental protocols for both methodological paradigms within the context of allergen detection.
Comparative Performance Analysis
The following tables summarize the key performance metrics and characteristics of conventional versus AI-based approaches as evidenced by recent studies.
Table 1: Quantitative Performance Comparison of Classification Methods
| Methodology | Reported Accuracy | Reported Sensitivity/Specificity | Application Context | Source |
|---|---|---|---|---|
| AI-based (NIRS) | 87% | F1-Score: 89.91% | nsLTP allergen detection in various foods | [18] |
| AI-based (LIBS) | Significant improvement over conventional | Quantitative evaluation confirmed improvement | Toner sample discrimination (Forensic) | [85] |
| PLS-DA (FTIR) | >99% (for calibration) | Sensitivity & Selectivity >99% | Detection of Gurjun Balsam oil adulteration in Patchouli oil | [83] |
| PCA-LDA (FTIR) | 93%-100% | Sensitivity: 86%-100%, Specificity: 90%-100% | Classification of breast cancer cell lines | [84] |
Table 2: Characteristics and Operational Comparison
| Aspect | Conventional (PCA, PLS-DA) | AI-Based (CNN, ML Models) |
|---|---|---|
| Core Principle | Linear transformations, dimensionality reduction, regression [84] | Non-linear pattern recognition via layered algorithms [85] [86] |
| Data Preprocessing | Often requires user-intensive preprocessing [85] | Can be designed for minimal user preprocessing; automated [85] |
| Model Interpretability | High (e.g., via loadings, regression coefficients) [84] | Lower ("black box" nature) [87] |
| Computational Demand | Lower | Higher, especially for deep learning [86] |
| Handling of Complex Data | Effective, but may struggle with highly non-linear relationships | Excels at identifying complex, non-linear patterns in raw data [86] |
| Best Use Case | Well-defined problems, when interpretability is key, limited data | Complex classification tasks, large datasets, when maximum accuracy is critical |
Experimental Protocols
Protocol for Conventional PLS-DA in Allergen/Adulterant Detection
This protocol is adapted from a study on detecting oil adulteration using FTIR [83].
1. Sample Preparation:
- Obtain certified reference materials (CRM) for pure and adulterated samples.
- Prepare adulterated samples at a range of concentrations (e.g., 0.5% to 10% v/v) to build a robust model.
- Ensure consistent sample presentation for spectral acquisition (e.g., use ATR-FTIR crystal).
2. Spectral Data Acquisition:
- Instrument: FTIR Spectrometer with ATR accessory.
- Parameters: Collect spectra over a relevant wavenumber range (e.g., 1800-600 cm⁻¹ fingerprint region).
- Replicates: Collect multiple spectra per sample to ensure statistical significance.
3. Data Preprocessing:
- Apply preprocessing techniques to reduce noise and enhance signal. Common methods include:
- Standard Normal Variate (SNV)
- Savitzky-Golay derivatives (e.g., second derivative)
- Vector normalization
4. Model Development (PLS-DA):
- Assign class labels (e.g., +1 for pure, -1 for adulterated).
- Split data into calibration (training) and validation (test) sets.
- Build the PLS-DA model using the calibration set. The model relates the spectral data (X-matrix) to the class membership (Y-matrix) via latent variables (LVs).
- Identify significant wavenumbers contributing to class separation through analysis of regression coefficients and loadings plots (e.g., peaks at 603, 786, 1386 cm⁻¹ for specific adulterants).
5. Model Validation:
- Use the test set to validate the model.
- Calculate performance metrics: R², RMSEC (Root Mean Square Error of Calibration), sensitivity, and selectivity.
- Perform cross-validation (e.g., k-fold or leave-one-out) to assess model robustness.
Protocol for AI-Based Classification for Allergen Detection
This protocol is adapted from a study on detecting nsLTP allergens using NIRS and AI [18].
1. Sample Preparation and Labeling:
- Collect a wide variety of food samples, both containing and lacking the target allergen (e.g., nsLTP).
- Assign ground-truth labels authoritatively using databases like AllergenOnline and WHO/IUIS. Exclude ambiguous cases.
- Clean all equipment meticulously between samples to prevent cross-contamination.
2. Spectral Data Acquisition & Database Construction:
- Instrument: Scientific-grade NIRS Spectrometer.
- Data Collection: For each sample, collect multiple absorbance and reflectance spectra at different positions (e.g., 6 measurements per sample).
- Automate data handling using scripts (e.g., in Python) to convert raw spectral data from .txt files into a single, structured .csv database.
3. Data Preprocessing:
- This is a critical step for AI models. Apply techniques such as:
- Scaling and normalization.
- Noise filtering.
- Handling of missing values or outliers.
4. AI Model Building and Training:
- Select a machine learning algorithm (e.g., CNN, shallow Neural Network).
- Iteratively build and optimize the model using the training dataset.
- For CNNs, the architecture typically includes convolutional layers for feature extraction from spectral data, followed by fully connected layers for classification [86].
5. Model Evaluation:
- Evaluate the final model on a held-out test set.
- Report standard metrics including Accuracy, Precision, Recall, and F1-Score.
The workflow diagram below illustrates the core procedural differences between the two approaches.
The Scientist's Toolkit
Table 3: Essential Research Reagent Solutions and Materials
| Item | Function / Application | Example / Note |
|---|---|---|
| FTIR Spectrometer with ATR | Rapid, non-destructive chemical analysis of samples. Ideal for oils and liquids. | Used in PLS-DA protocol for adulterant detection [83]. |
| NIRS Spectrometer | Non-destructive analysis of food quality and safety parameters. | Used in AI protocol for nsLTP allergen detection [18]. |
| LIBS Instrumentation | Elemental analysis via laser-induced plasma. Can be combined with AI. | Applied with novel AI approaches for forensic discrimination [85]. |
| LC-MS/MS System | Highly specific and sensitive detection and quantification of allergen peptides. | Used for confirmatory analysis and marker peptide identification [88] [89]. |
| Certified Reference Materials (CRM) | Essential for model calibration and validation to ensure accuracy. | Used to establish ground truth for pure and adulterated samples [83]. |
| Stable Isotope-Labeled (SIL) Peptides | Internal standards for MS-based quantification to correct for variability. | Key for precise and accurate absolute quantification of allergens [90]. |
| Python with Libraries (e.g., Scikit-learn, TensorFlow, Pandas) | Platform for developing automated data processing scripts and AI/ML models. | Used for database construction and model training in AI protocols [18]. |
The evidence indicates that both conventional and AI-based methods are powerful for spectral classification in allergen detection. PLS-DA remains a robust, interpretable, and highly effective choice for many well-defined analytical problems. However, for applications requiring maximum accuracy, handling of highly complex or non-linear data, and a higher degree of automation, AI-based approaches present a compelling advantage [85] [18].
The choice of method should be guided by the specific application. For routine, targeted analysis where understanding the "why" is crucial, PLS-DA is an excellent choice. For non-targeted screening, dealing with complex processed matrices, or when pushing the limits of detection sensitivity, investing in an AI-driven workflow is the path forward. The integration of AI into spectroscopic analysis represents a significant step forward in enhancing food safety and protecting allergic consumers.
The demand for detecting food allergens at parts-per-billion (ppb) sensitivity levels has become increasingly critical in safeguarding consumer health, especially as global food supply chains grow more complex. Undeclared allergens consistently rank as a leading cause of food recalls worldwide, with regulatory frameworks evolving toward stricter thresholds and enhanced enforcement protocols [91]. Traditional enzyme-linked immunosorbent assay (ELISA) and polymerase chain reaction (PCR) methods, while reliable for many applications, face significant limitations in achieving consistent ppb-level detection in processed food matrices due to issues with antibody cross-reactivity and DNA/protein degradation during manufacturing [92].
Advanced spectroscopic techniques coupled with artificial intelligence (AI) represent a transformative approach to these analytical challenges. These methodologies enable non-destructive, rapid, and highly precise detection of trace allergens while maintaining the integrity of food samples [93] [94]. The integration of machine learning and deep learning algorithms with hyperspectral imaging, mass spectrometry, and enhanced Raman techniques has unlocked unprecedented sensitivity capable of identifying specific allergenic proteins at concentrations far below conventional detection thresholds [33] [5]. This application note details the protocols and technological frameworks necessary to achieve consistent ppb-level sensitivity for allergen detection in complex food matrices, providing researchers with validated methodologies for implementation in both research and quality control environments.
Technological Foundations for ppb-Level Sensitivity
Advanced Spectroscopic Platforms
Achieving parts-per-billion sensitivity requires sophisticated analytical platforms that can detect minute molecular signatures amid complex food matrices. Several advanced spectroscopic technologies have demonstrated exceptional performance for this application, each with distinct operational principles and advantages.
Surface-Enhanced Raman Spectroscopy (SERS) utilizes nanostructured metallic surfaces to amplify Raman signals by several orders of magnitude, enabling the detection of contaminant and allergen traces at ultra-low concentrations. Wide Line SERS (WL-SERS) has demonstrated a tenfold increase in sensitivity compared to conventional methods, allowing for the detection of contaminants like melamine in raw milk at concentrations significantly below standard regulatory thresholds [33]. This enhancement is critical for identifying low-abundance allergenic proteins in challenging matrices such as chocolate, spices, and processed meats.
Liquid Chromatography-Tandem Mass Spectrometry (LC-MS/MS) has emerged as a powerful tool for allergen detection due to its high specificity and sensitivity. Unlike antibody-based methods, LC-MS/MS directly targets proteotypic peptides derived from allergenic proteins, providing unambiguous identification even in complex samples. Recent methodologies have achieved screening detection limits (SDL) of 1 mg/kg (1 ppm) for tree nut allergens like pistachio and cashew in various food matrices, with ongoing refinements pushing toward lower detection limits [92]. The technology's ability to perform multiplexed analysis—simultaneously detecting multiple allergens in a single run—makes it particularly valuable for comprehensive food safety screening.
Hyperspectral Imaging (HSI) combines conventional imaging and spectroscopy to obtain both spatial and spectral information from a sample. This non-destructive technique captures hundreds of contiguous wavelength bands, creating a detailed chemical fingerprint that AI algorithms can analyze to identify trace allergens. When integrated with machine learning, HSI can detect allergen contamination at ppb levels while simultaneously mapping their distribution within a food product [93] [95]. This capability is especially valuable for identifying cross-contamination hotspots in heterogeneous products.
Table 1: Analytical Techniques for ppb-Level Allergen Detection
| Technique | Detection Mechanism | Achievable Sensitivity | Key Advantages | Complex Matrix Limitations |
|---|---|---|---|---|
| LC-MS/MS | Detection of proteotypic peptides via mass spectrometry | 1 ppm (1 mg/kg), approaching ppb with advanced sample prep [92] | High specificity, multi-allergen detection, direct protein measurement | Matrix suppression effects, requires extensive sample preparation |
| SERS/WL-SERS | Enhanced Raman scattering from nanostructured surfaces | Sub-ppb for certain contaminants [33] | Minimal sample prep, rapid analysis, fingerprint identification | Substrate reproducibility, matrix interference in complex foods |
| Hyperspectral Imaging + AI | Spatial-spectral analysis with machine learning classification | Low ppb range for selected allergens [5] | Non-destructive, visual contamination mapping, rapid screening | Large data processing requirements, model training needed |
| Immunoassays (Advanced) | Modified antibody-antigen interactions with signal amplification | 0.01 ng/mL for multiplexed assays [5] | Established protocols, high throughput, regulatory acceptance | Cross-reactivity issues, limited multiplexing capability |
AI and Machine Learning Integration
The integration of artificial intelligence, particularly deep learning algorithms, with spectroscopic technologies has dramatically enhanced the capacity to achieve ppb-level sensitivity in complex food matrices. Convolutional Neural Networks (CNNs) can process hyperspectral imaging data to identify subtle spectral patterns indicative of allergen contamination that would be imperceptible to traditional analytical methods. These models have demonstrated exceptional accuracy, with some implementations reaching 99.85% in identifying adulterants and specific allergenic proteins [33].
Machine learning algorithms also enable multimodal data fusion, where complementary information from multiple spectroscopic techniques (e.g., FT-IR, Raman, and NIR) is combined to improve detection accuracy and sensitivity. This approach leverages the strengths of each analytical method while mitigating their individual limitations, resulting in robust models capable of maintaining ppb-level sensitivity across diverse food matrices [93]. The integration of spectral data with non-spectral information (e.g., environmental parameters, processing conditions) further enhances model performance by providing contextual information that improves pattern recognition.
Data preprocessing represents another critical application of AI in achieving high sensitivity. Algorithms for scatter correction, baseline removal, and peak alignment effectively reduce analytical noise and correct for matrix effects that would otherwise obscure low-concentration signals [94]. Techniques such as Multiplicative Scatter Correction (MSC), Standard Normal Variate (SNV), and adaptive reweighing schemes for polynomial fitting enhance signal-to-noise ratios, enabling more reliable detection of trace-level allergens [94].
Experimental Protocols for ppb-Level Detection
LC-MS/MS Protocol for Tree Nut Allergen Detection
This protocol details a validated method for simultaneous detection of pistachio and cashew allergens at 1 ppm sensitivity using liquid chromatography-tandem mass spectrometry, with potential for further optimization to ppb levels [92].
Materials and Reagents
Table 2: Research Reagent Solutions for LC-MS/MS Allergen Detection
| Item | Specification | Function | Critical Notes |
|---|---|---|---|
| Mass Spectrometer | Triple quadrupole (LC-QqQ) | Targeted analysis of allergen peptides | Provides superior sensitivity and reproducibility for routine analysis [92] |
| Chromatography System | UHPLC with C18 column (2.1 × 100 mm, 1.7 μm) | Peptide separation | Aqcuity UPLC HSS T3 column recommended for optimal resolution |
| Extraction Buffer | 50 mM ammonium bicarbonate with 1% SDC | Protein extraction | Sodium deoxycholate (SDC) enhances protein recovery from complex matrices |
| Reducing Agent | 10 mM dithiothreitol (DTT) | Disulfide bond reduction | Critical for protein denaturation and enzymatic digestion |
| Alkylating Agent | 50 mM iodoacetamide | Cysteine alkylation | Prevents reformation of disulfide bonds |
| Digestion Enzyme | Sequencing-grade trypsin | Protein digestion | Generates specific peptides for detection; must be sequencing grade |
| Internal Standards | Isotopically labeled peptide analogs | Quantification | Essential for accurate quantification; label-free approaches possible but less precise [92] |
| Solid Phase Extraction | C18 cartridges | Sample clean-up | Removes matrix interferents prior to LC-MS/MS analysis |
Sample Preparation Workflow
Homogenization: Process food samples to a fine powder using a laboratory-grade mixer mill. For solid matrices (e.g., cereals, chocolate), freeze-drying before homogenization improves consistency.
Protein Extraction:
- Weigh 0.5 g of homogenized sample into a 15 mL centrifuge tube
- Add 5 mL of extraction buffer (50 mM ammonium bicarbonate with 1% SDC)
- Vortex vigorously for 30 seconds, then shake for 30 minutes at room temperature
- Centrifuge at 10,000 × g for 10 minutes at 4°C
- Transfer supernatant to a new tube
Protein Reduction and Alkylation:
- Add DTT to a final concentration of 10 mM, incubate at 56°C for 45 minutes
- Cool to room temperature, add iodoacetamide to 50 mM final concentration
- Incubate in darkness at room temperature for 30 minutes
Enzymatic Digestion:
- Add trypsin at 1:50 enzyme-to-protein ratio (estimated)
- Incubate at 37°C for 16 hours with gentle agitation
- Stop digestion by adding trifluoroacetic acid (TFA) to 1% final concentration
Sample Cleanup:
- Centrifuge at 12,000 × g for 10 minutes to remove SDC precipitate
- Load supernatant onto C18 SPE cartridge preconditioned with methanol and 0.1% TFA
- Wash with 5 mL of 0.1% TFA, elute peptides with 2 mL of 50% acetonitrile/0.1% TFA
- Concentrate eluate to near-dryness using a vacuum centrifuge, reconstitute in 100 μL of 0.1% formic acid
LC-MS/MS Analysis Parameters
Chromatography Conditions:
- Column: UPLC HSS T3 (2.1 × 100 mm, 1.7 μm)
- Mobile Phase A: 0.1% formic acid in water
- Mobile Phase B: 0.1% formic acid in acetonitrile
- Flow Rate: 0.3 mL/min
- Gradient: 5-35% B over 15 minutes, 35-95% B over 2 minutes, hold at 95% for 3 minutes
- Column Temperature: 40°C
- Injection Volume: 10 μL
Mass Spectrometry Conditions:
- Ionization Mode: Electrospray ionization (ESI) positive
- Detection Mode: Multiple reaction monitoring (MRM)
- Nebulizer Gas: Nitrogen, 7 L/min
- Heating Gas: Nitrogen, 10 L/min
- Interface Temperature: 300°C
- DL Temperature: 250°C
- Heat Block Temperature: 400°C
- Dwell Time: 10 ms per transition
Table 3: MRM Transitions for Pistachio and Cashew Allergen Detection
| Allergen | Protein Marker | Peptide Sequence | Q1 Mass (m/z) | Q3 Mass (m/z) | Collision Energy (V) |
|---|---|---|---|---|---|
| Pistachio | Pis v 1 | FVLDGLK | 388.7 | 631.4 | 12 |
| Pistachio | Pis v 3 | LNEQELEEIR | 656.8 | 887.4 | 16 |
| Cashew | Ana o 2 | EIQFQEQQFR | 698.8 | 927.4 | 16 |
| Cashew | Ana o 3 | NPYFVIR | 458.2 | 665.4 | 14 |
AI-Enhanced Hyperspectral Imaging Protocol
This protocol details the implementation of hyperspectral imaging coupled with deep learning for non-destructive allergen detection at ppb sensitivity levels [93] [95].
Materials and Equipment
- Hyperspectral imaging system (400-1000 nm or 900-1700 nm range)
- Laboratory computer with GPU acceleration (minimum 8 GB VRAM)
- Black calibration standard (>99% absorption)
- White reference standard (>99% reflectance)
- Sample stabilization stage with precise positioning
- Data analysis software (Python with TensorFlow/PyTorch, or commercial alternatives)
Image Acquisition and Preprocessing
System Calibration:
- Acquire dark reference image with lens covered
- Acquire white reference image using spectralon standard
- Calculate relative reflectance: ( R = \frac{Sample - Dark}{White - Dark} )
- Repeat calibration every 2 hours during continuous operation
Sample Imaging:
- Position samples to ensure uniform illumination
- Set spatial resolution to 30-50 μm/pixel based on allergen particle size
- Acquire hyperspectral cubes across full spectral range
- Maintain consistent distance between camera and samples
Spectral Data Extraction:
- Define regions of interest (ROIs) representing known allergen contamination
- Extract mean spectra from each ROI
- Apply preprocessing: Savitzky-Golay smoothing, MSC, and SNV normalization
Deep Learning Model Implementation
AI-Enhanced Hyperspectral Imaging Workflow
Data Preparation:
- Format hyperspectral data as 3D cubes (x, y, λ)
- Partition data: 70% training, 15% validation, 15% testing
- Apply data augmentation: spectral rotation, random noise injection, spatial flipping
CNN Architecture Implementation:
- Input layer: Hyperspectral cube (height × width × spectral bands)
- Convolutional blocks: 3D convolutions for joint spatial-spectral feature extraction
- Residual connections to facilitate gradient flow in deep networks
- Attention mechanisms to weight important spectral regions
- Fully connected layers for final classification/regression
Model Training:
- Loss function: Focal loss for handling class imbalance
- Optimizer: Adam with learning rate 0.001, reduced by factor 10 on plateau
- Batch size: 16 (adjust based on GPU memory)
- Early stopping with patience of 50 epochs
Model Validation:
- K-fold cross-validation (k=5) to assess generalizability
- External validation with independent sample set
- Calculation of sensitivity, specificity, and limit of detection
Data Analysis and Validation Framework
Sensitivity and Specificity Assessment
Rigorous validation is essential to confirm ppb-level detection capabilities in complex food matrices. The following procedures ensure analytical reliability:
Limit of Detection (LOD) Determination:
- Prepare serial dilutions of allergen standards in blank matrix
- Analyze 10 replicates at each concentration level
- Calculate signal-to-noise ratio (S/N) for each measurement
- Define LOD as concentration yielding S/N ≥ 3
- Confirm LOD with independent sample preparation
Method Specificity Testing:
- Analyze structurally similar non-target allergens (e.g., different tree nuts)
- Test common matrix interferents (fats, pigments, emulsifiers)
- Verify absence of cross-reactivity through MRM transition specificity (LC-MS/MS) or spectral purity (HSI)
Table 4: Validation Parameters for ppb-Level Allergen Detection
| Validation Parameter | Acceptance Criteria | Assessment Method | Protocol |
|---|---|---|---|
| Sensitivity (LOD) | ≤10 ppb for high-priority allergens | Signal-to-noise ratio | Analysis of serially diluted standards in matrix |
| Precision | ≤15% RSD for replicates | Repeatability (intra-day) and reproducibility (inter-day) | 6 replicates across 3 different days |
| Accuracy | 80-120% recovery | Standard addition method | Spiked samples at low, medium, and high concentrations |
| Specificity | No interference from matrix | Analysis of potential interferents | Test structurally similar proteins and common food components |
| Ruggedness | ≤20% RSD under modified conditions | Deliberate alteration of method parameters | Variations in extraction time, mobile phase pH, etc. |
AI Model Performance Metrics
For AI-enhanced detection methods, additional validation metrics are necessary:
- Classification Accuracy: Proportion of correctly identified allergen-contaminated samples
- Precision and Recall: Balance between false positives and false negatives
- Area Under ROC Curve: Overall model performance across all classification thresholds
- Mean Absolute Error: Quantification accuracy for regression-based approaches
Model performance should be monitored continuously, with retraining implemented when performance degrades beyond established thresholds (typically 5% decrease in accuracy or 10% increase in false negative rate).
The protocols detailed in this application note provide validated pathways to achieve parts-per-billion sensitivity for allergen detection in complex food matrices. The integration of advanced spectroscopic techniques with artificial intelligence represents a paradigm shift in food safety analytics, enabling detection capabilities that were previously unattainable with conventional methods.
Successful implementation requires careful attention to several critical factors: sample preparation consistency is paramount for reproducible results at trace levels; method validation must be matrix-specific to account for interference variations; and AI models require continuous performance monitoring and periodic retraining to maintain accuracy as new food products enter the market. Additionally, laboratories should establish rigorous quality control measures, including routine analysis of reference materials and participation in proficiency testing programs.
As regulatory standards evolve toward stricter allergen thresholds and global supply chains continue to increase in complexity, these high-sensitivity detection methodologies will play an increasingly vital role in protecting consumer health and maintaining brand integrity. The ongoing development of portable spectroscopic devices coupled with edge-computing AI implementations promises to further democratize access to ppb-level allergen detection, potentially enabling real-time monitoring throughout the food production ecosystem.
The integration of artificial intelligence (AI) with spectroscopic techniques is revolutionizing allergen detection and quantification in complex food matrices. This paradigm shift enables robust, non-destructive analysis with unprecedented accuracy and speed, crucial for both industrial processing control and supply chain monitoring. AI-driven chemometric models, particularly those leveraging machine learning (ML) and deep learning (DL), enhance the interpretation of complex spectral data from Fourier Transform Infrared (FTIR) spectroscopy and Hyperspectral Imaging (HSI), moving beyond traditional destructive methods like ELISA and DNA-PCR [31]. This application note details standardized protocols and validation frameworks for implementing these intelligent systems across production and distribution environments, providing researchers and industry professionals with actionable methodologies for ensuring allergen safety.
Application in Industrial Processing
In industrial processing environments, AI-driven spectroscopy facilitates real-time, non-destructive monitoring of allergen contamination on production lines. This capability is critical for implementing effective Hazard Analysis and Critical Control Points (HACCP) protocols.
Core Technology and Implementation
Fourier Transform Infrared (FTIR) spectroscopy, when coupled with AI, forms a powerful tool for continuous quality control. The system operates by capturing vibrational spectra of food products in real-time, with AI models identifying the unique spectral fingerprints of allergens even within complex food matrices [31].
Quantitative Performance of AI Models in Industrial Allergen Detection:
| AI Model | Spectroscopic Technique | Reported Accuracy | Key Advantage |
|---|---|---|---|
| Convolutional Neural Network (CNN) | FTIR | >96% (with preprocessing) | Automated feature extraction; reduces need for rigorous preprocessing [9] |
| Random Forest (RF) | FTIR / HSI | High | Robustness against spectral noise and baseline shifts [96] [66] |
| Support Vector Machine (SVM) | FTIR / HSI | High | Effective with limited training samples and many correlated wavelengths [96] |
Detailed Experimental Protocol: Real-Time Line Monitoring for Peanut Allergen
This protocol outlines the procedure for validating an AI-FTIR system for detecting peanut residue on shared equipment.
Objective: To validate a non-destructive AI-FTIR method for the quantitative detection of peanut allergen residues on a chocolate bar production line.
Research Reagent Solutions:
| Item | Function |
|---|---|
| FTIR Spectrometer with ATR sensor | Collects vibrational spectra from product surface without destruction. |
| AI Model (e.g., CNN or Random Forest) | Analyzes spectral data in real-time to identify and quantify peanut fingerprints. |
| Standard Reference Materials (Peanut Powder) | Used for model calibration and creating samples with known contamination levels. |
| Simulated Food Matrix (Chocolate) | Provides the complex background for validating model specificity. |
Methodology:
- Sample Preparation:
- Create a calibration set by spiking peanut powder into peanut-free chocolate at concentrations ranging from 0 ppm to 10,000 ppm.
- Prepare a separate validation set with independent samples.
- Spectral Acquisition:
- Using the FTIR-ATR sensor, collect spectra directly from the surface of the calibration and validation samples.
- Acquire a minimum of 32 scans per spectrum at a resolution of 4 cm⁻¹ across the mid-infrared range (e.g., 4000-600 cm⁻¹).
- AI Model Training & Validation:
- Training: Use the calibration set spectra and known concentrations to train a classifier (e.g., Random Forest or CNN). The model learns the association between spectral features and peanut concentration.
- Validation: Input the spectra from the independent validation set into the trained model. Compare the model's predictions against the known concentrations.
- Real-Time Deployment:
- Integrate the validated model into the production line's control system.
- Spectra from passing products are analyzed in real-time. If the model predicts an allergen concentration above a predefined threshold (e.g., 10 ppm), an alert is triggered for product diversion.
Diagram 1: AI-FTIR Allergen Monitoring Workflow.
Application in Supply Chain Monitoring
AI-driven spectroscopy enhances supply chain resilience by providing rapid, on-site screening capabilities for incoming raw materials and finished products, crucial for verifying supplier compliance and preventing cross-contamination during transportation and storage.
Core Technology and Implementation
Hyperspectral Imaging (HSI) is exceptionally suited for supply chain applications as it combines spectroscopy and imaging, allowing for the spatial localization of allergens within a sample. Portable HSI and NIR devices enable decentralized testing at various points in the supply chain [66] [31]. AI's role is to manage the high dimensionality of HSI data cubes, automating the detection process.
AI-Driven Supply Chain Optimization Outcomes:
| Supply Chain Domain | AI Application | Quantitative Benefit |
|---|---|---|
| Demand Forecasting | ML algorithms analyzing historical data and market trends | Higher forecasting accuracy, leading to improved service levels [97] |
| Inventory Optimization | AI algorithms for stock level management | Significant cost savings through reduced excess inventory [97] |
| Logistics & Transportation | AI-powered route optimization | Reduced logistics costs [97] |
| Allergen Screening | HSI with ML classification | Rapid, non-destructive verification of raw materials |
Detailed Experimental Protocol: Incoming Raw Material Screening
This protocol validates the use of a portable HSI system coupled with an AI model for screening bulk ingredients like flour for potential cross-contact with allergens such as soy or sesame.
Objective: To validate a rapid, non-destructive method for detecting trace allergen cross-contact in bulk raw materials (e.g., wheat flour) at a receiving dock.
Research Reagent Solutions:
| Item | Function |
|---|---|
| Portable HSI System | Captures spatial and spectral data from a sample, identifying contamination spots. |
| AI Classification Model (e.g., SVM or XGBoost) | Classifies each pixel in the HSI image as "pure" or "contaminated". |
| Contaminated Sample Set | Flour samples with known, low concentrations of allergen. |
| Standardized Lighting Chamber | Ensures consistent imaging conditions for reliable data. |
Methodology:
- Data Collection & Labeling:
- Prepare samples of pure wheat flour and flour contaminated with target allergen at various concentrations (e.g., 100 ppm, 500 ppm, 1000 ppm).
- Acquire HSI data cubes for all samples under controlled lighting.
- Manually label regions in the HSI images to create a ground-truth dataset for model training.
- AI Model Training for Pixel Classification:
- Extract spectral signatures from each labeled pixel.
- Train a classifier (e.g., Support Vector Machine - SVM) to distinguish between the spectral profile of pure flour and the allergen.
- Validation and Deployment:
- Validate the model's pixel-level accuracy and its ability to correctly identify contaminated samples on a withheld test set.
- Deploy the model on a portable computer connected to the HSI system. For a new sample, the system generates a contamination map, highlighting suspect areas.
Diagram 2: Supply Chain Allergen Screening Protocol.
Future Directions and Standardization
The future of AI-driven spectroscopy for allergen monitoring lies in the development of standardized, robust frameworks. Key emerging trends include:
- Explainable AI (XAI): Techniques like SHAP (SHapley Additive exPlanations) are critical for regulatory compliance and scientific understanding, as they identify which specific spectral wavelengths are driving the AI's detection decision, bridging data-driven inference with chemical insight [66].
- Generative AI: Used for data augmentation, generative models like GANs (Generative Adversarial Networks) can create synthetic spectral data to balance training datasets and improve model robustness, especially for rare allergen contamination events [66].
- Foundation Models and Platforms: Unified software platforms like SpectrumLab are being developed to systematize deep learning research in spectroscopy. These platforms provide standardized benchmarks and toolkits, which are essential for validating and comparing the performance of different AI models fairly and reproducibly [98].
- Regulatory Alignment: For industries like pharmaceuticals and food, aligning AI models with regulatory guidance, such as the FDA's risk-based framework for AI in manufacturing, is essential for compliant implementation. This involves establishing model validity, transparency, and lifecycle robustness [99].
Food allergies affect millions of people worldwide, with regulatory agencies including the U.S. Food and Drug Administration (FDA) identifying nine major food allergens: milk, eggs, fish, Crustacean shellfish, tree nuts, peanuts, wheat, soybeans, and sesame [100]. These major allergens account for over 90% of all serious food allergic reactions in the United States [2]. The increasing prevalence of food allergies—with the CDC reporting a 50% increase in prevalence among children between 1997 and 2011—has intensified regulatory scrutiny and compliance requirements for food manufacturers [2]. Undeclared allergens now represent one of the leading causes of food recalls in the U.S., accounting for approximately 34.1% of all food recalls and posing significant risks to consumer safety and brand integrity [101].
The regulatory landscape for allergen control continues to evolve with scientific advancements. On April 23, 2021, the Food Allergy Safety, Treatment, Education, and Research (FASTER) Act was signed into law, declaring sesame as the 9th major food allergen effective January 1, 2023 [100]. This legislative change reflects the dynamic nature of allergen regulation and the need for robust detection methodologies. Meanwhile, the FDA has not established threshold levels for any allergens, maintaining that any detectable presence of major allergens must be properly declared on food labels [100]. This regulatory position places tremendous importance on sensitive, accurate detection methods capable of identifying trace-level allergens in complex food matrices.
Current Regulatory Framework and Standards
Key Legislation and Compliance Requirements
The foundational regulatory framework for allergen management in the United States stems from the Food Allergen Labeling and Consumer Protection Act of 2004 (FALCPA), which initially identified eight major food allergens [100]. This was significantly expanded with the passage of the FASTER Act in 2021, which added sesame as the ninth major allergen [2]. These laws mandate specific labeling requirements for packaged foods containing major allergens, which must be declared using either the ingredient list with parenthetical allergen identification or a separate "Contains" statement [100].
Globally, regulatory requirements vary, creating a complex compliance landscape for international food manufacturers. The European Union maintains an extended list of 14 regulated food allergens, including cereals containing gluten, celery, mustard, lupin, and molluscs beyond the U.S. "big nine" [2]. These regulatory differences necessitate careful consideration when developing allergen control programs for products in international distribution.
Analytical Testing and Methodological Standards
Regulatory compliance depends heavily on validated analytical methods for allergen detection. Currently, the FDA recognizes several established methodologies for allergen testing, though the agency has not prescribed specific standardized methods for all allergens [102]. The conventional method hierarchy includes:
- ELISA (Enzyme-Linked Immunosorbent Assay): Considered the gold standard for routine allergen screening due to high sensitivity and specificity [101]
- PCR (Polymerase Chain Reaction): Valued for detecting allergen DNA in processed foods where proteins may be denatured [102]
- Mass Spectrometry (LC-MS/MS): Used for confirmatory testing and simultaneous detection of multiple allergens [102]
Table 1: Comparison of Conventional Allergen Detection Methods
| Method | Detection Principle | Sensitivity | Key Applications | Limitations |
|---|---|---|---|---|
| ELISA | Antibody-protein binding | Parts per million (ppm) | Routine screening of raw materials and finished goods | Affected by protein denaturation; antibody cross-reactivity |
| PCR | DNA amplification | Varies by allergen | Confirmation in processed foods; matrix challenges | Detects genetic material, not proteins directly |
| LC-MS/MS | Proteotypic peptide detection | Varies by allergen | Multi-allergen detection; confirmatory analysis | High cost; requires specialized expertise |
Regulatory agencies focus heavily on data integrity throughout the testing process. Compliance requires complete traceability from sample intake to reporting, with robust audit trails and documentation practices [102]. The FDA expects testing data to adhere to ALCOA+ principles (Attributable, Legible, Contemporaneous, Original, Accurate, plus Complete, Consistent, Enduring, and Available) [103].
AI-Driven Spectroscopy: Emerging Methodological Framework
Technological Foundations and Advantages
Artificial intelligence (AI)-driven spectroscopy represents a transformative approach to allergen detection, combining advanced analytical instrumentation with machine learning algorithms to overcome limitations of conventional methods. These non-destructive technologies include hyperspectral imaging (HSI), Fourier Transform Infrared (FTIR) spectroscopy, and computer vision, which when coupled with machine learning enable real-time allergen detection without compromising food integrity [5]. The integration of AI allows these systems to identify complex pattern recognition signatures that may be imperceptible to conventional analysis.
The fundamental advantage of AI-driven spectroscopy lies in its capacity to simultaneously detect and quantify multiple specific allergenic proteins in complex food matrices with detection limits as low as 0.01 ng/mL demonstrated for key allergens including peanut (Ara h 3, Ara h 6), milk (Bos d 5), egg (Gal d 1, Gal d 2), and shellfish (Tropomyosin) [5]. This high sensitivity and specificity, combined with minimal sample preparation requirements, positions AI-spectroscopy as a promising technology for comprehensive allergen control programs.
Experimental Protocol: AI-Spectroscopy for Allergen Detection
Methodology Overview: This protocol describes a standardized approach for detecting and quantifying multiple allergens in complex food matrices using AI-enhanced Fourier Transform Infrared (FTIR) spectroscopy coupled with machine learning analysis.
Materials and Equipment:
- FTIR spectrometer with attenuated total reflection (ATR) accessory
- High-performance computing workstation with GPU acceleration
- Custom machine learning algorithms (Python-based, compatible with TensorFlow or PyTorch)
- Reference allergen materials (certified reference materials for major allergens)
- Standardized sample preparation kit (cryogenic grinding equipment, precision balances)
Sample Preparation Protocol:
- Representative Sampling: Obtain multiple units from the same batch/lot using random sampling to ensure statistical representation [104]
- Homogenization: Cryogenically grind samples to achieve uniform particle size distribution (<50μm)
- Spectra Acquisition:
- Apply 5-10mg of homogenized sample to ATR crystal
- Apply consistent pressure to ensure proper crystal contact
- Collect spectra in mid-IR range (4000-400 cm⁻¹)
- Accumulate 64 scans at 4 cm⁻¹ resolution
- Perform triplicate measurements for each sample
AI Model Training and Validation:
- Reference Standards: Create calibration curves using certified reference materials for each target allergen
- Data Augmentation: Apply spectral perturbations to expand training dataset and improve model robustness
- Model Architecture: Implement convolutional neural network (CNN) with attention mechanisms for spectral feature extraction
- Validation Protocol: Employ k-fold cross-validation and independent test set validation
- Performance Metrics: Quantify accuracy, precision, recall, and F1-score for each allergen class
Detection and Quantification Workflow:
- Spectral Pre-processing: Apply Savitzky-Golay smoothing, standard normal variate correction, and derivative spectroscopy
- Feature Extraction: Utilize CNN to identify allergen-specific spectral signatures
- Multi-allergen Detection: Implement multiclass classification algorithm for simultaneous allergen identification
- Concentration Prediction: Employ regression algorithms to quantify allergen levels based on spectral intensity
- Uncertainty Estimation: Calculate measurement uncertainty using bootstrap resampling methods
Figure 1: AI-Driven Spectroscopy Allergen Detection Workflow
Compliance Integration and Validation Requirements
Regulatory Acceptance Pathway
For AI-driven spectroscopy methods to gain regulatory acceptance, they must demonstrate equivalent or superior performance compared to established reference methods. The validation framework should adhere to FDA expectations for analytical methods, including:
- Method Validation Protocol: Comprehensive assessment of specificity, sensitivity, accuracy, precision, linearity, range, detection limits, and robustness [103]
- Comparative Studies: Parallel testing against reference methods (ELISA, PCR) across diverse food matrices
- Proficiency Testing: Ongoing verification of method performance through interlaboratory comparison programs
The FDA's increasing focus on AI/ML validation in regulated environments necessitates rigorous model documentation, including training data provenance, feature selection rationale, decision logic, and performance monitoring protocols [103]. AI systems must demonstrate transparency and explainability to regulatory reviewers, particularly for high-consequence decisions regarding product compliance.
Quality by Design (QbD) Framework
Implementing a Quality by Design approach ensures regulatory compliance throughout the AI-spectroscopy method lifecycle:
- Critical Method Parameters: Identify and control factors significantly impacting method performance
- Design Space Establishment: Define operational boundaries for reliable method performance
- Continuous Monitoring: Implement statistical process control for method performance verification
- Change Control Protocol: Establish rigorous procedures for model retraining and algorithm updates
Table 2: AI Model Validation Requirements for Regulatory Compliance
| Validation Element | FDA Expectation | Documentation Requirements |
|---|---|---|
| Training Data Provenance | Complete lineage and characteristics | Data sources, selection criteria, demographics |
| Algorithm Transparency | Understandable decision logic | Feature importance, model architecture, parameters |
| Performance Metrics | Context-specific validation | Accuracy, sensitivity, specificity, ROC curves |
| Bias Mitigation | Demonstrated fairness across populations | Bias testing results, corrective measures |
| Lifecycle Management | Continuous monitoring and updating | Drift detection, retraining protocols, version control |
The Scientist's Toolkit: Research Reagent Solutions
Table 3: Essential Research Reagents for AI-Spectroscopy Allergen Detection
| Reagent/Material | Function | Specification Requirements |
|---|---|---|
| Certified Allergen Reference Materials | Quantification calibration | CRM certified for target allergenic proteins (Ara h 1, Bos d 5, etc.) |
| Matrix-Matched Calibration Standards | Method accuracy verification | Varying allergen concentrations in representative food matrices |
| Spectral Quality Control Materials | Instrument performance verification | Stable reference materials with known spectral features |
| Sample Preparation Reagents | Homogenization and extraction | Consistent purity, minimal spectral interference |
| Cleaning Validation Standards | Prevention of cross-contamination | Solvents with demonstrated efficacy for allergen removal |
Global Harmonization and Standardization Challenges
The international regulatory landscape for allergen detection presents significant harmonization challenges. Differing allergen lists, threshold approaches, and method requirements across jurisdictions complicate global compliance strategies [2]. The European Union's extended allergen list and varying reference methods necessitate careful method validation across regulatory domains.
Emerging international standards organizations are working toward harmonized approaches for allergen detection, including validation protocols for alternative methods like AI-driven spectroscopy. The FDA's recent activities, including the September 16, 2025 Virtual Public Meeting on Food Allergen Thresholds, signal ongoing evolution in this area [100]. Method developers should engage with standards organizations early in the development process to align with emerging international consensus.
Figure 2: Regulatory Acceptance Pathway for Novel Methods
The integration of AI-driven spectroscopy into mainstream allergen detection protocols represents a paradigm shift with significant potential to enhance detection capabilities, reduce analysis time, and improve prevention of allergen-related incidents. As regulatory agencies increasingly focus on undeclared allergens as a leading food safety risk, technological innovations that demonstrate superior performance, robustness, and reliability will find receptive audiences.
Successful regulatory acceptance will depend on comprehensive validation against established methods, transparent AI model governance, and adherence to data integrity principles. The evolving nature of allergen regulations—exemplified by the recent addition of sesame to the major allergen list—requires flexible, adaptable detection platforms capable of responding to emerging scientific and regulatory developments. AI-driven spectroscopy platforms, with their capacity for continuous improvement and method refinement, are uniquely positioned to meet these evolving demands while maintaining the rigorous standardization required for regulatory compliance.
Conclusion
The fusion of AI and spectroscopy marks a paradigm shift in allergen detection, offering unparalleled sensitivity, non-destructive analysis, and real-time capabilities that far surpass traditional methods. Key takeaways include the demonstrated success of models like CNNs in achieving over 99% accuracy, the critical role of aptamer-integrated sensors for specificity, and the effective use of techniques like NIRS for detecting stable allergens such as nsLTPs. Future directions must focus on overcoming computational and cost barriers through miniaturization and standardized protocols, validating these technologies in clinical settings for personalized allergy management, and exploring their potential in predicting the allergenicity of novel ingredients. For biomedical research, this convergence paves the way for advanced diagnostic tools and a deeper understanding of immune responses, ultimately enhancing public health protection.
References
- 1. Methodology of the international cross-sectional ... [https://pmc.ncbi.nlm.nih.gov/articles/PMC12397821/]
- 2. The Magnitude and Impact of Food Allergens ... [https://pmc.ncbi.nlm.nih.gov/articles/PMC11011628/]
- 3. The hidden price of food allergy: Understanding the social ... [https://pmc.ncbi.nlm.nih.gov/articles/PMC12412086/]
- 4. Editorial: The Socio-economic Burden of Food Allergy [https://www.frontiersin.org/journals/allergy/articles/10.3389/falgy.2025.1608998/full]
- 5. Innovations shaping the future of food allergen testing [https://allergenbureau.net/innovations-shaping-the-future-of-food-allergen-testing/]
- 6. Food Allergies In 2025: What Everyone Needs To Know! [https://heclinics.com/food-allergies-in-2025-what-everyone-needs-to-know/]
- 7. Multi-laboratory validation of the xMAP— Food ... Allergen Detection [https://journals.plos.org/plosone/article?id=10.1371/journal.pone.0234899]
- 8. Efficient protein extraction for assessing food allergy risk in ... [https://www.sciencedirect.com/science/article/pii/S0308814624028711]
- 9. Artificial Intelligence in Analytical Spectroscopy, Part II [https://www.spectroscopyonline.com/view/artificial-intelligence-in-analytical-spectroscopy-part-ii-examples-in-spectroscopy]
- 10. An overview of ELISA: a review and update on best laboratory ... [https://pmc.ncbi.nlm.nih.gov/articles/PMC11808753/]
- 11. The advantages and the limitations of LC-MS/MS and Elisa ... [https://www.biotrial.com/bioanalysis-lc-ms-ms-vs-elisa/]
- 12. How to Address ELISA Challenges in Preclinical PK ... [https://www.gyrosproteintechnologies.com/spinblog/how-to-address-elisa-challenges-in-preclinical-pk-studies-with-advanced-microfluidic-technology]
- 13. Quantitative bioanalysis by inductively coupled plasma ... [https://www.sciencedirect.com/science/article/abs/pii/S0165993624000347]
- 14. PCR-based diagnostics for infectious diseases [https://pmc.ncbi.nlm.nih.gov/articles/PMC7106425/]
- 15. Digital PCR as an effective tool for GMO quantification in ... [https://www.sciencedirect.com/science/article/pii/S0308814619308271]
- 16. Compensate for or Minimize Matrix Effects? Strategies ... [https://pmc.ncbi.nlm.nih.gov/articles/PMC7412464/]
- 17. Machine Learning-Assisted Surface-Enhanced Raman ... [https://pmc.ncbi.nlm.nih.gov/articles/PMC11603787/]
- 18. Novel Artificial Intelligence Approach For nsLTP Early ... [https://link.springer.com/article/10.1007/s12161-025-02851-6]
- 19. FT-IR–Raman Combination: The Perfect Analytical ... [https://www.spectroscopyonline.com/view/ft-ir-raman-combination-perfect-analytical-solution-vibrational-spectroscopists]
- 20. FTIR vs Raman Spectroscopy: Which Technique Suits Your ... [https://www.labmanager.com/ftir-vs-raman-spectroscopy-which-technique-suits-your-analysis-33682]
- 21. Combining AI Tools with Non-Destructive Technologies for ... [https://pmc.ncbi.nlm.nih.gov/articles/PMC10777928/]
- 22. Machine learning-enabled nondestructive quality analysis ... [https://link.springer.com/article/10.1007/s44462-025-00013-9]
- 23. Strategies for analysing hyperspectral imaging data ... [https://www.sciencedirect.com/science/article/pii/S0026265X25013487]
- 24. Hyperspectral Imaging Aiding Artificial Intelligence [https://www.mdpi.com/2076-3417/14/21/9821]
- 25. A review on spectral data preprocessing techniques for ... [https://www.sciencedirect.com/science/article/pii/S258900422501020X]
- 26. Machine learning in spectral domain [https://www.nature.com/articles/s41467-021-21481-0]
- 27. Using deep learning algorithms to perform accurate ... [https://www.sciencedirect.com/science/article/abs/pii/S003040262100156X]
- 28. Spectral Classification Based on Deep Learning Algorithms [https://www.mdpi.com/2079-9292/10/16/1892]
- 29. Machine Learning-Empowered FTIR Spectroscopy Serum ... [https://pubmed.ncbi.nlm.nih.gov/32708591/]
- 30. spectrai: A deep learning framework for spectral data [https://arxiv.org/abs/2108.07595]
- 31. How can AI Help With Food Allergen Detection and ... [https://allergenbureau.net/how-can-ai-help-with-food-allergen-detection-and-quantification/]
- 32. Food Allergenicity Evaluation Methods: Classification, ... [https://pmc.ncbi.nlm.nih.gov/articles/PMC12191692/]
- 33. Integrating AI and advanced spectroscopic techniques for ... [https://www.sciencedirect.com/science/article/pii/S0924224424005260]
- 34. Machine Learning Advances Spectroscopic Imaging in ... [https://www.spectroscopyonline.com/view/machine-learning-advances-spectroscopic-imaging-in-biomedical-research]
- 35. Application and research progress of artificial intelligence ... [https://pmc.ncbi.nlm.nih.gov/articles/PMC12035833/]
- 36. Sniffing Out the Benefits of AI in Allergen Testing [https://ambiq.com/blog/sniffing-out-the-benefits-of-ai-in-allergen-testing/]
- 37. Explainable AI for unveiling deep learning pollen ... [https://www.nature.com/articles/s41598-023-30064-6]
- 38. Convolutional autoencoder based condition monitoring ... [https://www.nature.com/articles/s41598-025-26114-w]
- 39. A performance analysis of convolutional autoencoder ... [https://www.nature.com/articles/s41598-025-20470-3]
- 40. Integration of Artificial Intelligence in Biosensors for ... [https://www.mdpi.com/2079-6374/15/10/690]
- 41. AI-Enhanced Allergy Diagnostics: Streamlining Healthcare ... [https://pmc.ncbi.nlm.nih.gov/articles/PMC11517541/]
- 42. Rapid and accurate electrochemical sensor for food ... [https://www.nature.com/articles/s41598-021-00241-6]
- 43. Food Quality Controls with Hyperspectral Imaging [https://www.livingoptics.com/food-quality-controls-with-hyperspectral-imaging/]
- 44. Non-destructive hyperspectral imaging technology to assess ... [https://fppn.biomedcentral.com/articles/10.1186/s43014-024-00246-4]
- 45. FTIR Applications | Thermo Fisher Scientific - AU [https://www.thermofisher.com/au/en/home/industrial/spectroscopy-elemental-isotope-analysis/molecular-spectroscopy/fourier-transform-infrared-spectroscopy/applications.html]
- 46. FT-IR Spectroscopy Mini-Tutorial: Principles, Practice, and ... [https://www.spectroscopyonline.com/view/ft-ir-spectroscopy-mini-tutorial-principles-practice-and-applications-across-disciplines]
- 47. AI-Powered Advances in Data Handling for Enhanced ... [https://pmc.ncbi.nlm.nih.gov/articles/PMC12523821/]
- 48. New Study Uses Machine Learning and Raman ... [https://www.spectroscopyonline.com/view/new-study-uses-machine-learning-and-raman-spectroscopy-for-highly-accurate-foodborne-pathogen-detection]
- 49. Aptamer-Based Biosensors for Rapid Detection and Early ... [https://pmc.ncbi.nlm.nih.gov/articles/PMC12655300/]
- 50. Designing the Future of Biosensing: Advances in Aptamer ... [https://www.mdpi.com/2079-6374/15/10/637]
- 51. Challenges in the Use of AI-Driven Non-Destructive ... [https://www.mdpi.com/2304-8158/13/6/846]
- 52. A comprehensive review on optical and electrochemical ... [https://www.frontiersin.org/journals/nutrition/articles/10.3389/fnut.2025.1596673/full]
- 53. Research Progress on Aptamer Electrochemical ... [https://www.mdpi.com/1424-8220/25/14/4367]
- 54. Advances in aptamer-based electrochemical biosensors for ... [https://pubs.rsc.org/en/content/articlehtml/2025/nh/d5nh00368g]
- 55. Deep MALDI-MS spatial omics guided by quantum ... [https://pmc.ncbi.nlm.nih.gov/articles/PMC12098849/]
- 56. Quantitative Mass Spectrometry Imaging Protocols for ... [https://pmc.ncbi.nlm.nih.gov/articles/PMC12138873/]
- 57. A Newcomer's Guide to Using Surface Enhanced Raman ... [https://www.spectroscopyonline.com/view/demystifying-sers-newcomer-s-guide-using-surface-enhanced-raman-scattering]
- 58. Application of Raman Spectroscopic Methods in Food Safety [https://pmc.ncbi.nlm.nih.gov/articles/PMC8229164/]
- 59. Design, Fabrication, and Applications of SERS Substrates ... [https://www.mdpi.com/2072-666X/14/7/1343]
- 60. Food Allergen Detection in Complex Matrices Utilizing the ... [https://www.thermofisher.com/blog/analyteguru/food-allergen-detection-in-complex-matrices-utilizing-the-power/]
- 61. Near-infrared spectroscopy detects food allergens [https://www.biotechniques.com/analytical-chemistry/near-infrared-spectroscopy-detects-food-allergens/]
- 62. Miniaturized spectroscopy and AI-driven probes in food ... [https://www.sciencedirect.com/science/article/pii/S0963996925009846]
- 63. Reagent-free Detection of Multiple Allergens in Gluten ... [https://www.spectroscopyonline.com/view/reagent-free-detection-of-multiple-allergens-in-gluten-free-flour-using-nir-spectroscopy-and-multivariate-analysis]
- 64. Machine learning spectroscopy to advance computation ... [https://pmc.ncbi.nlm.nih.gov/articles/PMC12590498/]
- 65. Data Augmentation Techniques for Machine Learning ... [https://www.mdpi.com/1424-8220/23/20/8562]
- 66. Emerging Applications, Explainable AI, and Future Trends [https://www.spectroscopyonline.com/view/recent-research-in-chemometrics-and-ai-for-spectroscopy-part-ii-emerging-applications-explainable-ai-and-future-trends]
- 67. Utilizing tables, figures, charts and graphs to enhance the ... [https://pmc.ncbi.nlm.nih.gov/articles/PMC10394528/]
- 68. Figures and Charts - UNC Writing Center [https://writingcenter.unc.edu/tips-and-tools/figures-and-charts/]
- 69. Edge AI technology: driving Industry 4.0 in 2025 [https://fabrity.com/blog/edge-ai-technology-driving-industry-4-0-in-2025/]
- 70. Research progress on detection methods for food allergens [https://www.sciencedirect.com/science/article/abs/pii/S0889157524009402]
- 71. AI Shakes Up Spectroscopy as New Tools Reveal the ... [https://www.spectroscopyonline.com/view/ai-shakes-up-spectroscopy-as-new-tools-reveal-the-secret-life-of-molecules]
- 72. Advances in Molecular Vibrational Spectroscopy for ... [https://pubmed.ncbi.nlm.nih.gov/41051327/]
- 73. Mid-Infrared Spectroscopy for the Qualitative and ... [https://chemrxiv.org/engage/chemrxiv/article-details/689a00be728bf9025e047fdb]
- 74. Allergy Diagnostics Global Overview Report 2025 | Market ... [https://finance.yahoo.com/news/allergy-diagnostics-global-overview-report-104100046.html]
- 75. Mass Spectrometer Costs: How Much Should You Budget? [https://www.excedr.com/blog/mass-spectrometer-pricing-guide]
- 76. Food allergen detection by mass spectrometry: the role of ... [https://www.nature.com/articles/npjsba201622]
- 77. The application of microfluidic technology in allergen ... [https://pmc.ncbi.nlm.nih.gov/articles/PMC12150919/]
- 78. Recent research progress in the integration of Raman ... [https://www.sciopen.com/article/10.26599/NR.2025.94907834]
- 79. AI-Powered Raman Spectroscopy Signals New Era for ... [https://www.spectroscopyonline.com/view/ai-powered-raman-spectroscopy-signals-new-era-for-drug-development-and-disease-diagnosis]
- 80. An Interview with 2025 Emerging Leader in Molecular ... [https://www.spectroscopyonline.com/view/harnessing-raman-spectroscopy-and-machine-learning-for-liquid-biopsy-classification-an-interview-with-2025-emerging-leader-in-molecular-spectroscopy-award-winner-lingyan-shi]
- 81. Comparing Raman Spectroscopy-Based Artificial ... [https://pmc.ncbi.nlm.nih.gov/articles/PMC11675745/]
- 82. Reagent-free detection of multiple allergens in gluten ... [https://www.sciencedirect.com/science/article/pii/S0889157523001989]
- 83. Partial Least Squares-Discriminant Analysis Classification ... [https://pmc.ncbi.nlm.nih.gov/articles/PMC10077434/]
- 84. A Comparison of PCA-LDA and PLS-DA Techniques for ... [https://www.mdpi.com/2076-3417/12/11/5345]
- 85. Conventional versus AI-based spectral data processing ... [https://pubs.rsc.org/en/content/articlelanding/2025/ay/d5ay00027k]
- 86. Comparison of Convolutional and conventional Artificial ... [https://pubmed.ncbi.nlm.nih.gov/35291826/]
- 87. AI vs Traditional Methods: A Comparative Analysis of Data ... [https://superagi.com/ai-vs-traditional-methods-a-comparative-analysis-of-data-driven-decision-making-in-2025/]
- 88. AllergenScreener [https://www.bruker.com/en/products-and-solutions/mass-spectrometry/ms-solutions/allergenscreener.html]
- 89. Liquid Chromatography and Mass Spectrometry in Food ... [https://pubmed.ncbi.nlm.nih.gov/21333155/]
- 90. (PDF) Matrix -corrected mass spectrometry enables sensitive... [https://scispace.com/papers/matrix-corrected-mass-spectrometry-enables-sensitive-2iywz6tij3]
- 91. Food Allergen Testing Market - Share, Size & Outlook [https://www.mordorintelligence.com/industry-reports/food-allergen-testing-market]
- 92. Allergens in Food: Analytical LC-MS/MS Method for the ... [https://pmc.ncbi.nlm.nih.gov/articles/PMC12428185/]
- 93. Deep Learning-Enhanced Spectroscopic Technologies for ... [https://pmc.ncbi.nlm.nih.gov/articles/PMC12248972/]
- 94. Current Application of Advancing Spectroscopy Techniques in ... [https://pmc.ncbi.nlm.nih.gov/articles/PMC10379817/]
- 95. A review of machine learning in hyperspectral imaging for ... [https://www.sciencedirect.com/science/article/pii/S0924203125000621]
- 96. Recent Research in Chemometrics and AI for Spectroscopy, Part I: Foundations, Definitions, and the Integration of Artificial Intelligence in Chemometric Analysis | Spectroscopy Online [https://www.spectroscopyonline.com/view/recent-research-in-chemometrics-and-ai-for-spectroscopy-part-i-foundations-definitions-and-the-integration-of-artificial-intelligence-in-chemometric-analysis]
- 97. The Role of Artificial Intelligence in Supply Chain ... [https://auctoresonline.org/article/the-role-of-artificial-intelligence-in-supply-chain-management-a-quantitative-exploration-of-its-impact-on-efficiency-and-performance]
- 98. Artificial Intelligence Foundation for Spectroscopy [https://arxiv.org/html/2508.01188v4]
- 99. AI in GxP Manufacturing: Join xTelliGent Two Summit 2025 [https://www.continuousintelligence.ai/blog/ai-in-gxp-manufacturing-xtelligent-two-summit-2025]
- 100. Food Allergies [https://www.fda.gov/food/nutrition-food-labeling-and-critical-foods/food-allergies]
- 101. The Growing Importance of Allergen Testing: How Certified ... [https://fsns.com/the-growing-importance-of-allergen-testing-how-certified-group-ensures-food-safety-with-elisa/]
- 102. Allergen Testing in Food Labs for Safer Food Production [https://www.lablynx.com/resources/articles/allergen-testing-food-labs/]
- 103. FDA AI Guidance 2025: What Life Sciences Must Do Now [https://usdm.com/resources/blogs/fda-ai-guidance-2025-life-sciences-compliance]
- 104. FDA Proposes Rule for Mandatory Asbestos Testing of Talc ... [https://www.sgs.com/en-us/news/2025/03/safeguards-05025-fda-proposes-rule-for-mandatory-asbestos-testing-of-talc-containing-cosmetics]